
|
|||||
|
 | |
| |
| |
| |
| |
| |
|
Gene: ALG14 |
Gene summary for ALG14 |
| Gene information | Species | Human | Gene symbol | ALG14 | Gene ID | 199857 |
| Gene name | ALG14 UDP-N-acetylglucosaminyltransferase subunit | |
| Gene Alias | CMS15 | |
| Cytomap | 1p21.3 | |
| Gene Type | protein-coding | GO ID | GO:0006464 | UniProtAcc | Q96F25 |
Top |
Malignant transformation analysis |
| Identification of the aberrant gene expression in precancerous and cancerous lesions by comparing the gene expression of stem-like cells in diseased tissues with normal stem cells |
| Entrez ID | Symbol | Replicates | Species | Organ | Tissue | Adj P-value | Log2FC | Malignancy |
| 199857 | ALG14 | LZE5T | Human | Esophagus | ESCC | 7.28e-04 | 3.25e-01 | 0.0514 |
| 199857 | ALG14 | LZE8T | Human | Esophagus | ESCC | 1.96e-03 | 1.36e-01 | 0.067 |
| 199857 | ALG14 | LZE24T | Human | Esophagus | ESCC | 1.02e-13 | 1.62e-01 | 0.0596 |
| 199857 | ALG14 | P2T-E | Human | Esophagus | ESCC | 3.94e-24 | 3.87e-01 | 0.1177 |
| 199857 | ALG14 | P4T-E | Human | Esophagus | ESCC | 2.75e-17 | 3.05e-01 | 0.1323 |
| 199857 | ALG14 | P5T-E | Human | Esophagus | ESCC | 4.48e-17 | 2.38e-01 | 0.1327 |
| 199857 | ALG14 | P8T-E | Human | Esophagus | ESCC | 4.49e-22 | 3.50e-01 | 0.0889 |
| 199857 | ALG14 | P9T-E | Human | Esophagus | ESCC | 2.79e-07 | 1.12e-01 | 0.1131 |
| 199857 | ALG14 | P10T-E | Human | Esophagus | ESCC | 1.18e-19 | 4.06e-01 | 0.116 |
| 199857 | ALG14 | P11T-E | Human | Esophagus | ESCC | 1.73e-05 | 2.85e-01 | 0.1426 |
| 199857 | ALG14 | P12T-E | Human | Esophagus | ESCC | 1.49e-56 | 1.18e+00 | 0.1122 |
| 199857 | ALG14 | P15T-E | Human | Esophagus | ESCC | 2.74e-11 | 2.46e-01 | 0.1149 |
| 199857 | ALG14 | P16T-E | Human | Esophagus | ESCC | 7.05e-08 | 2.20e-01 | 0.1153 |
| 199857 | ALG14 | P19T-E | Human | Esophagus | ESCC | 4.39e-03 | 1.86e-01 | 0.1662 |
| 199857 | ALG14 | P20T-E | Human | Esophagus | ESCC | 5.84e-19 | 2.99e-01 | 0.1124 |
| 199857 | ALG14 | P21T-E | Human | Esophagus | ESCC | 3.07e-10 | 1.71e-01 | 0.1617 |
| 199857 | ALG14 | P22T-E | Human | Esophagus | ESCC | 6.90e-15 | 1.77e-01 | 0.1236 |
| 199857 | ALG14 | P23T-E | Human | Esophagus | ESCC | 1.19e-14 | 2.40e-01 | 0.108 |
| 199857 | ALG14 | P24T-E | Human | Esophagus | ESCC | 2.33e-06 | 1.05e-01 | 0.1287 |
| 199857 | ALG14 | P26T-E | Human | Esophagus | ESCC | 1.21e-05 | 1.30e-01 | 0.1276 |
| Page: 1 2 3 4 5 |
| Tissue | Expression Dynamics | Abbreviation |
| Esophagus | 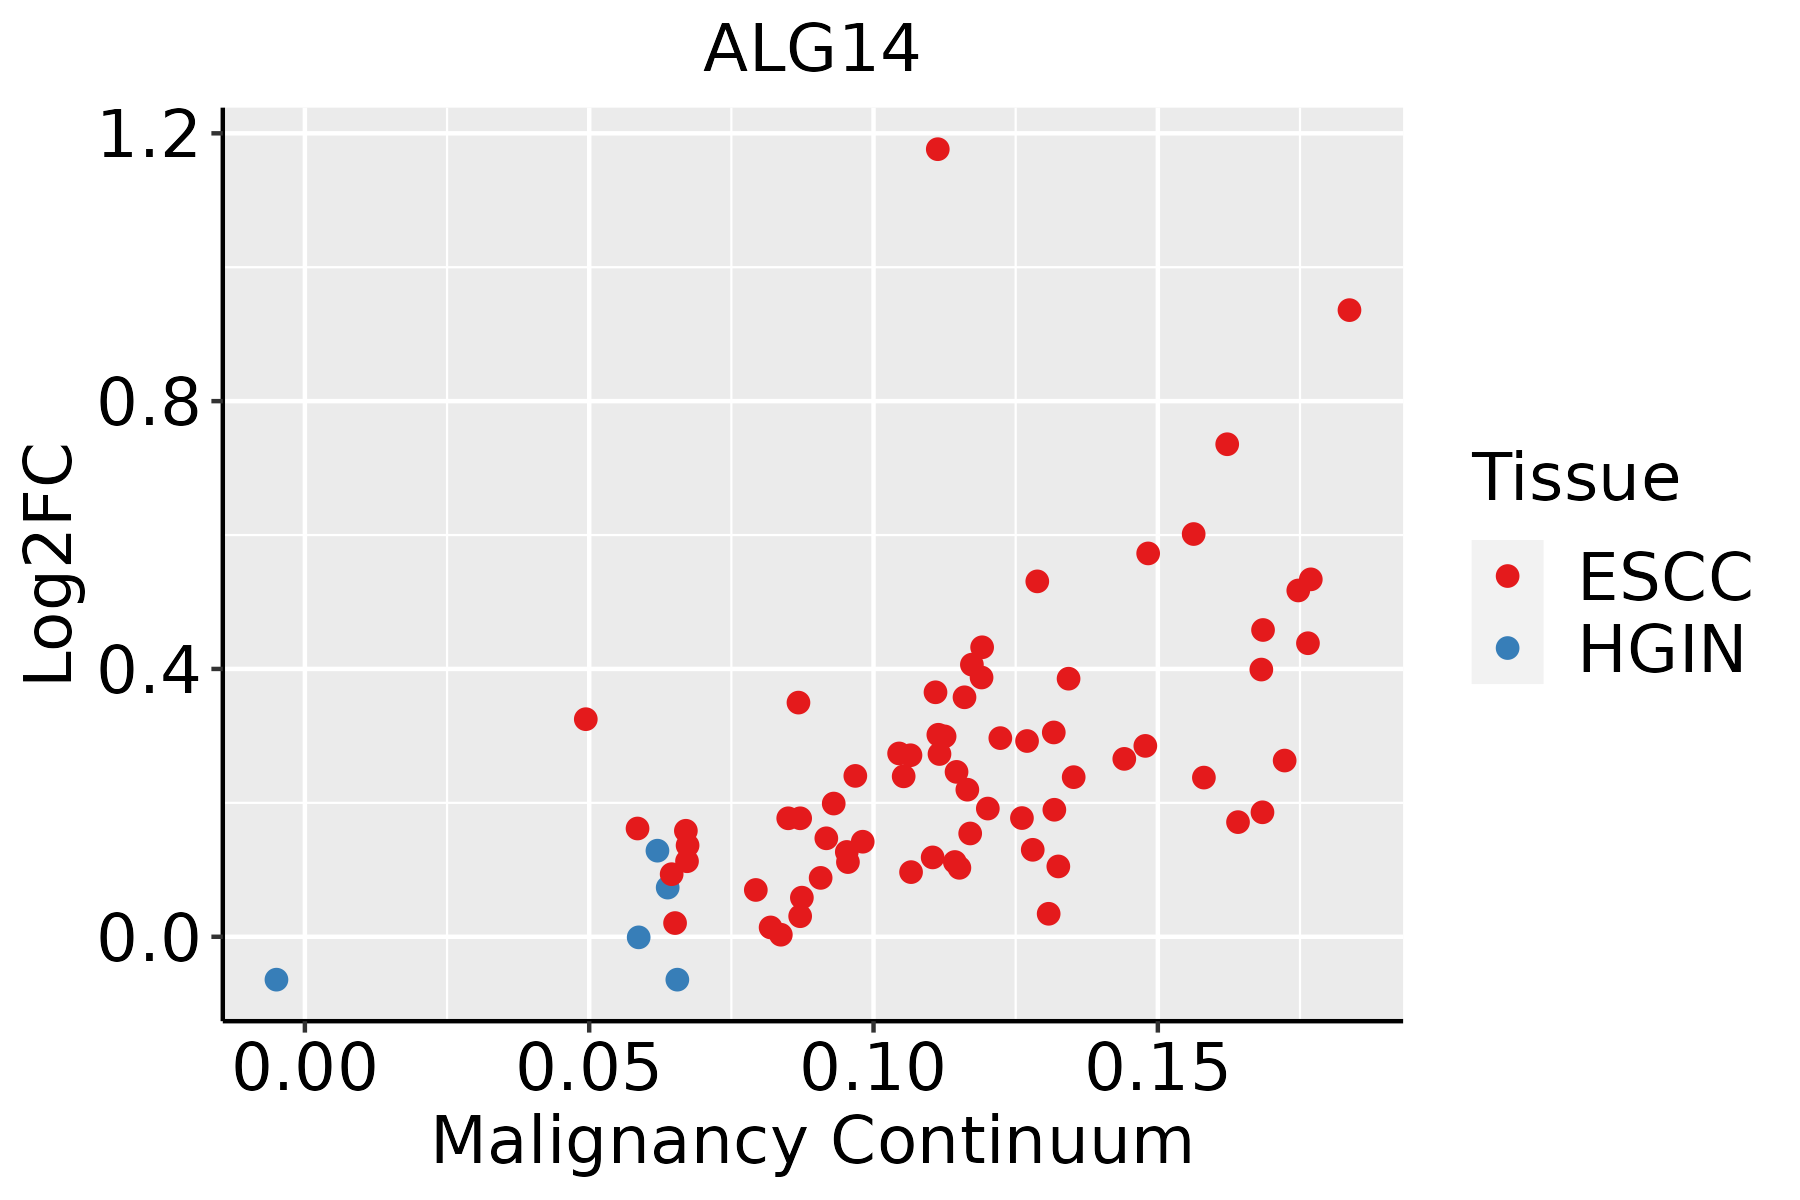 | ESCC: Esophageal squamous cell carcinoma |
| HGIN: High-grade intraepithelial neoplasias | ||
| LGIN: Low-grade intraepithelial neoplasias | ||
| Liver | 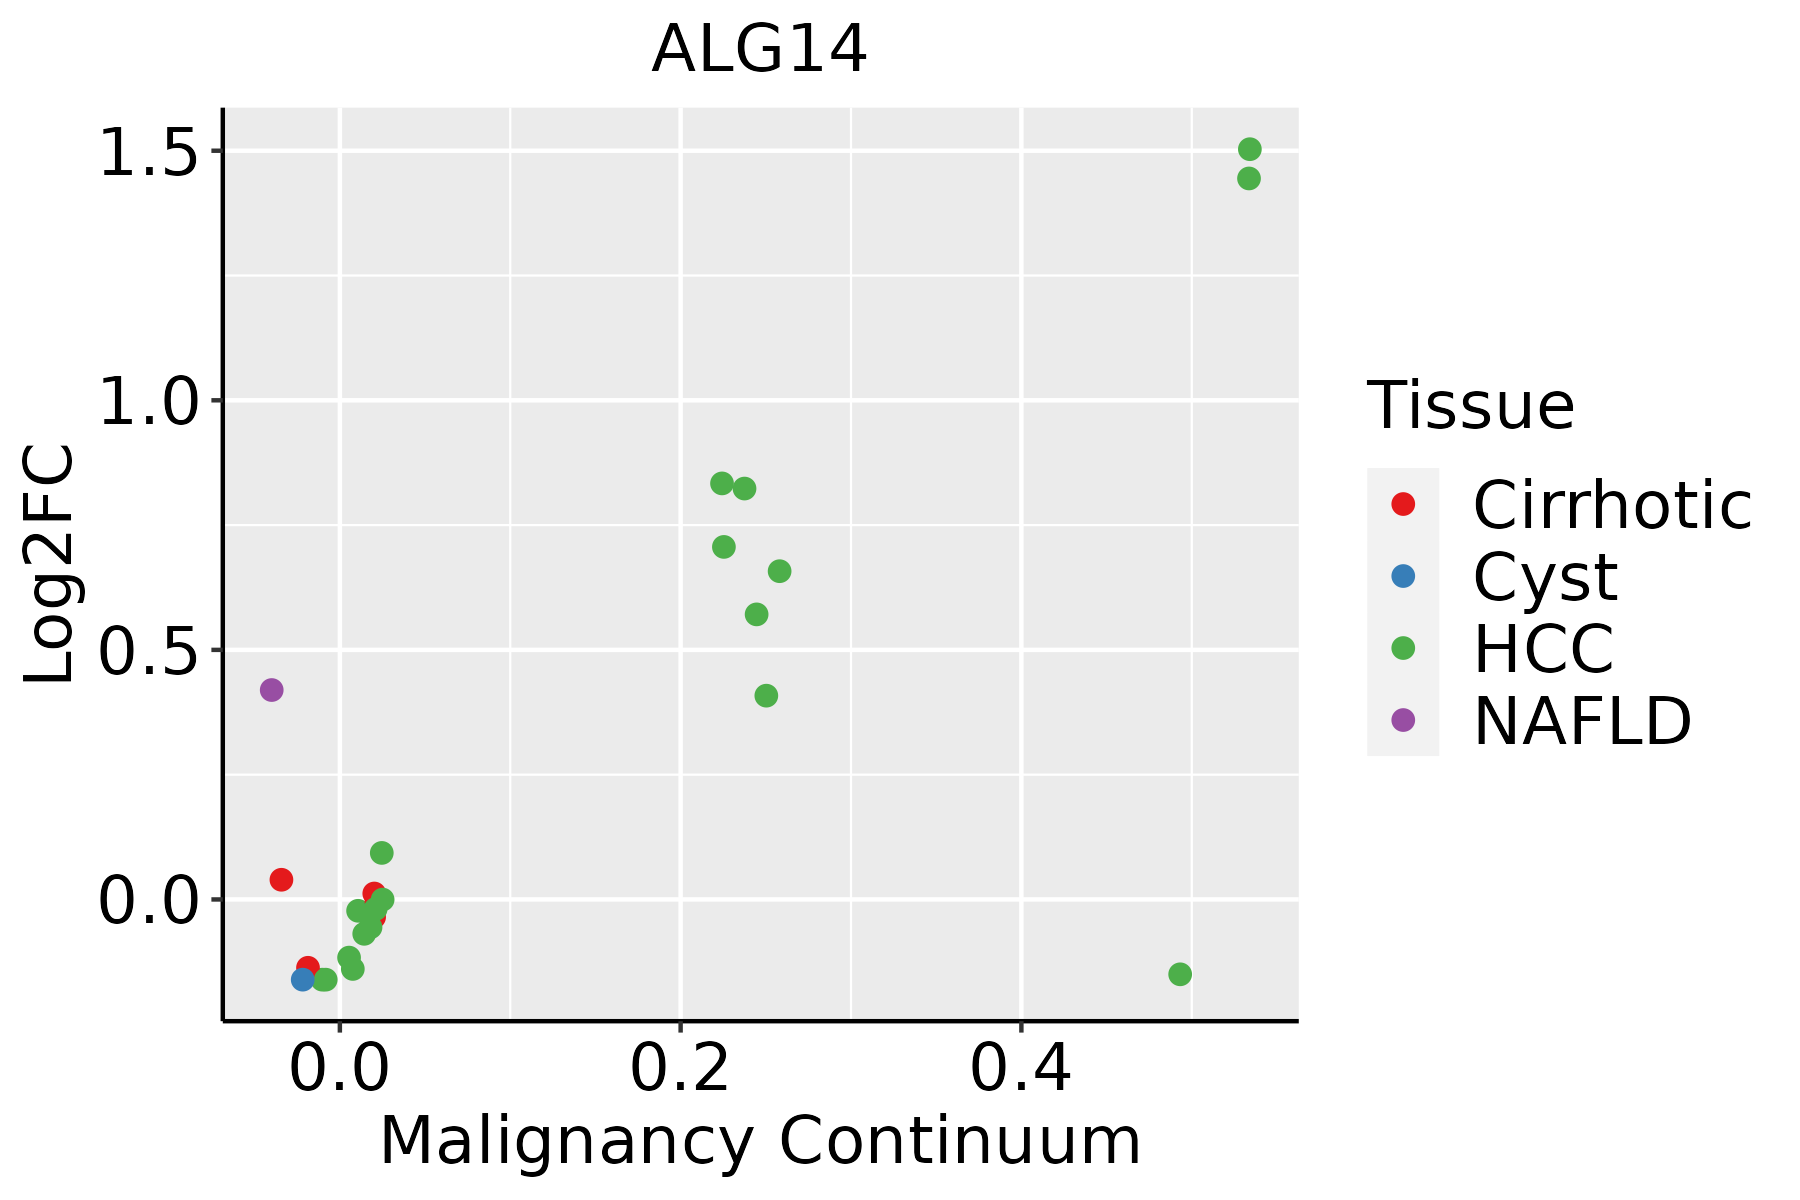 | HCC: Hepatocellular carcinoma |
| NAFLD: Non-alcoholic fatty liver disease | ||
| Oral Cavity | 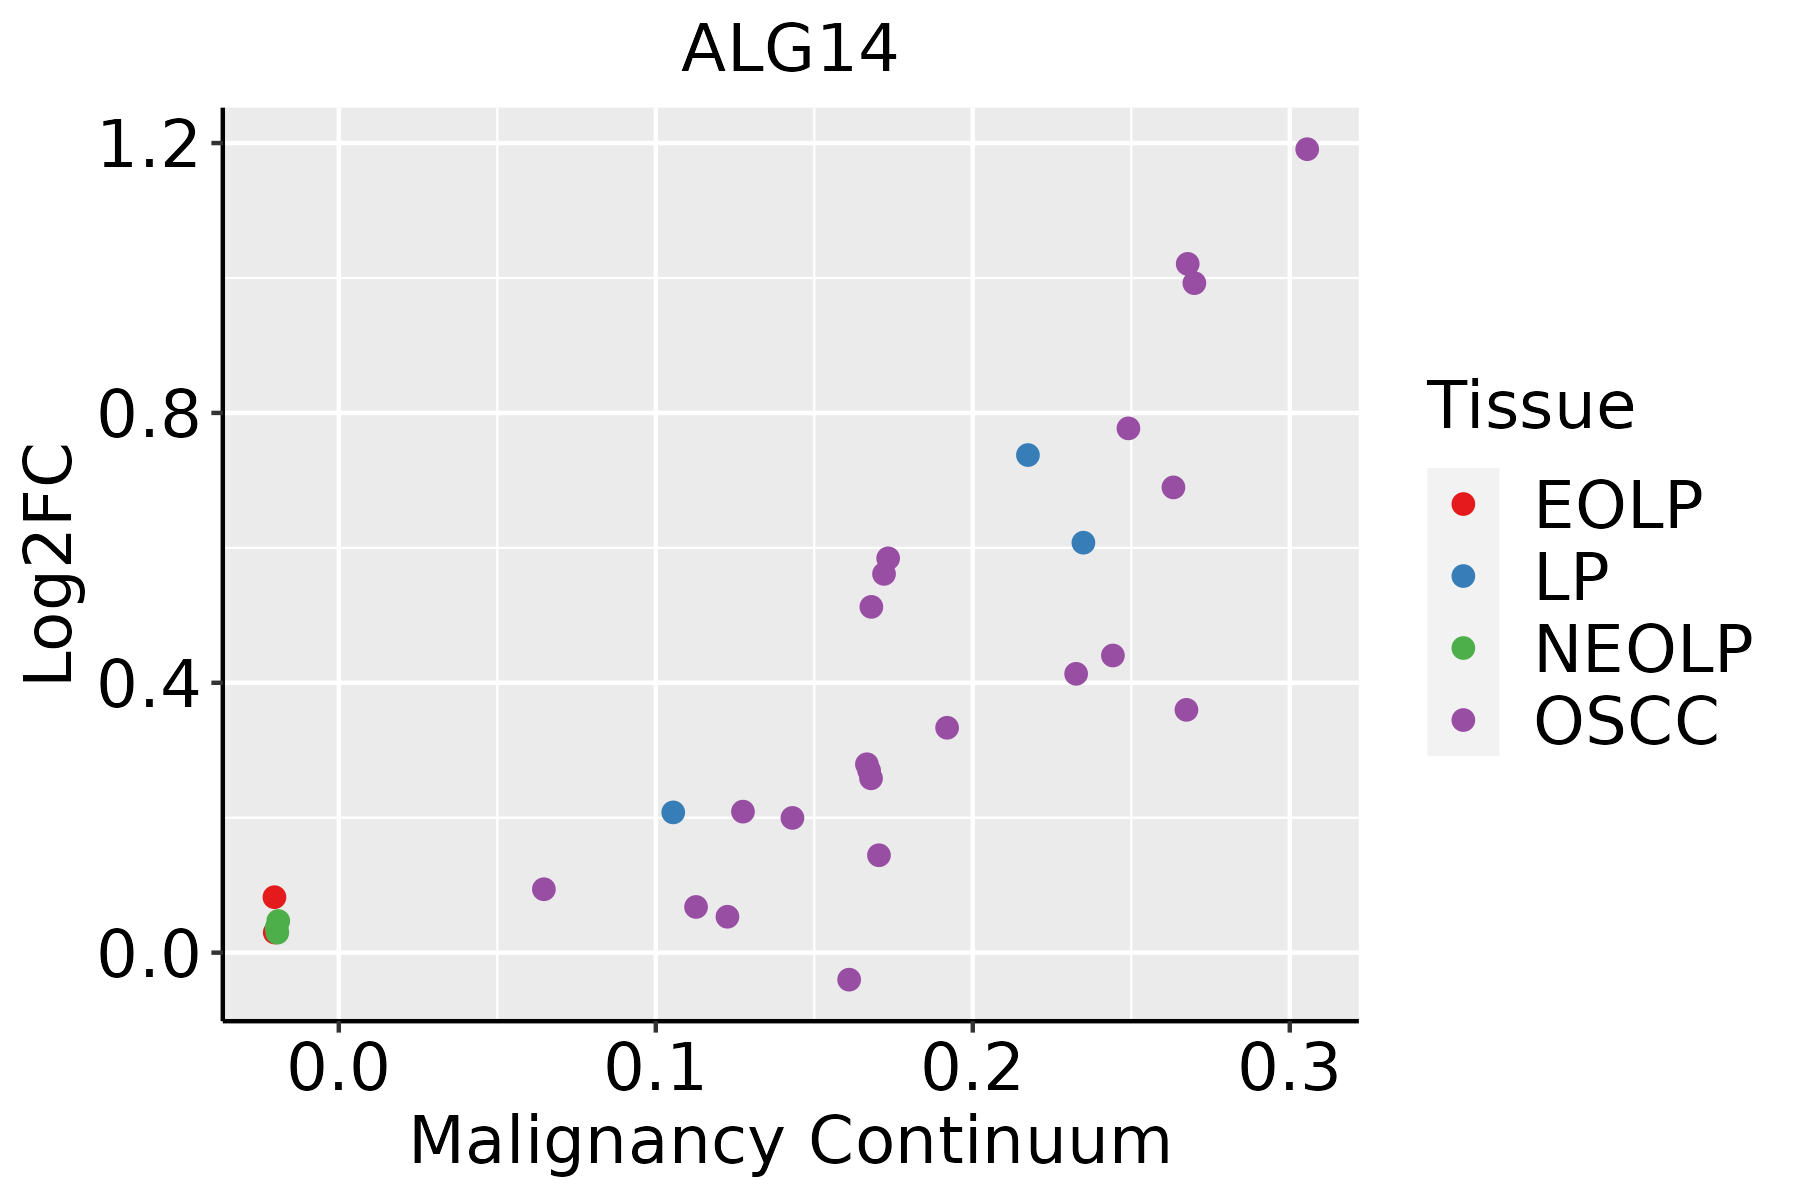 | EOLP: Erosive Oral lichen planus |
| LP: leukoplakia | ||
| NEOLP: Non-erosive oral lichen planus | ||
| OSCC: Oral squamous cell carcinoma | ||
| Skin | 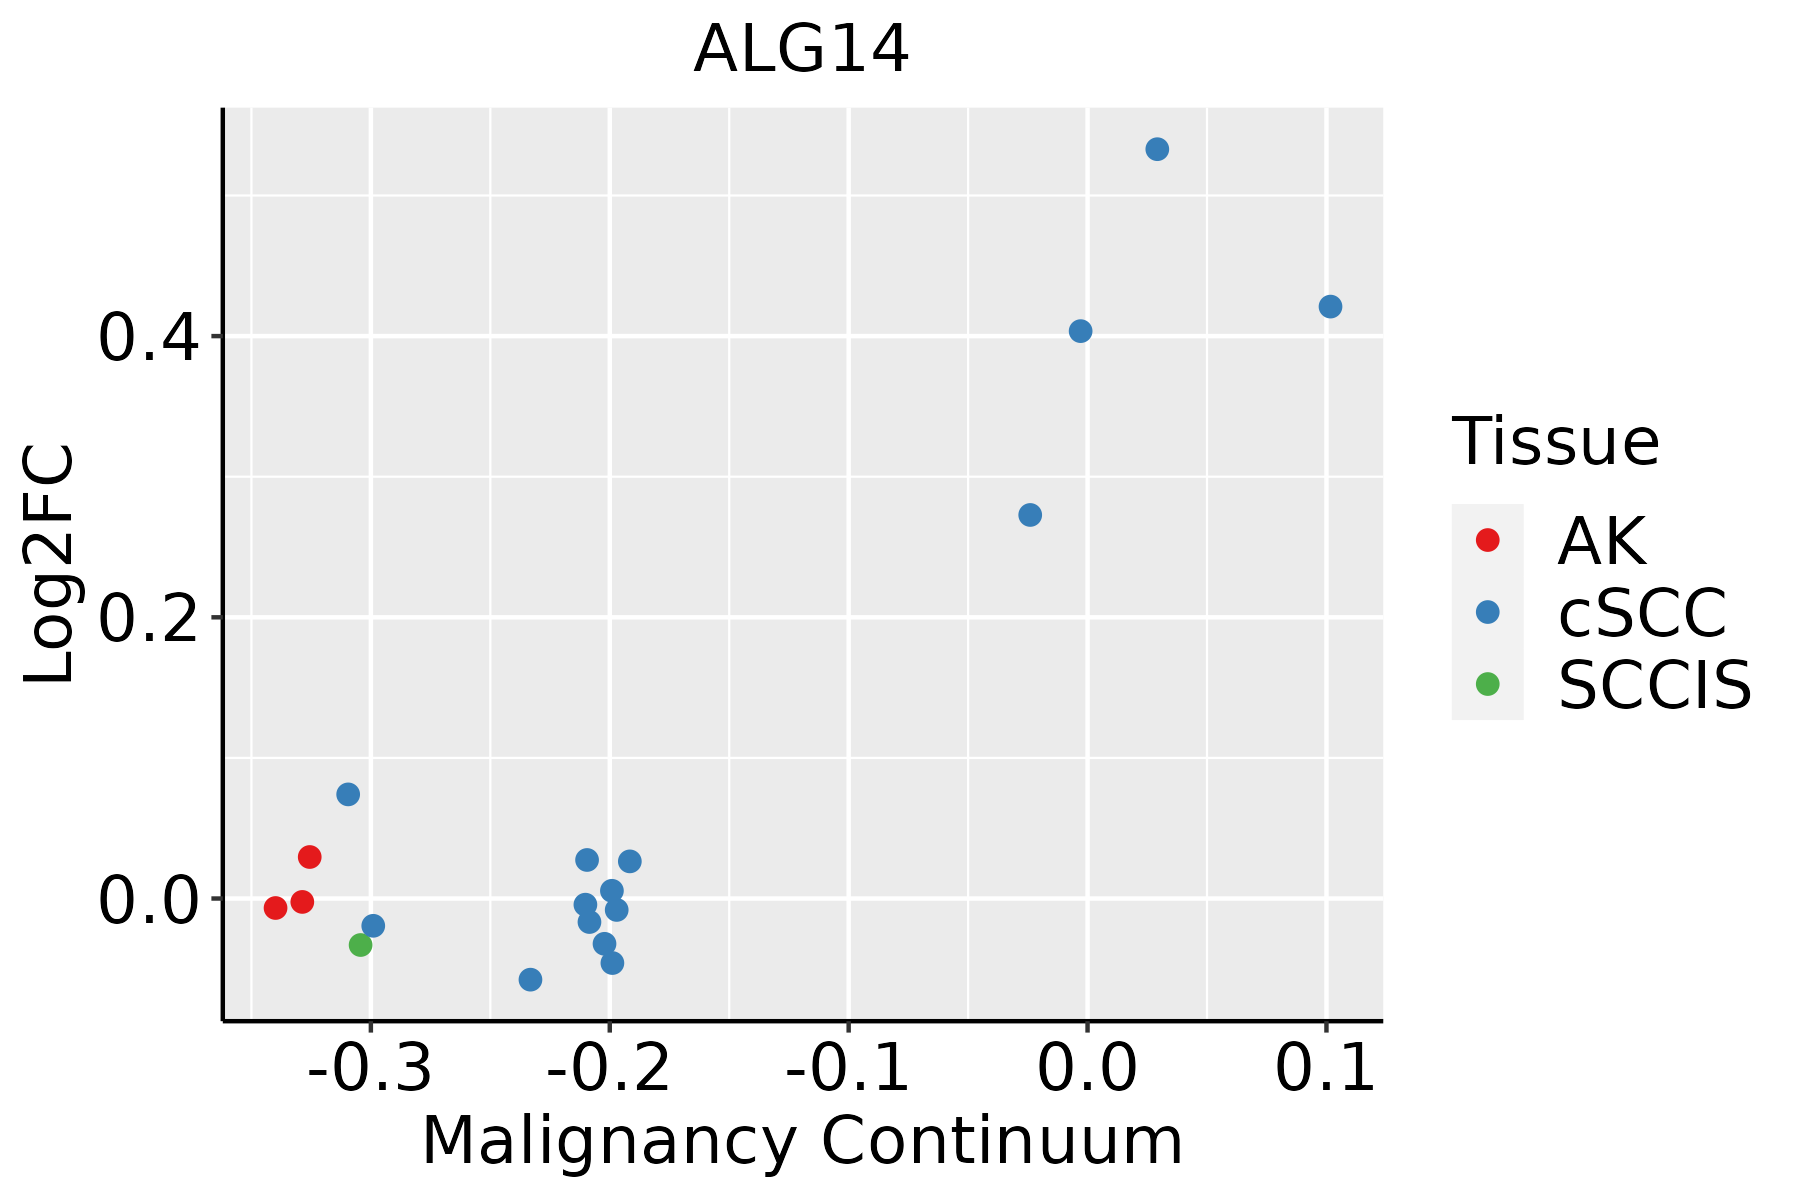 | AK: Actinic keratosis |
| cSCC: Cutaneous squamous cell carcinoma | ||
| SCCIS:squamous cell carcinoma in situ |
| ∗log2FC in expression of this searched gene in stem-like cells from each diseased tissue sample relative to stem-like cells in normal samples in each tissue plotted against the malignancy continuum. Samples are colored based on if they are from different disease stage. |
Top |
Malignant transformation related pathway analysis |
| Find out the enriched GO biological processes and KEGG pathways involved in transition from healthy to precancer to cancer |
| Tissue | Disease Stage | Enriched GO biological Processes |
| Colorectum | AD |  |
| Colorectum | SER |  |
| Colorectum | MSS |  |
| Colorectum | MSI-H |  |
| Colorectum | FAP |  |
| ∗Top 15 enriched GO BP terms are showed in the bar plot of each disease state in each tissue. Each row represents a significant GO biological process which is colored according to the -log10(p.adjust). |
| Page: 1 2 3 4 5 6 7 8 9 |
| GO ID | Tissue | Disease Stage | Description | Gene Ratio | Bg Ratio | pvalue | p.adjust | Count |
| GO:000648714 | Esophagus | ESCC | protein N-linked glycosylation | 51/8552 | 65/18723 | 6.41e-08 | 1.13e-06 | 51 |
| GO:00091002 | Esophagus | ESCC | glycoprotein metabolic process | 226/8552 | 387/18723 | 2.64e-07 | 3.94e-06 | 226 |
| GO:00700854 | Esophagus | ESCC | glycosylation | 144/8552 | 240/18723 | 5.12e-06 | 5.38e-05 | 144 |
| GO:00064865 | Esophagus | ESCC | protein glycosylation | 135/8552 | 226/18723 | 1.36e-05 | 1.24e-04 | 135 |
| GO:00434135 | Esophagus | ESCC | macromolecule glycosylation | 135/8552 | 226/18723 | 1.36e-05 | 1.24e-04 | 135 |
| GO:00091012 | Esophagus | ESCC | glycoprotein biosynthetic process | 181/8552 | 317/18723 | 2.54e-05 | 2.15e-04 | 181 |
| GO:00064882 | Esophagus | ESCC | dolichol-linked oligosaccharide biosynthetic process | 14/8552 | 18/18723 | 5.77e-03 | 2.14e-02 | 14 |
| GO:00064902 | Esophagus | ESCC | oligosaccharide-lipid intermediate biosynthetic process | 14/8552 | 19/18723 | 1.27e-02 | 4.21e-02 | 14 |
| GO:00064873 | Liver | Cirrhotic | protein N-linked glycosylation | 30/4634 | 65/18723 | 1.40e-04 | 1.36e-03 | 30 |
| GO:000648711 | Liver | HCC | protein N-linked glycosylation | 48/7958 | 65/18723 | 2.85e-07 | 5.00e-06 | 48 |
| GO:00064862 | Liver | HCC | protein glycosylation | 122/7958 | 226/18723 | 3.11e-04 | 2.21e-03 | 122 |
| GO:00434132 | Liver | HCC | macromolecule glycosylation | 122/7958 | 226/18723 | 3.11e-04 | 2.21e-03 | 122 |
| GO:00700852 | Liver | HCC | glycosylation | 128/7958 | 240/18723 | 4.35e-04 | 2.92e-03 | 128 |
| GO:0009100 | Liver | HCC | glycoprotein metabolic process | 193/7958 | 387/18723 | 1.89e-03 | 9.62e-03 | 193 |
| GO:00064875 | Oral cavity | OSCC | protein N-linked glycosylation | 44/7305 | 65/18723 | 2.63e-06 | 3.26e-05 | 44 |
| GO:0006488 | Oral cavity | OSCC | dolichol-linked oligosaccharide biosynthetic process | 15/7305 | 18/18723 | 1.53e-04 | 1.07e-03 | 15 |
| GO:00091001 | Oral cavity | OSCC | glycoprotein metabolic process | 185/7305 | 387/18723 | 2.37e-04 | 1.54e-03 | 185 |
| GO:0006490 | Oral cavity | OSCC | oligosaccharide-lipid intermediate biosynthetic process | 15/7305 | 19/18723 | 4.64e-04 | 2.76e-03 | 15 |
| GO:00091011 | Oral cavity | OSCC | glycoprotein biosynthetic process | 151/7305 | 317/18723 | 1.01e-03 | 5.26e-03 | 151 |
| GO:00064864 | Oral cavity | OSCC | protein glycosylation | 111/7305 | 226/18723 | 1.22e-03 | 6.10e-03 | 111 |
| Page: 1 2 |
| Pathway ID | Tissue | Disease Stage | Description | Gene Ratio | Bg Ratio | pvalue | p.adjust | qvalue | Count |
| hsa0051023 | Esophagus | ESCC | N-Glycan biosynthesis | 39/4205 | 53/8465 | 3.26e-04 | 1.15e-03 | 5.89e-04 | 39 |
| hsa005136 | Esophagus | ESCC | Various types of N-glycan biosynthesis | 31/4205 | 42/8465 | 1.23e-03 | 3.78e-03 | 1.93e-03 | 31 |
| hsa0051033 | Esophagus | ESCC | N-Glycan biosynthesis | 39/4205 | 53/8465 | 3.26e-04 | 1.15e-03 | 5.89e-04 | 39 |
| hsa0051313 | Esophagus | ESCC | Various types of N-glycan biosynthesis | 31/4205 | 42/8465 | 1.23e-03 | 3.78e-03 | 1.93e-03 | 31 |
| hsa005104 | Liver | Cirrhotic | N-Glycan biosynthesis | 32/2530 | 53/8465 | 3.82e-06 | 4.10e-05 | 2.53e-05 | 32 |
| hsa005134 | Liver | Cirrhotic | Various types of N-glycan biosynthesis | 26/2530 | 42/8465 | 1.65e-05 | 1.41e-04 | 8.69e-05 | 26 |
| hsa0051011 | Liver | Cirrhotic | N-Glycan biosynthesis | 32/2530 | 53/8465 | 3.82e-06 | 4.10e-05 | 2.53e-05 | 32 |
| hsa0051311 | Liver | Cirrhotic | Various types of N-glycan biosynthesis | 26/2530 | 42/8465 | 1.65e-05 | 1.41e-04 | 8.69e-05 | 26 |
| hsa0051021 | Liver | HCC | N-Glycan biosynthesis | 40/4020 | 53/8465 | 2.95e-05 | 1.87e-04 | 1.04e-04 | 40 |
| hsa005132 | Liver | HCC | Various types of N-glycan biosynthesis | 30/4020 | 42/8465 | 1.41e-03 | 5.07e-03 | 2.82e-03 | 30 |
| hsa0051031 | Liver | HCC | N-Glycan biosynthesis | 40/4020 | 53/8465 | 2.95e-05 | 1.87e-04 | 1.04e-04 | 40 |
| hsa005133 | Liver | HCC | Various types of N-glycan biosynthesis | 30/4020 | 42/8465 | 1.41e-03 | 5.07e-03 | 2.82e-03 | 30 |
| hsa005105 | Oral cavity | OSCC | N-Glycan biosynthesis | 39/3704 | 53/8465 | 9.77e-06 | 4.36e-05 | 2.22e-05 | 39 |
| hsa005135 | Oral cavity | OSCC | Various types of N-glycan biosynthesis | 29/3704 | 42/8465 | 8.03e-04 | 2.32e-03 | 1.18e-03 | 29 |
| hsa0051012 | Oral cavity | OSCC | N-Glycan biosynthesis | 39/3704 | 53/8465 | 9.77e-06 | 4.36e-05 | 2.22e-05 | 39 |
| hsa0051312 | Oral cavity | OSCC | Various types of N-glycan biosynthesis | 29/3704 | 42/8465 | 8.03e-04 | 2.32e-03 | 1.18e-03 | 29 |
| hsa0051022 | Oral cavity | LP | N-Glycan biosynthesis | 31/2418 | 53/8465 | 4.86e-06 | 4.14e-05 | 2.67e-05 | 31 |
| hsa0051321 | Oral cavity | LP | Various types of N-glycan biosynthesis | 22/2418 | 42/8465 | 9.58e-04 | 4.49e-03 | 2.90e-03 | 22 |
| hsa0051032 | Oral cavity | LP | N-Glycan biosynthesis | 31/2418 | 53/8465 | 4.86e-06 | 4.14e-05 | 2.67e-05 | 31 |
| hsa0051331 | Oral cavity | LP | Various types of N-glycan biosynthesis | 22/2418 | 42/8465 | 9.58e-04 | 4.49e-03 | 2.90e-03 | 22 |
| Page: 1 |
Top |
Cell-cell communication analysis |
| Identification of potential cell-cell interactions between two cell types and their ligand-receptor pairs for different disease states |
| Ligand | Receptor | LRpair | Pathway | Tissue | Disease Stage |
| Page: 1 |
Top |
Single-cell gene regulatory network inference analysis |
| Find out the significant the regulons (TFs) and the target genes of each regulon across cell types for different disease states |
| TF | Cell Type | Tissue | Disease Stage | Target Gene | RSS | Regulon Activity |
| ∗The dot plots of a searched regulon are shown for all cell subpopulations in each disease state of each tissue based on the regulon specific score inferred using pySCENIC and by calculating the average expression. |
| Page: 1 |
Top |
Somatic mutation of malignant transformation related genes |
| Annotation of somatic variants for genes involved in malignant transformation |
| Hugo Symbol | Variant Class | Variant Classification | dbSNP RS | HGVSc | HGVSp | HGVSp Short | SWISSPROT | BIOTYPE | SIFT | PolyPhen | Tumor Sample Barcode | Tissue | Histology | Sex | Age | Stage | Therapy Types | Drugs | Outcome |
| ALG14 | SNV | Missense_Mutation | c.410N>C | p.Lys137Thr | p.K137T | Q96F25 | protein_coding | tolerated(0.07) | possibly_damaging(0.589) | TCGA-EW-A1IZ-01 | Breast | breast invasive carcinoma | Female | <65 | III/IV | Chemotherapy | taxotere | SD | |
| ALG14 | SNV | Missense_Mutation | novel | c.263N>T | p.Arg88Leu | p.R88L | Q96F25 | protein_coding | tolerated(0.1) | benign(0.289) | TCGA-S3-AA11-01 | Breast | breast invasive carcinoma | Female | >=65 | I/II | Hormone Therapy | letrozole | CR |
| ALG14 | SNV | Missense_Mutation | novel | c.577N>A | p.Asp193Asn | p.D193N | Q96F25 | protein_coding | deleterious(0.04) | probably_damaging(0.967) | TCGA-MA-AA41-01 | Cervix | cervical & endocervical cancer | Female | <65 | I/II | Unknown | Unknown | SD |
| ALG14 | SNV | Missense_Mutation | c.87N>A | p.Met29Ile | p.M29I | Q96F25 | protein_coding | tolerated(0.4) | benign(0) | TCGA-A6-6138-01 | Colorectum | colon adenocarcinoma | Male | <65 | I/II | Unknown | Unknown | SD | |
| ALG14 | SNV | Missense_Mutation | rs767036165 | c.641G>A | p.Arg214Gln | p.R214Q | Q96F25 | protein_coding | tolerated(0.06) | possibly_damaging(0.687) | TCGA-AZ-4315-01 | Colorectum | colon adenocarcinoma | Male | <65 | I/II | Unknown | Unknown | SD |
| ALG14 | SNV | Missense_Mutation | rs767402341 | c.248N>A | p.Ser83Tyr | p.S83Y | Q96F25 | protein_coding | tolerated(0.07) | benign(0.091) | TCGA-CA-6718-01 | Colorectum | colon adenocarcinoma | Male | <65 | I/II | Unknown | Unknown | PD |
| ALG14 | SNV | Missense_Mutation | rs767402341 | c.248C>A | p.Ser83Tyr | p.S83Y | Q96F25 | protein_coding | tolerated(0.07) | benign(0.091) | TCGA-AG-3892-01 | Colorectum | rectum adenocarcinoma | Female | <65 | I/II | Unknown | Unknown | SD |
| ALG14 | SNV | Missense_Mutation | c.166C>T | p.Leu56Phe | p.L56F | Q96F25 | protein_coding | tolerated(0.06) | possibly_damaging(0.877) | TCGA-F5-6814-01 | Colorectum | rectum adenocarcinoma | Male | <65 | I/II | Unknown | Unknown | SD | |
| ALG14 | SNV | Missense_Mutation | novel | c.562N>A | p.Leu188Met | p.L188M | Q96F25 | protein_coding | deleterious(0.03) | probably_damaging(0.934) | TCGA-AJ-A5DW-01 | Endometrium | uterine corpus endometrioid carcinoma | Female | <65 | I/II | Unknown | Unknown | SD |
| ALG14 | SNV | Missense_Mutation | c.506T>C | p.Ile169Thr | p.I169T | Q96F25 | protein_coding | deleterious(0) | possibly_damaging(0.522) | TCGA-AP-A0LD-01 | Endometrium | uterine corpus endometrioid carcinoma | Female | <65 | I/II | Unknown | Unknown | SD |
| Page: 1 2 |
Top |
Related drugs of malignant transformation related genes |
| Identification of chemicals and drugs interact with genes involved in malignant transfromation |
| (DGIdb 4.0) |
| Entrez ID | Symbol | Category | Interaction Types | Drug Claim Name | Drug Name | PMIDs |
| Page: 1 |

Copyright 2023-Present -The University of Texas Health Science Center at Houston |