
|
|||||
|
 | |
| |
| |
| |
| |
| |
|
Gene: ALG13 |
Gene summary for ALG13 |
| Gene information | Species | Human | Gene symbol | ALG13 | Gene ID | 79868 |
| Gene name | ALG13 UDP-N-acetylglucosaminyltransferase subunit | |
| Gene Alias | CDG1S | |
| Cytomap | Xq23 | |
| Gene Type | protein-coding | GO ID | GO:0006508 | UniProtAcc | Q9NP73 |
Top |
Malignant transformation analysis |
| Identification of the aberrant gene expression in precancerous and cancerous lesions by comparing the gene expression of stem-like cells in diseased tissues with normal stem cells |
| Entrez ID | Symbol | Replicates | Species | Organ | Tissue | Adj P-value | Log2FC | Malignancy |
| 79868 | ALG13 | LZE2T | Human | Esophagus | ESCC | 4.53e-02 | 2.94e-01 | 0.082 |
| 79868 | ALG13 | LZE4T | Human | Esophagus | ESCC | 3.98e-09 | 1.73e-01 | 0.0811 |
| 79868 | ALG13 | LZE7T | Human | Esophagus | ESCC | 9.72e-06 | 4.47e-01 | 0.0667 |
| 79868 | ALG13 | LZE8T | Human | Esophagus | ESCC | 3.44e-02 | 9.32e-02 | 0.067 |
| 79868 | ALG13 | LZE20T | Human | Esophagus | ESCC | 7.63e-05 | 1.60e-01 | 0.0662 |
| 79868 | ALG13 | LZE22D1 | Human | Esophagus | HGIN | 2.40e-03 | 2.21e-01 | 0.0595 |
| 79868 | ALG13 | LZE24T | Human | Esophagus | ESCC | 1.01e-22 | 6.25e-01 | 0.0596 |
| 79868 | ALG13 | LZE21T | Human | Esophagus | ESCC | 5.88e-05 | 3.17e-01 | 0.0655 |
| 79868 | ALG13 | LZE6T | Human | Esophagus | ESCC | 8.82e-08 | 6.64e-01 | 0.0845 |
| 79868 | ALG13 | P1T-E | Human | Esophagus | ESCC | 5.85e-09 | 6.17e-01 | 0.0875 |
| 79868 | ALG13 | P2T-E | Human | Esophagus | ESCC | 1.23e-26 | 6.40e-01 | 0.1177 |
| 79868 | ALG13 | P4T-E | Human | Esophagus | ESCC | 8.48e-42 | 9.57e-01 | 0.1323 |
| 79868 | ALG13 | P5T-E | Human | Esophagus | ESCC | 2.82e-13 | 2.26e-01 | 0.1327 |
| 79868 | ALG13 | P8T-E | Human | Esophagus | ESCC | 6.58e-35 | 6.91e-01 | 0.0889 |
| 79868 | ALG13 | P9T-E | Human | Esophagus | ESCC | 2.92e-20 | 6.06e-01 | 0.1131 |
| 79868 | ALG13 | P10T-E | Human | Esophagus | ESCC | 2.30e-23 | 5.94e-01 | 0.116 |
| 79868 | ALG13 | P11T-E | Human | Esophagus | ESCC | 4.43e-10 | 5.34e-01 | 0.1426 |
| 79868 | ALG13 | P12T-E | Human | Esophagus | ESCC | 1.54e-21 | 4.40e-01 | 0.1122 |
| 79868 | ALG13 | P15T-E | Human | Esophagus | ESCC | 5.93e-20 | 4.24e-01 | 0.1149 |
| 79868 | ALG13 | P16T-E | Human | Esophagus | ESCC | 7.26e-19 | 1.92e-01 | 0.1153 |
| Page: 1 2 3 4 5 6 |
| Tissue | Expression Dynamics | Abbreviation |
| Esophagus | 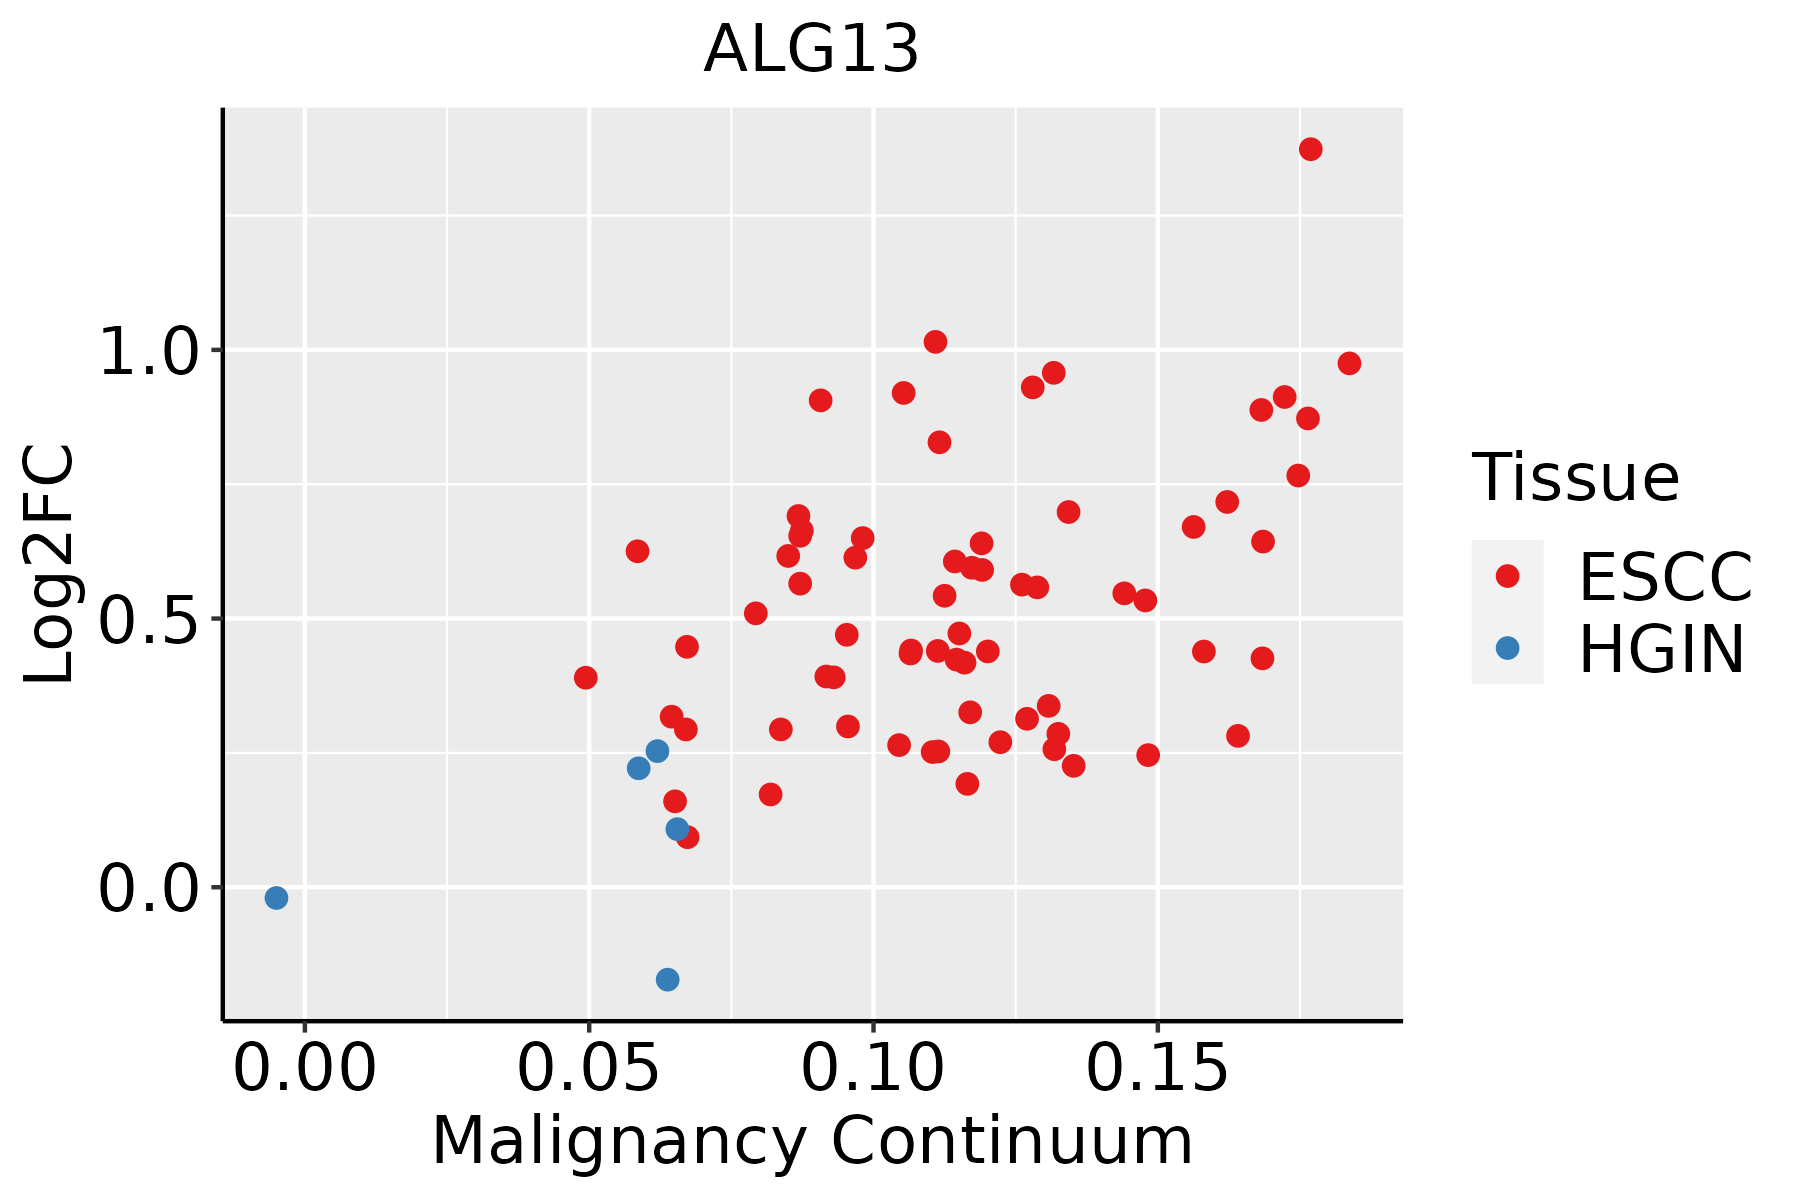 | ESCC: Esophageal squamous cell carcinoma |
| HGIN: High-grade intraepithelial neoplasias | ||
| LGIN: Low-grade intraepithelial neoplasias | ||
| Liver | 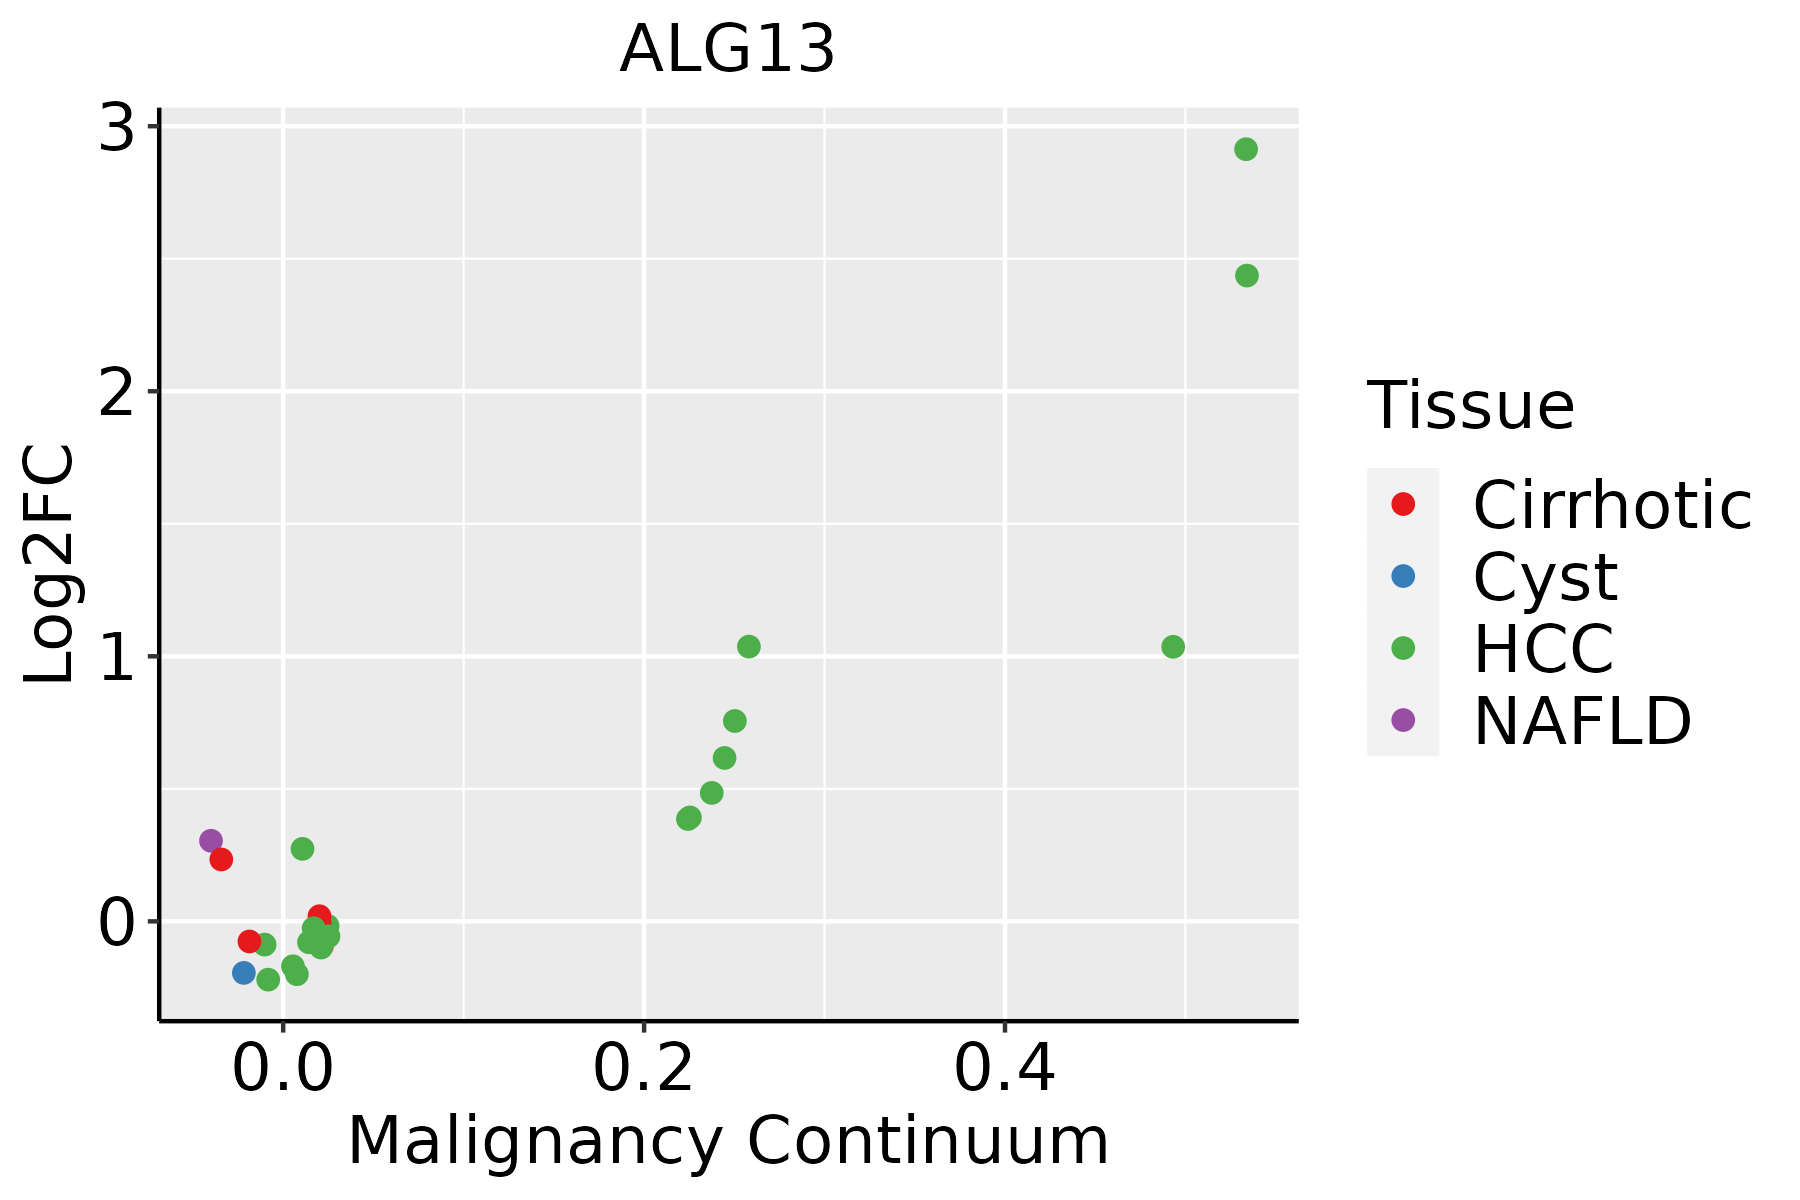 | HCC: Hepatocellular carcinoma |
| NAFLD: Non-alcoholic fatty liver disease | ||
| Oral Cavity | 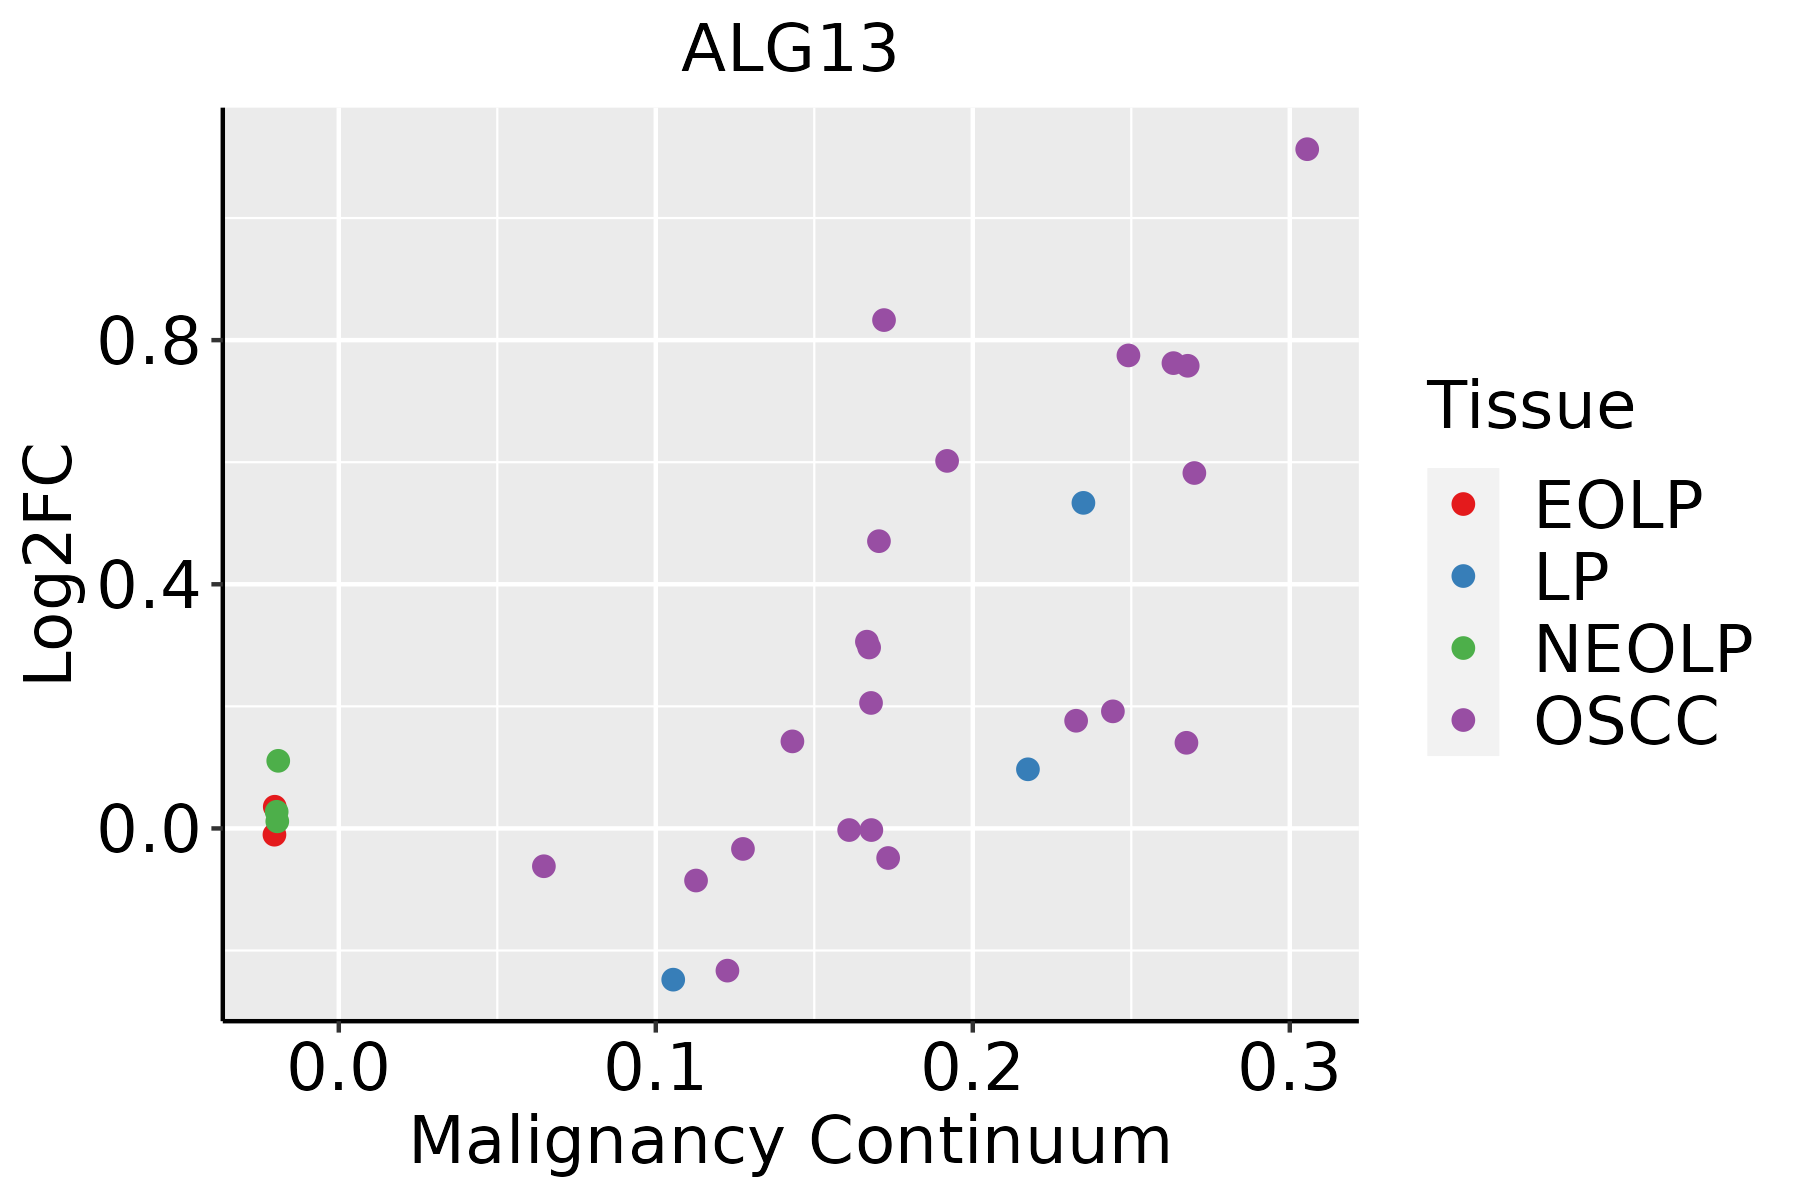 | EOLP: Erosive Oral lichen planus |
| LP: leukoplakia | ||
| NEOLP: Non-erosive oral lichen planus | ||
| OSCC: Oral squamous cell carcinoma | ||
| Skin |  | AK: Actinic keratosis |
| cSCC: Cutaneous squamous cell carcinoma | ||
| SCCIS:squamous cell carcinoma in situ | ||
| Thyroid |  | ATC: Anaplastic thyroid cancer |
| HT: Hashimoto's thyroiditis | ||
| PTC: Papillary thyroid cancer |
| ∗log2FC in expression of this searched gene in stem-like cells from each diseased tissue sample relative to stem-like cells in normal samples in each tissue plotted against the malignancy continuum. Samples are colored based on if they are from different disease stage. |
Top |
Malignant transformation related pathway analysis |
| Find out the enriched GO biological processes and KEGG pathways involved in transition from healthy to precancer to cancer |
| Tissue | Disease Stage | Enriched GO biological Processes |
| Colorectum | AD |  |
| Colorectum | SER |  |
| Colorectum | MSS |  |
| Colorectum | MSI-H |  |
| Colorectum | FAP |  |
| ∗Top 15 enriched GO BP terms are showed in the bar plot of each disease state in each tissue. Each row represents a significant GO biological process which is colored according to the -log10(p.adjust). |
| Page: 1 2 3 4 5 6 7 8 9 |
| GO ID | Tissue | Disease Stage | Description | Gene Ratio | Bg Ratio | pvalue | p.adjust | Count |
| Page: 1 |
| Pathway ID | Tissue | Disease Stage | Description | Gene Ratio | Bg Ratio | pvalue | p.adjust | qvalue | Count |
| hsa005106 | Esophagus | HGIN | N-Glycan biosynthesis | 17/1383 | 53/8465 | 3.43e-03 | 2.54e-02 | 2.02e-02 | 17 |
| hsa0051013 | Esophagus | HGIN | N-Glycan biosynthesis | 17/1383 | 53/8465 | 3.43e-03 | 2.54e-02 | 2.02e-02 | 17 |
| hsa0051023 | Esophagus | ESCC | N-Glycan biosynthesis | 39/4205 | 53/8465 | 3.26e-04 | 1.15e-03 | 5.89e-04 | 39 |
| hsa005136 | Esophagus | ESCC | Various types of N-glycan biosynthesis | 31/4205 | 42/8465 | 1.23e-03 | 3.78e-03 | 1.93e-03 | 31 |
| hsa0051033 | Esophagus | ESCC | N-Glycan biosynthesis | 39/4205 | 53/8465 | 3.26e-04 | 1.15e-03 | 5.89e-04 | 39 |
| hsa0051313 | Esophagus | ESCC | Various types of N-glycan biosynthesis | 31/4205 | 42/8465 | 1.23e-03 | 3.78e-03 | 1.93e-03 | 31 |
| hsa005104 | Liver | Cirrhotic | N-Glycan biosynthesis | 32/2530 | 53/8465 | 3.82e-06 | 4.10e-05 | 2.53e-05 | 32 |
| hsa005134 | Liver | Cirrhotic | Various types of N-glycan biosynthesis | 26/2530 | 42/8465 | 1.65e-05 | 1.41e-04 | 8.69e-05 | 26 |
| hsa0051011 | Liver | Cirrhotic | N-Glycan biosynthesis | 32/2530 | 53/8465 | 3.82e-06 | 4.10e-05 | 2.53e-05 | 32 |
| hsa0051311 | Liver | Cirrhotic | Various types of N-glycan biosynthesis | 26/2530 | 42/8465 | 1.65e-05 | 1.41e-04 | 8.69e-05 | 26 |
| hsa0051021 | Liver | HCC | N-Glycan biosynthesis | 40/4020 | 53/8465 | 2.95e-05 | 1.87e-04 | 1.04e-04 | 40 |
| hsa005132 | Liver | HCC | Various types of N-glycan biosynthesis | 30/4020 | 42/8465 | 1.41e-03 | 5.07e-03 | 2.82e-03 | 30 |
| hsa0051031 | Liver | HCC | N-Glycan biosynthesis | 40/4020 | 53/8465 | 2.95e-05 | 1.87e-04 | 1.04e-04 | 40 |
| hsa005133 | Liver | HCC | Various types of N-glycan biosynthesis | 30/4020 | 42/8465 | 1.41e-03 | 5.07e-03 | 2.82e-03 | 30 |
| hsa005105 | Oral cavity | OSCC | N-Glycan biosynthesis | 39/3704 | 53/8465 | 9.77e-06 | 4.36e-05 | 2.22e-05 | 39 |
| hsa005135 | Oral cavity | OSCC | Various types of N-glycan biosynthesis | 29/3704 | 42/8465 | 8.03e-04 | 2.32e-03 | 1.18e-03 | 29 |
| hsa0051012 | Oral cavity | OSCC | N-Glycan biosynthesis | 39/3704 | 53/8465 | 9.77e-06 | 4.36e-05 | 2.22e-05 | 39 |
| hsa0051312 | Oral cavity | OSCC | Various types of N-glycan biosynthesis | 29/3704 | 42/8465 | 8.03e-04 | 2.32e-03 | 1.18e-03 | 29 |
| Page: 1 |
Top |
Cell-cell communication analysis |
| Identification of potential cell-cell interactions between two cell types and their ligand-receptor pairs for different disease states |
| Ligand | Receptor | LRpair | Pathway | Tissue | Disease Stage |
| Page: 1 |
Top |
Single-cell gene regulatory network inference analysis |
| Find out the significant the regulons (TFs) and the target genes of each regulon across cell types for different disease states |
| TF | Cell Type | Tissue | Disease Stage | Target Gene | RSS | Regulon Activity |
| ∗The dot plots of a searched regulon are shown for all cell subpopulations in each disease state of each tissue based on the regulon specific score inferred using pySCENIC and by calculating the average expression. |
| Page: 1 |
Top |
Somatic mutation of malignant transformation related genes |
| Annotation of somatic variants for genes involved in malignant transformation |
| Hugo Symbol | Variant Class | Variant Classification | dbSNP RS | HGVSc | HGVSp | HGVSp Short | SWISSPROT | BIOTYPE | SIFT | PolyPhen | Tumor Sample Barcode | Tissue | Histology | Sex | Age | Stage | Therapy Types | Drugs | Outcome |
| ALG13 | SNV | Missense_Mutation | rs771549283 | c.1918N>A | p.Glu640Lys | p.E640K | Q9NP73 | protein_coding | tolerated(0.11) | benign(0.049) | TCGA-A1-A0SP-01 | Breast | breast invasive carcinoma | Female | <65 | I/II | Chemotherapy | SD | |
| ALG13 | SNV | Missense_Mutation | c.2090G>T | p.Arg697Leu | p.R697L | Q9NP73 | protein_coding | deleterious(0.02) | benign(0.114) | TCGA-A7-A26H-01 | Breast | breast invasive carcinoma | Female | >=65 | I/II | Hormone Therapy | anastrozole | PD | |
| ALG13 | SNV | Missense_Mutation | novel | c.3271G>T | p.Asp1091Tyr | p.D1091Y | Q9NP73 | protein_coding | tolerated(0.06) | possibly_damaging(0.781) | TCGA-AN-A046-01 | Breast | breast invasive carcinoma | Female | >=65 | I/II | Unknown | Unknown | SD |
| ALG13 | SNV | Missense_Mutation | novel | c.602T>C | p.Leu201Pro | p.L201P | Q9NP73 | protein_coding | tolerated_low_confidence(0.34) | benign(0) | TCGA-AR-A24X-01 | Breast | breast invasive carcinoma | Female | <65 | I/II | Hormone Therapy | tamoxiphen | SD |
| ALG13 | SNV | Missense_Mutation | c.3328N>G | p.Gln1110Glu | p.Q1110E | Q9NP73 | protein_coding | deleterious(0.04) | benign(0.026) | TCGA-D8-A147-01 | Breast | breast invasive carcinoma | Female | <65 | I/II | Chemotherapy | doxorubicine | SD | |
| ALG13 | SNV | Missense_Mutation | rs374660036 | c.1781G>A | p.Arg594Gln | p.R594Q | Q9NP73 | protein_coding | deleterious(0) | probably_damaging(0.949) | TCGA-E2-A10C-01 | Breast | breast invasive carcinoma | Female | <65 | I/II | Chemotherapy | cytoxan | SD |
| ALG13 | insertion | Frame_Shift_Ins | novel | c.2417_2418insGGAGGGCAATGGCCAGAGTGAAAATGGTGAGTCAA | p.Ser807GlufsTer50 | p.S807Efs*50 | Q9NP73 | protein_coding | TCGA-AN-A03X-01 | Breast | breast invasive carcinoma | Female | >=65 | I/II | Unknown | Unknown | SD | ||
| ALG13 | SNV | Missense_Mutation | novel | c.520N>A | p.Leu174Ile | p.L174I | Q9NP73 | protein_coding | tolerated_low_confidence(0.13) | benign(0.001) | TCGA-2W-A8YY-01 | Cervix | cervical & endocervical cancer | Female | <65 | I/II | Chemotherapy | cisplatin | CR |
| ALG13 | SNV | Missense_Mutation | rs138712375 | c.2606C>T | p.Ala869Val | p.A869V | Q9NP73 | protein_coding | tolerated(0.12) | benign(0.022) | TCGA-C5-A1MJ-01 | Cervix | cervical & endocervical cancer | Female | <65 | I/II | Unknown | Unknown | SD |
| ALG13 | SNV | Missense_Mutation | novel | c.2836N>T | p.Ala946Ser | p.A946S | Q9NP73 | protein_coding | tolerated(0.84) | benign(0) | TCGA-C5-A2LT-01 | Cervix | cervical & endocervical cancer | Female | <65 | I/II | Chemotherapy | cisplatin | SD |
| Page: 1 2 3 4 5 6 7 8 9 10 11 12 13 14 15 |
Top |
Related drugs of malignant transformation related genes |
| Identification of chemicals and drugs interact with genes involved in malignant transfromation |
| (DGIdb 4.0) |
| Entrez ID | Symbol | Category | Interaction Types | Drug Claim Name | Drug Name | PMIDs |
| Page: 1 |

Copyright 2023-Present -The University of Texas Health Science Center at Houston |