
|
|||||
|
 | |
| |
| |
| |
| |
| |
|
Gene: ALDOC |
Gene summary for ALDOC |
| Gene information | Species | Human | Gene symbol | ALDOC | Gene ID | 230 |
| Gene name | aldolase, fructose-bisphosphate C | |
| Gene Alias | ALDC | |
| Cytomap | 17q11.2 | |
| Gene Type | protein-coding | GO ID | GO:0005975 | UniProtAcc | A0A024QZ64 |
Top |
Malignant transformation analysis |
| Identification of the aberrant gene expression in precancerous and cancerous lesions by comparing the gene expression of stem-like cells in diseased tissues with normal stem cells |
| Entrez ID | Symbol | Replicates | Species | Organ | Tissue | Adj P-value | Log2FC | Malignancy |
| 230 | ALDOC | LZE4T | Human | Esophagus | ESCC | 5.16e-06 | 2.62e-01 | 0.0811 |
| 230 | ALDOC | LZE8T | Human | Esophagus | ESCC | 9.50e-03 | 1.19e-01 | 0.067 |
| 230 | ALDOC | LZE24T | Human | Esophagus | ESCC | 1.45e-02 | 1.12e-01 | 0.0596 |
| 230 | ALDOC | LZE6T | Human | Esophagus | ESCC | 4.63e-02 | 2.44e-01 | 0.0845 |
| 230 | ALDOC | P4T-E | Human | Esophagus | ESCC | 8.51e-28 | 7.31e-01 | 0.1323 |
| 230 | ALDOC | P5T-E | Human | Esophagus | ESCC | 4.78e-16 | 3.63e-01 | 0.1327 |
| 230 | ALDOC | P10T-E | Human | Esophagus | ESCC | 1.96e-14 | 2.73e-01 | 0.116 |
| 230 | ALDOC | P11T-E | Human | Esophagus | ESCC | 2.63e-04 | 2.43e-01 | 0.1426 |
| 230 | ALDOC | P12T-E | Human | Esophagus | ESCC | 2.33e-02 | 1.32e-01 | 0.1122 |
| 230 | ALDOC | P15T-E | Human | Esophagus | ESCC | 6.18e-22 | 5.15e-01 | 0.1149 |
| 230 | ALDOC | P16T-E | Human | Esophagus | ESCC | 2.76e-12 | 2.53e-01 | 0.1153 |
| 230 | ALDOC | P17T-E | Human | Esophagus | ESCC | 1.03e-07 | 3.78e-01 | 0.1278 |
| 230 | ALDOC | P20T-E | Human | Esophagus | ESCC | 8.87e-06 | 1.47e-01 | 0.1124 |
| 230 | ALDOC | P21T-E | Human | Esophagus | ESCC | 2.85e-25 | 5.78e-01 | 0.1617 |
| 230 | ALDOC | P24T-E | Human | Esophagus | ESCC | 1.16e-03 | 1.29e-01 | 0.1287 |
| 230 | ALDOC | P26T-E | Human | Esophagus | ESCC | 9.54e-25 | 5.53e-01 | 0.1276 |
| 230 | ALDOC | P27T-E | Human | Esophagus | ESCC | 9.16e-13 | 2.71e-01 | 0.1055 |
| 230 | ALDOC | P28T-E | Human | Esophagus | ESCC | 7.40e-11 | 3.14e-01 | 0.1149 |
| 230 | ALDOC | P30T-E | Human | Esophagus | ESCC | 1.39e-02 | 1.52e-01 | 0.137 |
| 230 | ALDOC | P31T-E | Human | Esophagus | ESCC | 2.44e-09 | 1.71e-01 | 0.1251 |
| Page: 1 2 3 4 |
| Tissue | Expression Dynamics | Abbreviation |
| Esophagus | 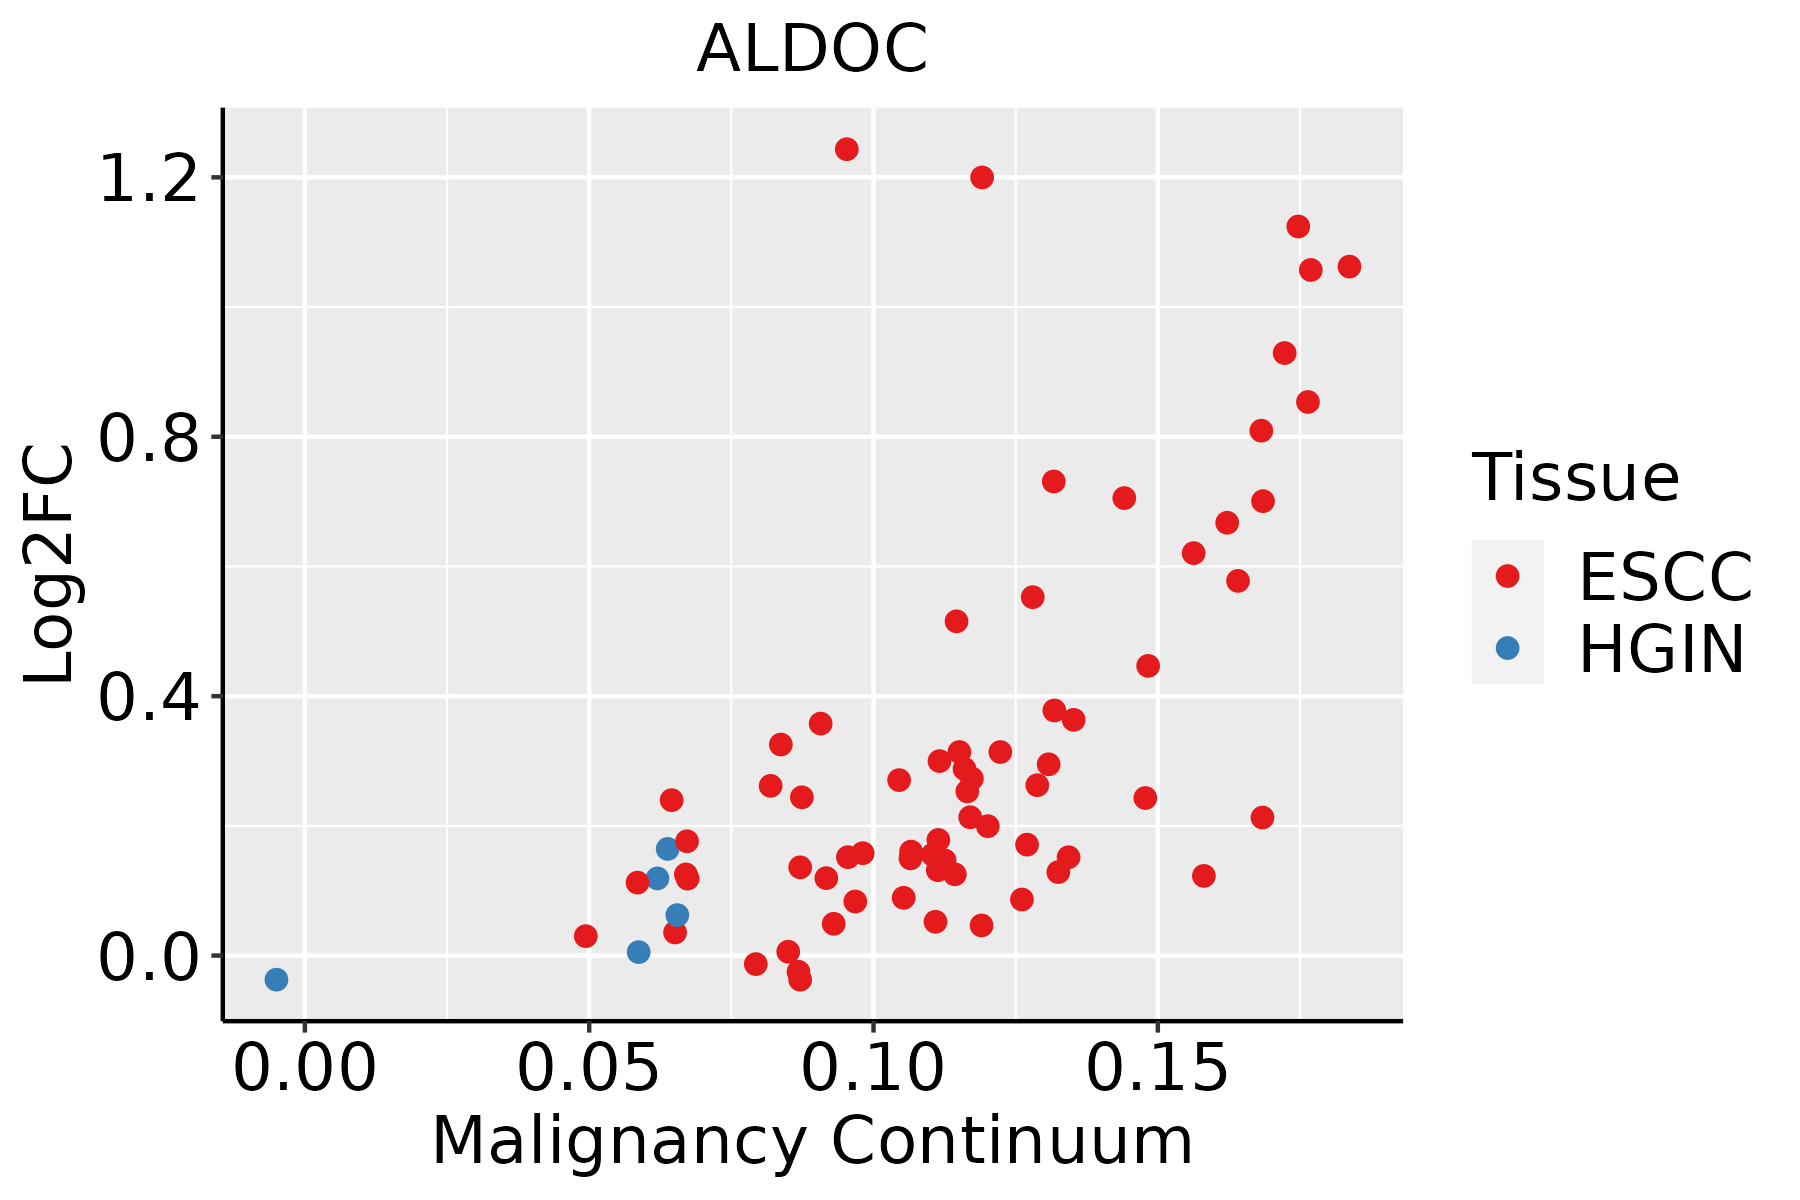 | ESCC: Esophageal squamous cell carcinoma |
| HGIN: High-grade intraepithelial neoplasias | ||
| LGIN: Low-grade intraepithelial neoplasias | ||
| Liver | 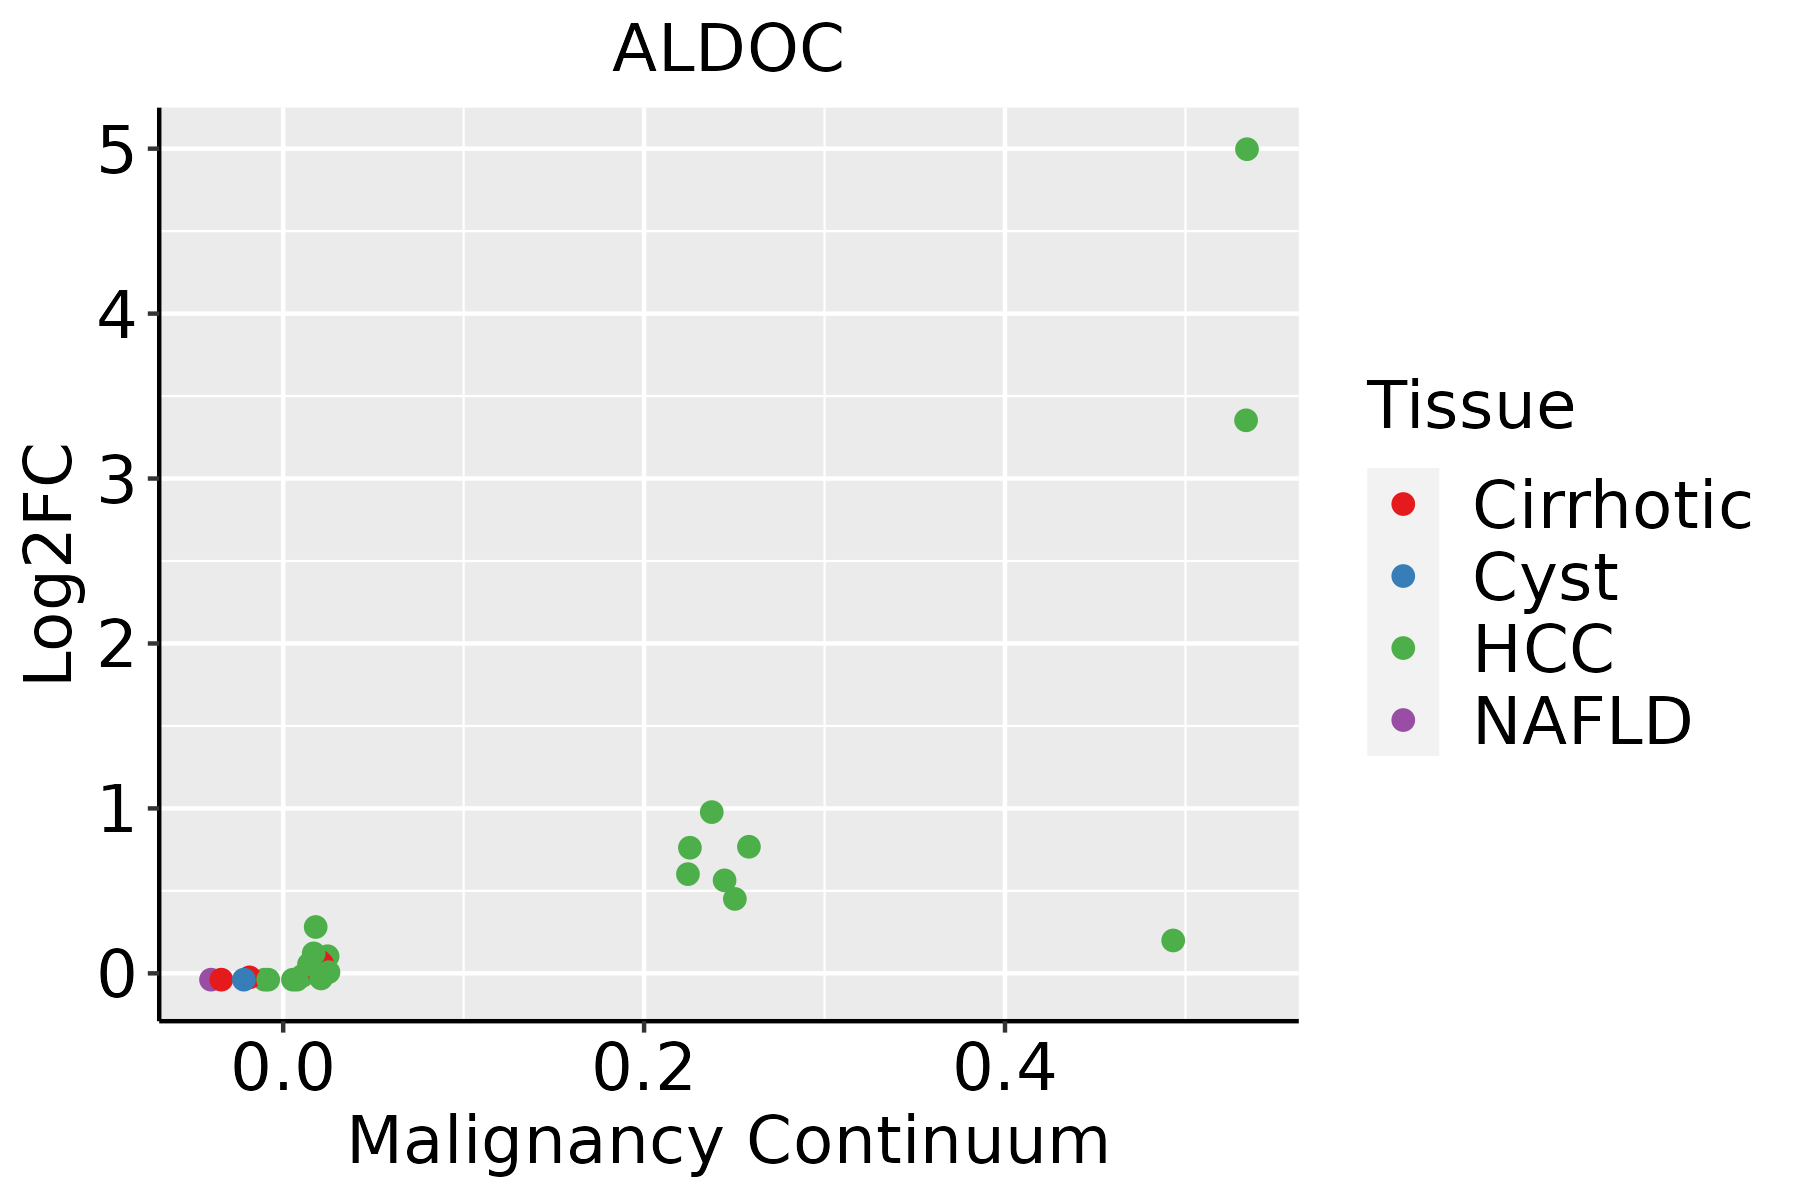 | HCC: Hepatocellular carcinoma |
| NAFLD: Non-alcoholic fatty liver disease | ||
| Oral Cavity | 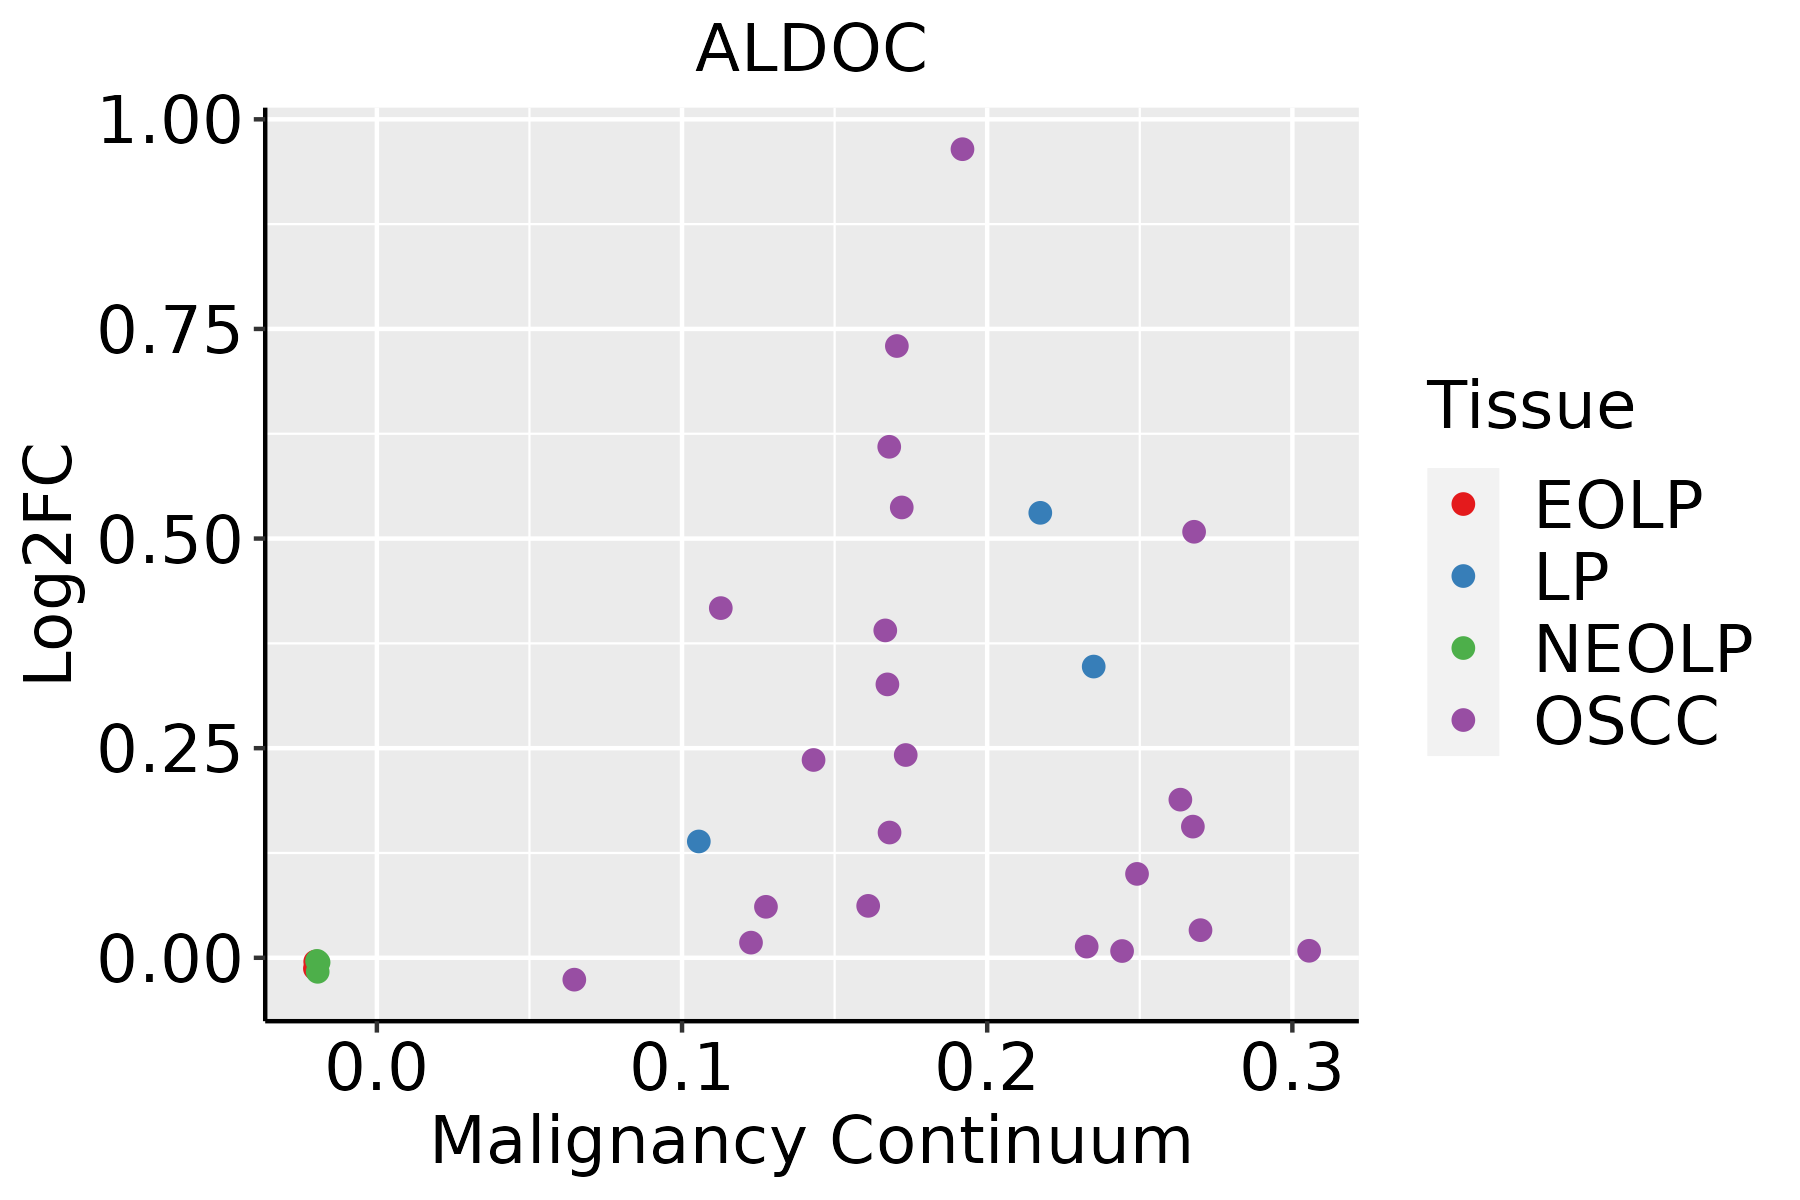 | EOLP: Erosive Oral lichen planus |
| LP: leukoplakia | ||
| NEOLP: Non-erosive oral lichen planus | ||
| OSCC: Oral squamous cell carcinoma |
| ∗log2FC in expression of this searched gene in stem-like cells from each diseased tissue sample relative to stem-like cells in normal samples in each tissue plotted against the malignancy continuum. Samples are colored based on if they are from different disease stage. |
Top |
Malignant transformation related pathway analysis |
| Find out the enriched GO biological processes and KEGG pathways involved in transition from healthy to precancer to cancer |
| Tissue | Disease Stage | Enriched GO biological Processes |
| Colorectum | AD |  |
| Colorectum | SER |  |
| Colorectum | MSS |  |
| Colorectum | MSI-H |  |
| Colorectum | FAP |  |
| ∗Top 15 enriched GO BP terms are showed in the bar plot of each disease state in each tissue. Each row represents a significant GO biological process which is colored according to the -log10(p.adjust). |
| Page: 1 2 3 4 5 6 7 8 9 |
| GO ID | Tissue | Disease Stage | Description | Gene Ratio | Bg Ratio | pvalue | p.adjust | Count |
| GO:0006091110 | Esophagus | ESCC | generation of precursor metabolites and energy | 331/8552 | 490/18723 | 3.86e-23 | 8.45e-21 | 331 |
| GO:0046034111 | Esophagus | ESCC | ATP metabolic process | 189/8552 | 277/18723 | 1.99e-14 | 1.04e-12 | 189 |
| GO:0006753110 | Esophagus | ESCC | nucleoside phosphate metabolic process | 288/8552 | 497/18723 | 1.80e-08 | 3.50e-07 | 288 |
| GO:0019693111 | Esophagus | ESCC | ribose phosphate metabolic process | 234/8552 | 396/18723 | 4.24e-08 | 7.76e-07 | 234 |
| GO:0009117111 | Esophagus | ESCC | nucleotide metabolic process | 282/8552 | 489/18723 | 4.70e-08 | 8.50e-07 | 282 |
| GO:00059969 | Esophagus | ESCC | monosaccharide metabolic process | 159/8552 | 257/18723 | 1.11e-07 | 1.81e-06 | 159 |
| GO:00193189 | Esophagus | ESCC | hexose metabolic process | 147/8552 | 237/18723 | 2.63e-07 | 3.94e-06 | 147 |
| GO:0009259111 | Esophagus | ESCC | ribonucleotide metabolic process | 224/8552 | 385/18723 | 4.41e-07 | 6.00e-06 | 224 |
| GO:0072521111 | Esophagus | ESCC | purine-containing compound metabolic process | 238/8552 | 416/18723 | 1.20e-06 | 1.49e-05 | 238 |
| GO:0009150111 | Esophagus | ESCC | purine ribonucleotide metabolic process | 213/8552 | 368/18723 | 1.40e-06 | 1.69e-05 | 213 |
| GO:0006163111 | Esophagus | ESCC | purine nucleotide metabolic process | 226/8552 | 396/18723 | 2.81e-06 | 3.21e-05 | 226 |
| GO:000913219 | Esophagus | ESCC | nucleoside diphosphate metabolic process | 77/8552 | 124/18723 | 1.65e-04 | 1.09e-03 | 77 |
| GO:000918520 | Esophagus | ESCC | ribonucleoside diphosphate metabolic process | 66/8552 | 106/18723 | 4.21e-04 | 2.39e-03 | 66 |
| GO:001605216 | Esophagus | ESCC | carbohydrate catabolic process | 91/8552 | 154/18723 | 5.39e-04 | 2.97e-03 | 91 |
| GO:000913520 | Esophagus | ESCC | purine nucleoside diphosphate metabolic process | 63/8552 | 103/18723 | 1.10e-03 | 5.52e-03 | 63 |
| GO:000917920 | Esophagus | ESCC | purine ribonucleoside diphosphate metabolic process | 63/8552 | 103/18723 | 1.10e-03 | 5.52e-03 | 63 |
| GO:004693919 | Esophagus | ESCC | nucleotide phosphorylation | 61/8552 | 101/18723 | 2.03e-03 | 9.08e-03 | 61 |
| GO:004603119 | Esophagus | ESCC | ADP metabolic process | 55/8552 | 90/18723 | 2.27e-03 | 9.99e-03 | 55 |
| GO:000609019 | Esophagus | ESCC | pyruvate metabolic process | 63/8552 | 106/18723 | 2.98e-03 | 1.24e-02 | 63 |
| GO:000616519 | Esophagus | ESCC | nucleoside diphosphate phosphorylation | 59/8552 | 99/18723 | 3.65e-03 | 1.49e-02 | 59 |
| Page: 1 2 3 4 5 |
| Pathway ID | Tissue | Disease Stage | Description | Gene Ratio | Bg Ratio | pvalue | p.adjust | qvalue | Count |
| hsa0120023 | Esophagus | ESCC | Carbon metabolism | 79/4205 | 115/8465 | 2.50e-05 | 1.21e-04 | 6.22e-05 | 79 |
| hsa0406629 | Esophagus | ESCC | HIF-1 signaling pathway | 75/4205 | 109/8465 | 3.66e-05 | 1.68e-04 | 8.60e-05 | 75 |
| hsa0123023 | Esophagus | ESCC | Biosynthesis of amino acids | 49/4205 | 75/8465 | 4.35e-03 | 1.12e-02 | 5.74e-03 | 49 |
| hsa000512 | Esophagus | ESCC | Fructose and mannose metabolism | 24/4205 | 34/8465 | 1.09e-02 | 2.51e-02 | 1.29e-02 | 24 |
| hsa0001016 | Esophagus | ESCC | Glycolysis / Gluconeogenesis | 42/4205 | 67/8465 | 2.15e-02 | 4.78e-02 | 2.45e-02 | 42 |
| hsa0120033 | Esophagus | ESCC | Carbon metabolism | 79/4205 | 115/8465 | 2.50e-05 | 1.21e-04 | 6.22e-05 | 79 |
| hsa04066113 | Esophagus | ESCC | HIF-1 signaling pathway | 75/4205 | 109/8465 | 3.66e-05 | 1.68e-04 | 8.60e-05 | 75 |
| hsa0123033 | Esophagus | ESCC | Biosynthesis of amino acids | 49/4205 | 75/8465 | 4.35e-03 | 1.12e-02 | 5.74e-03 | 49 |
| hsa0005111 | Esophagus | ESCC | Fructose and mannose metabolism | 24/4205 | 34/8465 | 1.09e-02 | 2.51e-02 | 1.29e-02 | 24 |
| hsa0001017 | Esophagus | ESCC | Glycolysis / Gluconeogenesis | 42/4205 | 67/8465 | 2.15e-02 | 4.78e-02 | 2.45e-02 | 42 |
| hsa0120041 | Liver | HCC | Carbon metabolism | 89/4020 | 115/8465 | 3.92e-11 | 6.56e-10 | 3.65e-10 | 89 |
| hsa0123021 | Liver | HCC | Biosynthesis of amino acids | 53/4020 | 75/8465 | 3.79e-05 | 2.11e-04 | 1.18e-04 | 53 |
| hsa0406622 | Liver | HCC | HIF-1 signaling pathway | 70/4020 | 109/8465 | 2.96e-04 | 1.36e-03 | 7.57e-04 | 70 |
| hsa0001022 | Liver | HCC | Glycolysis / Gluconeogenesis | 43/4020 | 67/8465 | 4.26e-03 | 1.29e-02 | 7.15e-03 | 43 |
| hsa000302 | Liver | HCC | Pentose phosphate pathway | 21/4020 | 30/8465 | 1.06e-02 | 2.71e-02 | 1.51e-02 | 21 |
| hsa0120051 | Liver | HCC | Carbon metabolism | 89/4020 | 115/8465 | 3.92e-11 | 6.56e-10 | 3.65e-10 | 89 |
| hsa0123031 | Liver | HCC | Biosynthesis of amino acids | 53/4020 | 75/8465 | 3.79e-05 | 2.11e-04 | 1.18e-04 | 53 |
| hsa0406632 | Liver | HCC | HIF-1 signaling pathway | 70/4020 | 109/8465 | 2.96e-04 | 1.36e-03 | 7.57e-04 | 70 |
| hsa0001032 | Liver | HCC | Glycolysis / Gluconeogenesis | 43/4020 | 67/8465 | 4.26e-03 | 1.29e-02 | 7.15e-03 | 43 |
| hsa000303 | Liver | HCC | Pentose phosphate pathway | 21/4020 | 30/8465 | 1.06e-02 | 2.71e-02 | 1.51e-02 | 21 |
| Page: 1 2 |
Top |
Cell-cell communication analysis |
| Identification of potential cell-cell interactions between two cell types and their ligand-receptor pairs for different disease states |
| Ligand | Receptor | LRpair | Pathway | Tissue | Disease Stage |
| Page: 1 |
Top |
Single-cell gene regulatory network inference analysis |
| Find out the significant the regulons (TFs) and the target genes of each regulon across cell types for different disease states |
| TF | Cell Type | Tissue | Disease Stage | Target Gene | RSS | Regulon Activity |
| ∗The dot plots of a searched regulon are shown for all cell subpopulations in each disease state of each tissue based on the regulon specific score inferred using pySCENIC and by calculating the average expression. |
| Page: 1 |
Top |
Somatic mutation of malignant transformation related genes |
| Annotation of somatic variants for genes involved in malignant transformation |
| Hugo Symbol | Variant Class | Variant Classification | dbSNP RS | HGVSc | HGVSp | HGVSp Short | SWISSPROT | BIOTYPE | SIFT | PolyPhen | Tumor Sample Barcode | Tissue | Histology | Sex | Age | Stage | Therapy Types | Drugs | Outcome |
| ALDOC | SNV | Missense_Mutation | c.65N>A | p.Arg22Gln | p.R22Q | P09972 | protein_coding | tolerated(0.33) | benign(0.03) | TCGA-AN-A0AK-01 | Breast | breast invasive carcinoma | Female | >=65 | I/II | Unknown | Unknown | SD | |
| ALDOC | SNV | Missense_Mutation | c.626T>C | p.Val209Ala | p.V209A | P09972 | protein_coding | deleterious(0.02) | probably_damaging(0.924) | TCGA-D8-A1JT-01 | Breast | breast invasive carcinoma | Female | >=65 | I/II | Hormone Therapy | arimidex | SD | |
| ALDOC | SNV | Missense_Mutation | novel | c.719N>A | p.Cys240Tyr | p.C240Y | P09972 | protein_coding | tolerated(0.06) | possibly_damaging(0.472) | TCGA-PL-A8LV-01 | Breast | breast invasive carcinoma | Female | <65 | III/IV | Unknown | Unknown | SD |
| ALDOC | SNV | Missense_Mutation | rs762828594 | c.992N>A | p.Arg331Gln | p.R331Q | P09972 | protein_coding | deleterious(0) | probably_damaging(0.923) | TCGA-2W-A8YY-01 | Cervix | cervical & endocervical cancer | Female | <65 | I/II | Chemotherapy | cisplatin | CR |
| ALDOC | SNV | Missense_Mutation | rs749373286 | c.589N>T | p.His197Tyr | p.H197Y | P09972 | protein_coding | deleterious(0) | probably_damaging(0.937) | TCGA-2W-A8YY-01 | Cervix | cervical & endocervical cancer | Female | <65 | I/II | Chemotherapy | cisplatin | CR |
| ALDOC | SNV | Missense_Mutation | c.7N>G | p.His3Asp | p.H3D | P09972 | protein_coding | deleterious(0.05) | benign(0.074) | TCGA-DG-A2KK-01 | Cervix | cervical & endocervical cancer | Female | <65 | III/IV | Chemotherapy | cisplatin | SD | |
| ALDOC | SNV | Missense_Mutation | rs747367976 | c.517C>T | p.Arg173Cys | p.R173C | P09972 | protein_coding | deleterious(0.01) | probably_damaging(0.985) | TCGA-AA-3831-01 | Colorectum | colon adenocarcinoma | Male | >=65 | I/II | Unknown | Unknown | SD |
| ALDOC | SNV | Missense_Mutation | rs775893117 | c.98C>T | p.Ala33Val | p.A33V | P09972 | protein_coding | deleterious(0.04) | probably_damaging(0.919) | TCGA-CK-4951-01 | Colorectum | colon adenocarcinoma | Female | >=65 | I/II | Unknown | Unknown | PD |
| ALDOC | SNV | Missense_Mutation | rs765845189 | c.776N>A | p.Arg259His | p.R259H | P09972 | protein_coding | deleterious(0.02) | benign(0.415) | TCGA-AG-A002-01 | Colorectum | rectum adenocarcinoma | Male | <65 | I/II | Unknown | Unknown | SD |
| ALDOC | SNV | Missense_Mutation | rs145665688 | c.773N>A | p.Arg258His | p.R258H | P09972 | protein_coding | tolerated(0.13) | benign(0.211) | TCGA-AG-A011-01 | Colorectum | rectum adenocarcinoma | Male | >=65 | I/II | Unknown | Unknown | SD |
| Page: 1 2 3 4 |
Top |
Related drugs of malignant transformation related genes |
| Identification of chemicals and drugs interact with genes involved in malignant transfromation |
| (DGIdb 4.0) |
| Entrez ID | Symbol | Category | Interaction Types | Drug Claim Name | Drug Name | PMIDs |
| Page: 1 |

Copyright 2023-Present -The University of Texas Health Science Center at Houston |