
|
|||||
|
 | |
| |
| |
| |
| |
| |
|
Gene: ALDOB |
Gene summary for ALDOB |
| Gene information | Species | Human | Gene symbol | ALDOB | Gene ID | 229 |
| Gene name | aldolase, fructose-bisphosphate B | |
| Gene Alias | ALDB | |
| Cytomap | 9q31.1 | |
| Gene Type | protein-coding | GO ID | GO:0005975 | UniProtAcc | A0A024R145 |
Top |
Malignant transformation analysis |
| Identification of the aberrant gene expression in precancerous and cancerous lesions by comparing the gene expression of stem-like cells in diseased tissues with normal stem cells |
| Entrez ID | Symbol | Replicates | Species | Organ | Tissue | Adj P-value | Log2FC | Malignancy |
| 229 | ALDOB | HTA11_2487_2000001011 | Human | Colorectum | SER | 2.66e-11 | 8.90e-01 | -0.1808 |
| 229 | ALDOB | HTA11_411_2000001011 | Human | Colorectum | SER | 6.98e-04 | 1.22e+00 | -0.2602 |
| 229 | ALDOB | HTA11_696_2000001011 | Human | Colorectum | AD | 1.53e-07 | 3.62e-01 | -0.1464 |
| 229 | ALDOB | HTA11_1391_2000001011 | Human | Colorectum | AD | 1.43e-06 | 5.69e-01 | -0.059 |
| 229 | ALDOB | NAFLD1 | Human | Liver | NAFLD | 5.25e-10 | 1.20e+00 | -0.04 |
| 229 | ALDOB | S41 | Human | Liver | Cirrhotic | 3.12e-16 | 1.23e+00 | -0.0343 |
| 229 | ALDOB | S42 | Human | Liver | HCC | 4.45e-12 | 1.28e+00 | -0.0103 |
| 229 | ALDOB | S43 | Human | Liver | Cirrhotic | 1.09e-17 | 6.78e-01 | -0.0187 |
| 229 | ALDOB | HCC1_Meng | Human | Liver | HCC | 6.50e-21 | -5.35e-01 | 0.0246 |
| 229 | ALDOB | HCC2_Meng | Human | Liver | HCC | 3.09e-15 | -5.28e-01 | 0.0107 |
| 229 | ALDOB | cirrhotic1 | Human | Liver | Cirrhotic | 6.18e-06 | -4.15e-01 | 0.0202 |
| 229 | ALDOB | cirrhotic2 | Human | Liver | Cirrhotic | 7.17e-05 | -3.61e-01 | 0.0201 |
| 229 | ALDOB | cirrhotic3 | Human | Liver | Cirrhotic | 1.71e-05 | -5.02e-01 | 0.0215 |
| 229 | ALDOB | HCC1 | Human | Liver | HCC | 1.43e-14 | 4.38e+00 | 0.5336 |
| 229 | ALDOB | HCC2 | Human | Liver | HCC | 1.41e-42 | 5.89e+00 | 0.5341 |
| 229 | ALDOB | Pt13.a | Human | Liver | HCC | 2.04e-25 | 4.01e-01 | 0.021 |
| 229 | ALDOB | Pt13.b | Human | Liver | HCC | 2.75e-43 | 3.74e-01 | 0.0251 |
| 229 | ALDOB | Pt14.b | Human | Liver | HCC | 7.12e-08 | 1.42e-01 | 0.018 |
| 229 | ALDOB | Pt14.d | Human | Liver | HCC | 1.62e-03 | -7.40e-02 | 0.0143 |
| 229 | ALDOB | S014 | Human | Liver | HCC | 2.43e-06 | -5.73e-01 | 0.2254 |
| Page: 1 2 |
| Tissue | Expression Dynamics | Abbreviation |
| Colorectum (GSE201348) | 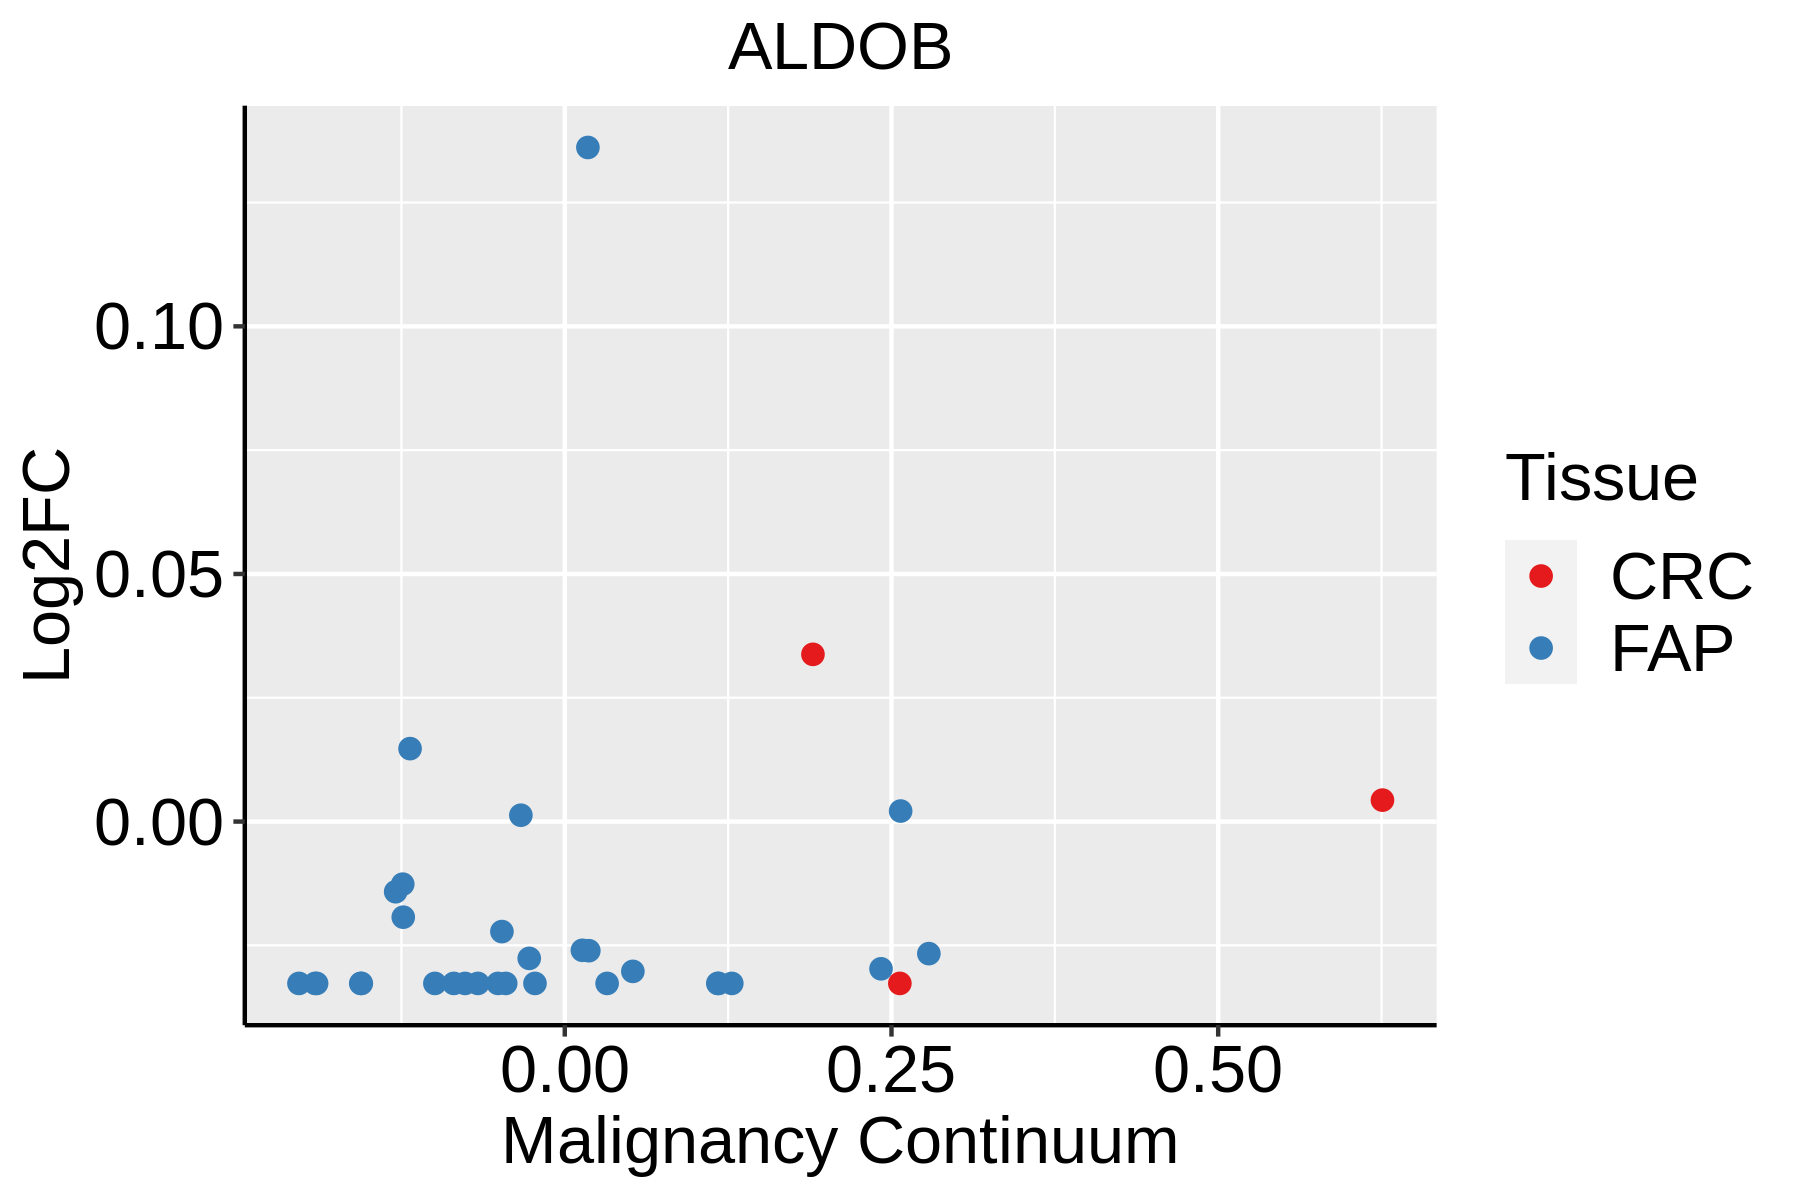 | FAP: Familial adenomatous polyposis |
| CRC: Colorectal cancer | ||
| Colorectum (HTA11) |  | AD: Adenomas |
| SER: Sessile serrated lesions | ||
| MSI-H: Microsatellite-high colorectal cancer | ||
| MSS: Microsatellite stable colorectal cancer | ||
| GC | 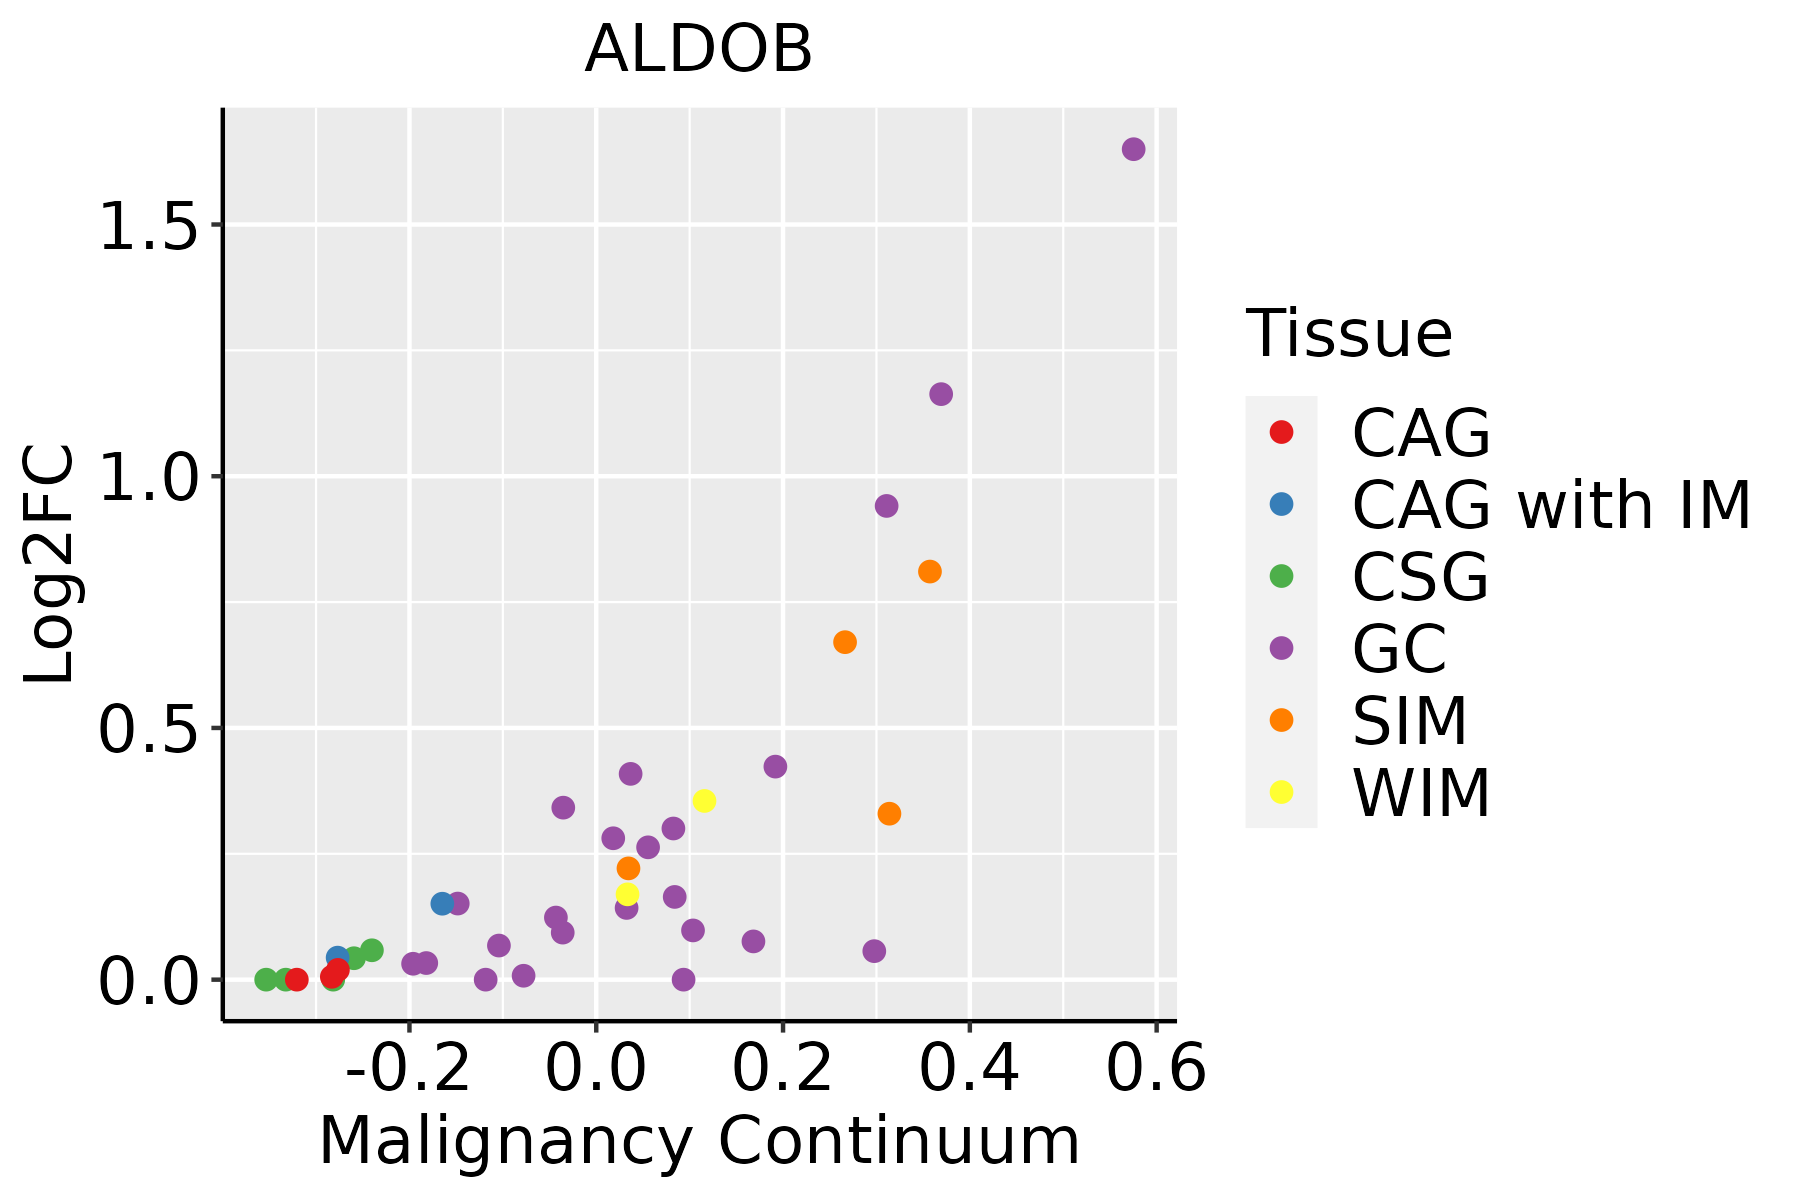 | CAG: Chronic atrophic gastritis |
| CAG with IM: Chronic atrophic gastritis with intestinal metaplasia | ||
| CSG: Chronic superficial gastritis | ||
| GC: Gastric cancer | ||
| SIM: Severe intestinal metaplasia | ||
| WIM: Wild intestinal metaplasia | ||
| Liver | 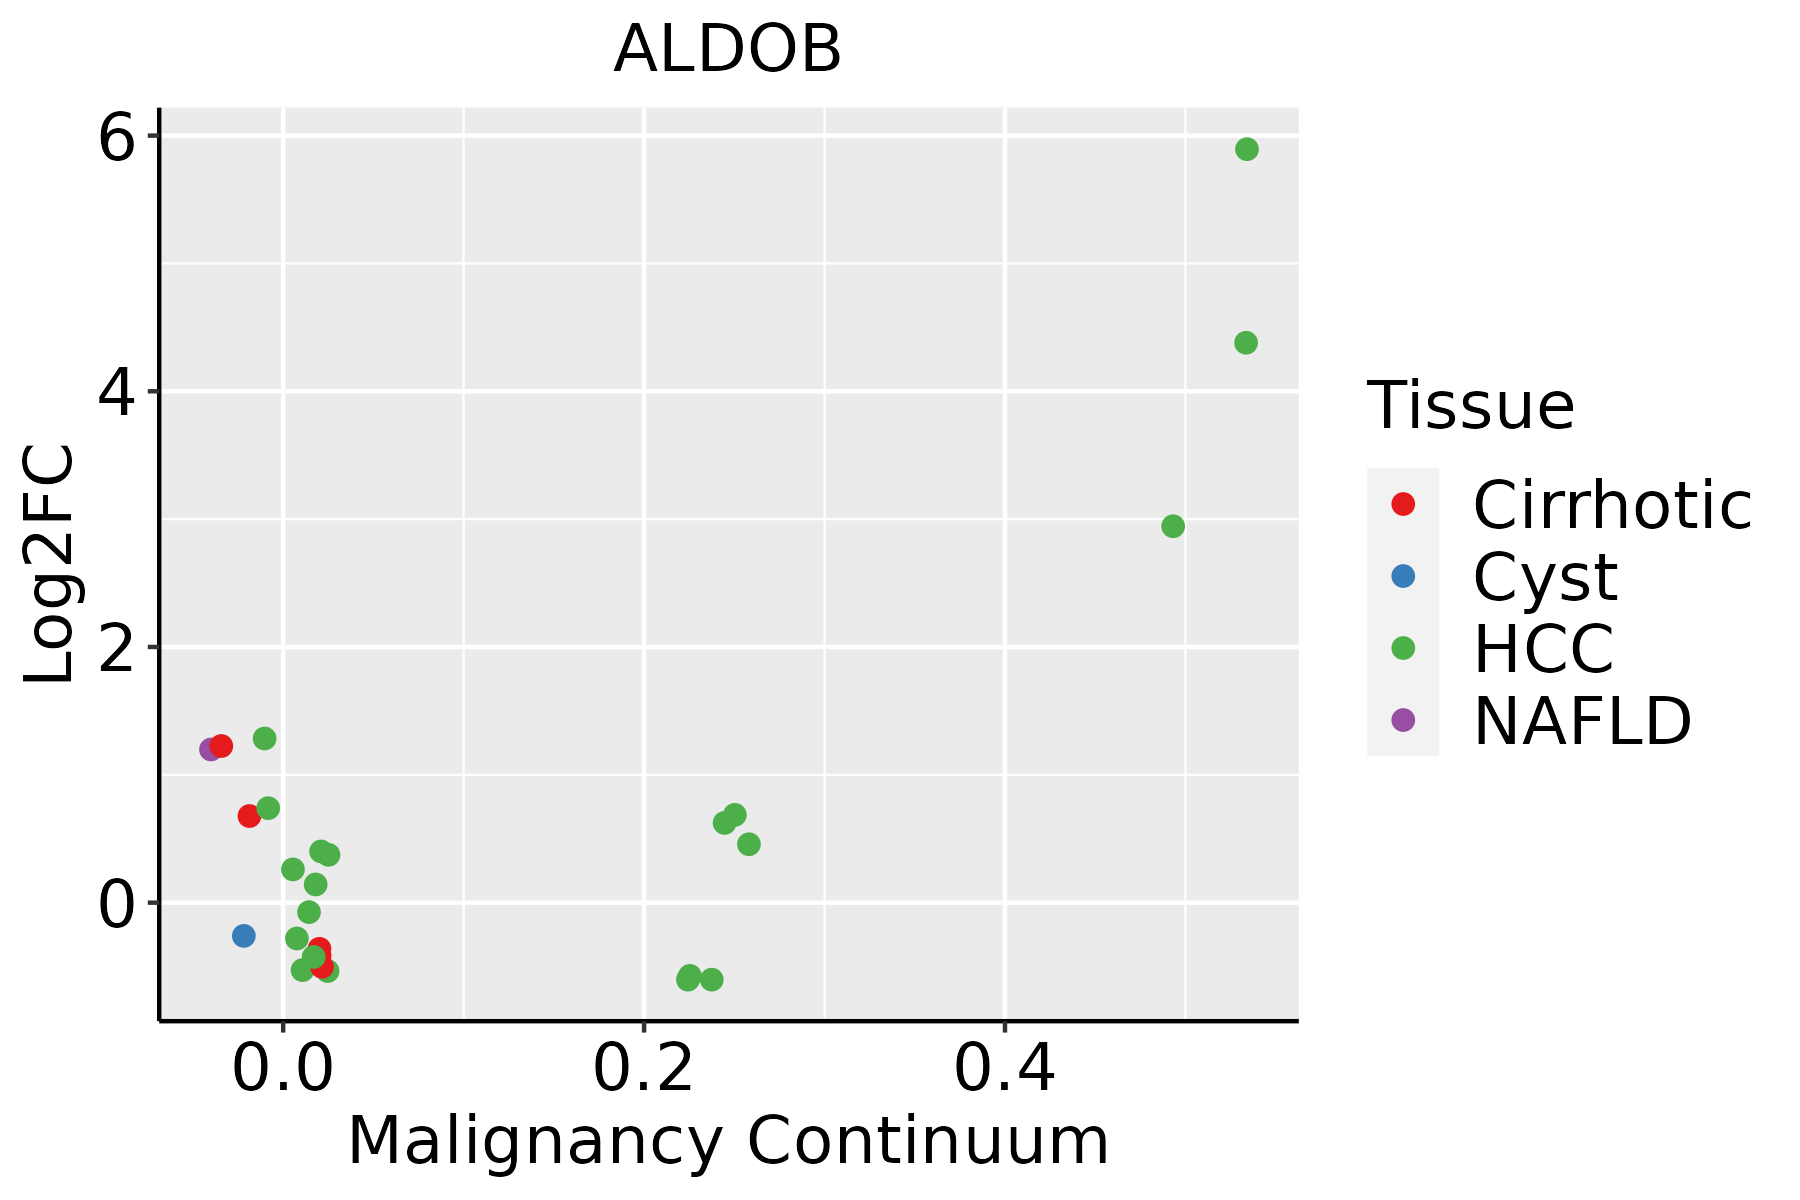 | HCC: Hepatocellular carcinoma |
| NAFLD: Non-alcoholic fatty liver disease |
| ∗log2FC in expression of this searched gene in stem-like cells from each diseased tissue sample relative to stem-like cells in normal samples in each tissue plotted against the malignancy continuum. Samples are colored based on if they are from different disease stage. |
Top |
Malignant transformation related pathway analysis |
| Find out the enriched GO biological processes and KEGG pathways involved in transition from healthy to precancer to cancer |
| Tissue | Disease Stage | Enriched GO biological Processes |
| Colorectum | AD |  |
| Colorectum | SER |  |
| Colorectum | MSS |  |
| Colorectum | MSI-H |  |
| Colorectum | FAP |  |
| ∗Top 15 enriched GO BP terms are showed in the bar plot of each disease state in each tissue. Each row represents a significant GO biological process which is colored according to the -log10(p.adjust). |
| Page: 1 2 3 4 5 6 7 8 9 |
| GO ID | Tissue | Disease Stage | Description | Gene Ratio | Bg Ratio | pvalue | p.adjust | Count |
| GO:0046034 | Colorectum | AD | ATP metabolic process | 142/3918 | 277/18723 | 2.64e-29 | 8.26e-26 | 142 |
| GO:0006091 | Colorectum | AD | generation of precursor metabolites and energy | 209/3918 | 490/18723 | 3.17e-28 | 6.61e-25 | 209 |
| GO:0009150 | Colorectum | AD | purine ribonucleotide metabolic process | 142/3918 | 368/18723 | 4.29e-15 | 1.17e-12 | 142 |
| GO:0006163 | Colorectum | AD | purine nucleotide metabolic process | 149/3918 | 396/18723 | 1.08e-14 | 2.80e-12 | 149 |
| GO:0072521 | Colorectum | AD | purine-containing compound metabolic process | 153/3918 | 416/18723 | 4.34e-14 | 1.01e-11 | 153 |
| GO:0009259 | Colorectum | AD | ribonucleotide metabolic process | 144/3918 | 385/18723 | 5.25e-14 | 1.13e-11 | 144 |
| GO:0019693 | Colorectum | AD | ribose phosphate metabolic process | 145/3918 | 396/18723 | 3.01e-13 | 5.71e-11 | 145 |
| GO:0009117 | Colorectum | AD | nucleotide metabolic process | 168/3918 | 489/18723 | 2.20e-12 | 3.36e-10 | 168 |
| GO:0006753 | Colorectum | AD | nucleoside phosphate metabolic process | 169/3918 | 497/18723 | 4.99e-12 | 6.98e-10 | 169 |
| GO:0009135 | Colorectum | AD | purine nucleoside diphosphate metabolic process | 47/3918 | 103/18723 | 1.61e-08 | 9.22e-07 | 47 |
| GO:0009179 | Colorectum | AD | purine ribonucleoside diphosphate metabolic process | 47/3918 | 103/18723 | 1.61e-08 | 9.22e-07 | 47 |
| GO:0006090 | Colorectum | AD | pyruvate metabolic process | 47/3918 | 106/18723 | 4.85e-08 | 2.55e-06 | 47 |
| GO:0009185 | Colorectum | AD | ribonucleoside diphosphate metabolic process | 47/3918 | 106/18723 | 4.85e-08 | 2.55e-06 | 47 |
| GO:0046031 | Colorectum | AD | ADP metabolic process | 41/3918 | 90/18723 | 1.37e-07 | 6.42e-06 | 41 |
| GO:0006096 | Colorectum | AD | glycolytic process | 38/3918 | 81/18723 | 1.52e-07 | 6.78e-06 | 38 |
| GO:0006757 | Colorectum | AD | ATP generation from ADP | 38/3918 | 82/18723 | 2.26e-07 | 9.37e-06 | 38 |
| GO:0009132 | Colorectum | AD | nucleoside diphosphate metabolic process | 49/3918 | 124/18723 | 1.75e-06 | 5.31e-05 | 49 |
| GO:0046939 | Colorectum | AD | nucleotide phosphorylation | 42/3918 | 101/18723 | 1.99e-06 | 5.92e-05 | 42 |
| GO:0016052 | Colorectum | AD | carbohydrate catabolic process | 56/3918 | 154/18723 | 7.01e-06 | 1.73e-04 | 56 |
| GO:0006165 | Colorectum | AD | nucleoside diphosphate phosphorylation | 40/3918 | 99/18723 | 8.02e-06 | 1.93e-04 | 40 |
| Page: 1 2 3 4 5 6 7 8 9 10 |
| Pathway ID | Tissue | Disease Stage | Description | Gene Ratio | Bg Ratio | pvalue | p.adjust | qvalue | Count |
| hsa04066 | Colorectum | AD | HIF-1 signaling pathway | 48/2092 | 109/8465 | 7.25e-06 | 7.84e-05 | 5.00e-05 | 48 |
| hsa040661 | Colorectum | AD | HIF-1 signaling pathway | 48/2092 | 109/8465 | 7.25e-06 | 7.84e-05 | 5.00e-05 | 48 |
| hsa012002 | Colorectum | SER | Carbon metabolism | 40/1580 | 115/8465 | 2.77e-05 | 3.41e-04 | 2.47e-04 | 40 |
| hsa040662 | Colorectum | SER | HIF-1 signaling pathway | 36/1580 | 109/8465 | 2.27e-04 | 2.15e-03 | 1.56e-03 | 36 |
| hsa000102 | Colorectum | SER | Glycolysis / Gluconeogenesis | 24/1580 | 67/8465 | 6.62e-04 | 5.36e-03 | 3.89e-03 | 24 |
| hsa012302 | Colorectum | SER | Biosynthesis of amino acids | 23/1580 | 75/8465 | 8.11e-03 | 4.14e-02 | 3.01e-02 | 23 |
| hsa012003 | Colorectum | SER | Carbon metabolism | 40/1580 | 115/8465 | 2.77e-05 | 3.41e-04 | 2.47e-04 | 40 |
| hsa040663 | Colorectum | SER | HIF-1 signaling pathway | 36/1580 | 109/8465 | 2.27e-04 | 2.15e-03 | 1.56e-03 | 36 |
| hsa000103 | Colorectum | SER | Glycolysis / Gluconeogenesis | 24/1580 | 67/8465 | 6.62e-04 | 5.36e-03 | 3.89e-03 | 24 |
| hsa012303 | Colorectum | SER | Biosynthesis of amino acids | 23/1580 | 75/8465 | 8.11e-03 | 4.14e-02 | 3.01e-02 | 23 |
| hsa0120010 | Liver | NAFLD | Carbon metabolism | 26/1043 | 115/8465 | 1.39e-03 | 1.71e-02 | 1.38e-02 | 26 |
| hsa0120011 | Liver | NAFLD | Carbon metabolism | 26/1043 | 115/8465 | 1.39e-03 | 1.71e-02 | 1.38e-02 | 26 |
| hsa0120021 | Liver | Cirrhotic | Carbon metabolism | 64/2530 | 115/8465 | 6.37e-09 | 1.18e-07 | 7.26e-08 | 64 |
| hsa000109 | Liver | Cirrhotic | Glycolysis / Gluconeogenesis | 32/2530 | 67/8465 | 1.50e-03 | 7.80e-03 | 4.81e-03 | 32 |
| hsa012304 | Liver | Cirrhotic | Biosynthesis of amino acids | 35/2530 | 75/8465 | 1.54e-03 | 7.83e-03 | 4.83e-03 | 35 |
| hsa0406612 | Liver | Cirrhotic | HIF-1 signaling pathway | 46/2530 | 109/8465 | 4.00e-03 | 1.59e-02 | 9.78e-03 | 46 |
| hsa00030 | Liver | Cirrhotic | Pentose phosphate pathway | 16/2530 | 30/8465 | 6.04e-03 | 2.12e-02 | 1.30e-02 | 16 |
| hsa0120031 | Liver | Cirrhotic | Carbon metabolism | 64/2530 | 115/8465 | 6.37e-09 | 1.18e-07 | 7.26e-08 | 64 |
| hsa0001012 | Liver | Cirrhotic | Glycolysis / Gluconeogenesis | 32/2530 | 67/8465 | 1.50e-03 | 7.80e-03 | 4.81e-03 | 32 |
| hsa0123011 | Liver | Cirrhotic | Biosynthesis of amino acids | 35/2530 | 75/8465 | 1.54e-03 | 7.83e-03 | 4.83e-03 | 35 |
| Page: 1 2 |
Top |
Cell-cell communication analysis |
| Identification of potential cell-cell interactions between two cell types and their ligand-receptor pairs for different disease states |
| Ligand | Receptor | LRpair | Pathway | Tissue | Disease Stage |
| Page: 1 |
Top |
Single-cell gene regulatory network inference analysis |
| Find out the significant the regulons (TFs) and the target genes of each regulon across cell types for different disease states |
| TF | Cell Type | Tissue | Disease Stage | Target Gene | RSS | Regulon Activity |
| ∗The dot plots of a searched regulon are shown for all cell subpopulations in each disease state of each tissue based on the regulon specific score inferred using pySCENIC and by calculating the average expression. |
| Page: 1 |
Top |
Somatic mutation of malignant transformation related genes |
| Annotation of somatic variants for genes involved in malignant transformation |
| Hugo Symbol | Variant Class | Variant Classification | dbSNP RS | HGVSc | HGVSp | HGVSp Short | SWISSPROT | BIOTYPE | SIFT | PolyPhen | Tumor Sample Barcode | Tissue | Histology | Sex | Age | Stage | Therapy Types | Drugs | Outcome |
| ALDOB | SNV | Missense_Mutation | c.1043N>T | p.Ser348Phe | p.S348F | P05062 | protein_coding | deleterious(0.05) | benign(0.364) | TCGA-AN-A04C-01 | Breast | breast invasive carcinoma | Female | <65 | I/II | Unknown | Unknown | SD | |
| ALDOB | SNV | Missense_Mutation | rs17852652 | c.487G>A | p.Ala163Thr | p.A163T | P05062 | protein_coding | deleterious(0.01) | possibly_damaging(0.828) | TCGA-AN-A0AK-01 | Breast | breast invasive carcinoma | Female | >=65 | I/II | Unknown | Unknown | SD |
| ALDOB | SNV | Missense_Mutation | c.50N>T | p.Ser17Leu | p.S17L | P05062 | protein_coding | tolerated(0.46) | benign(0.046) | TCGA-C8-A1HG-01 | Breast | breast invasive carcinoma | Female | <65 | I/II | Unknown | Unknown | SD | |
| ALDOB | SNV | Missense_Mutation | rs371526091 | c.992G>A | p.Arg331Gln | p.R331Q | P05062 | protein_coding | deleterious(0) | probably_damaging(0.957) | TCGA-C5-A7UH-01 | Cervix | cervical & endocervical cancer | Female | <65 | III/IV | Chemotherapy | cisplatin | SD |
| ALDOB | SNV | Missense_Mutation | rs150407710 | c.991C>T | p.Arg331Trp | p.R331W | P05062 | protein_coding | deleterious(0) | probably_damaging(1) | TCGA-EA-A3HS-01 | Cervix | cervical & endocervical cancer | Female | <65 | I/II | Unknown | Unknown | SD |
| ALDOB | SNV | Missense_Mutation | novel | c.829N>A | p.Glu277Lys | p.E277K | P05062 | protein_coding | deleterious(0.03) | probably_damaging(0.979) | TCGA-EK-A3GK-01 | Cervix | cervical & endocervical cancer | Female | <65 | I/II | Unknown | Unknown | SD |
| ALDOB | SNV | Missense_Mutation | c.162N>T | p.Glu54Asp | p.E54D | P05062 | protein_coding | tolerated(0.1) | benign(0.113) | TCGA-A6-6141-01 | Colorectum | colon adenocarcinoma | Male | <65 | I/II | Chemotherapy | 5-fu | SD | |
| ALDOB | SNV | Missense_Mutation | c.944N>C | p.Gly315Ala | p.G315A | P05062 | protein_coding | tolerated(0.72) | benign(0.001) | TCGA-AA-3821-01 | Colorectum | colon adenocarcinoma | Female | >=65 | I/II | Unknown | Unknown | SD | |
| ALDOB | SNV | Missense_Mutation | novel | c.482G>T | p.Ser161Ile | p.S161I | P05062 | protein_coding | tolerated(0.18) | benign(0.095) | TCGA-AA-3845-01 | Colorectum | colon adenocarcinoma | Female | >=65 | I/II | Unknown | Unknown | PD |
| ALDOB | SNV | Missense_Mutation | c.916N>A | p.Leu306Met | p.L306M | P05062 | protein_coding | deleterious(0.01) | probably_damaging(0.999) | TCGA-AA-3949-01 | Colorectum | colon adenocarcinoma | Female | >=65 | III/IV | Unknown | Unknown | SD |
| Page: 1 2 3 4 5 6 7 |
Top |
Related drugs of malignant transformation related genes |
| Identification of chemicals and drugs interact with genes involved in malignant transfromation |
| (DGIdb 4.0) |
| Entrez ID | Symbol | Category | Interaction Types | Drug Claim Name | Drug Name | PMIDs |
| Page: 1 |

Copyright 2023-Present -The University of Texas Health Science Center at Houston |