| Tissue | Expression Dynamics | Abbreviation |
| Breast |  | IDC: Invasive ductal carcinoma |
| DCIS: Ductal carcinoma in situ |
| Precancer(BRCA1-mut): Precancerous lesion from BRCA1 mutation carriers |
| Colorectum (GSE201348) |  | FAP: Familial adenomatous polyposis |
| CRC: Colorectal cancer |
| Colorectum (HTA11) |  | AD: Adenomas |
| SER: Sessile serrated lesions |
| MSI-H: Microsatellite-high colorectal cancer |
| MSS: Microsatellite stable colorectal cancer |
| Endometrium |  | AEH: Atypical endometrial hyperplasia |
| EEC: Endometrioid Cancer |
| Esophagus | 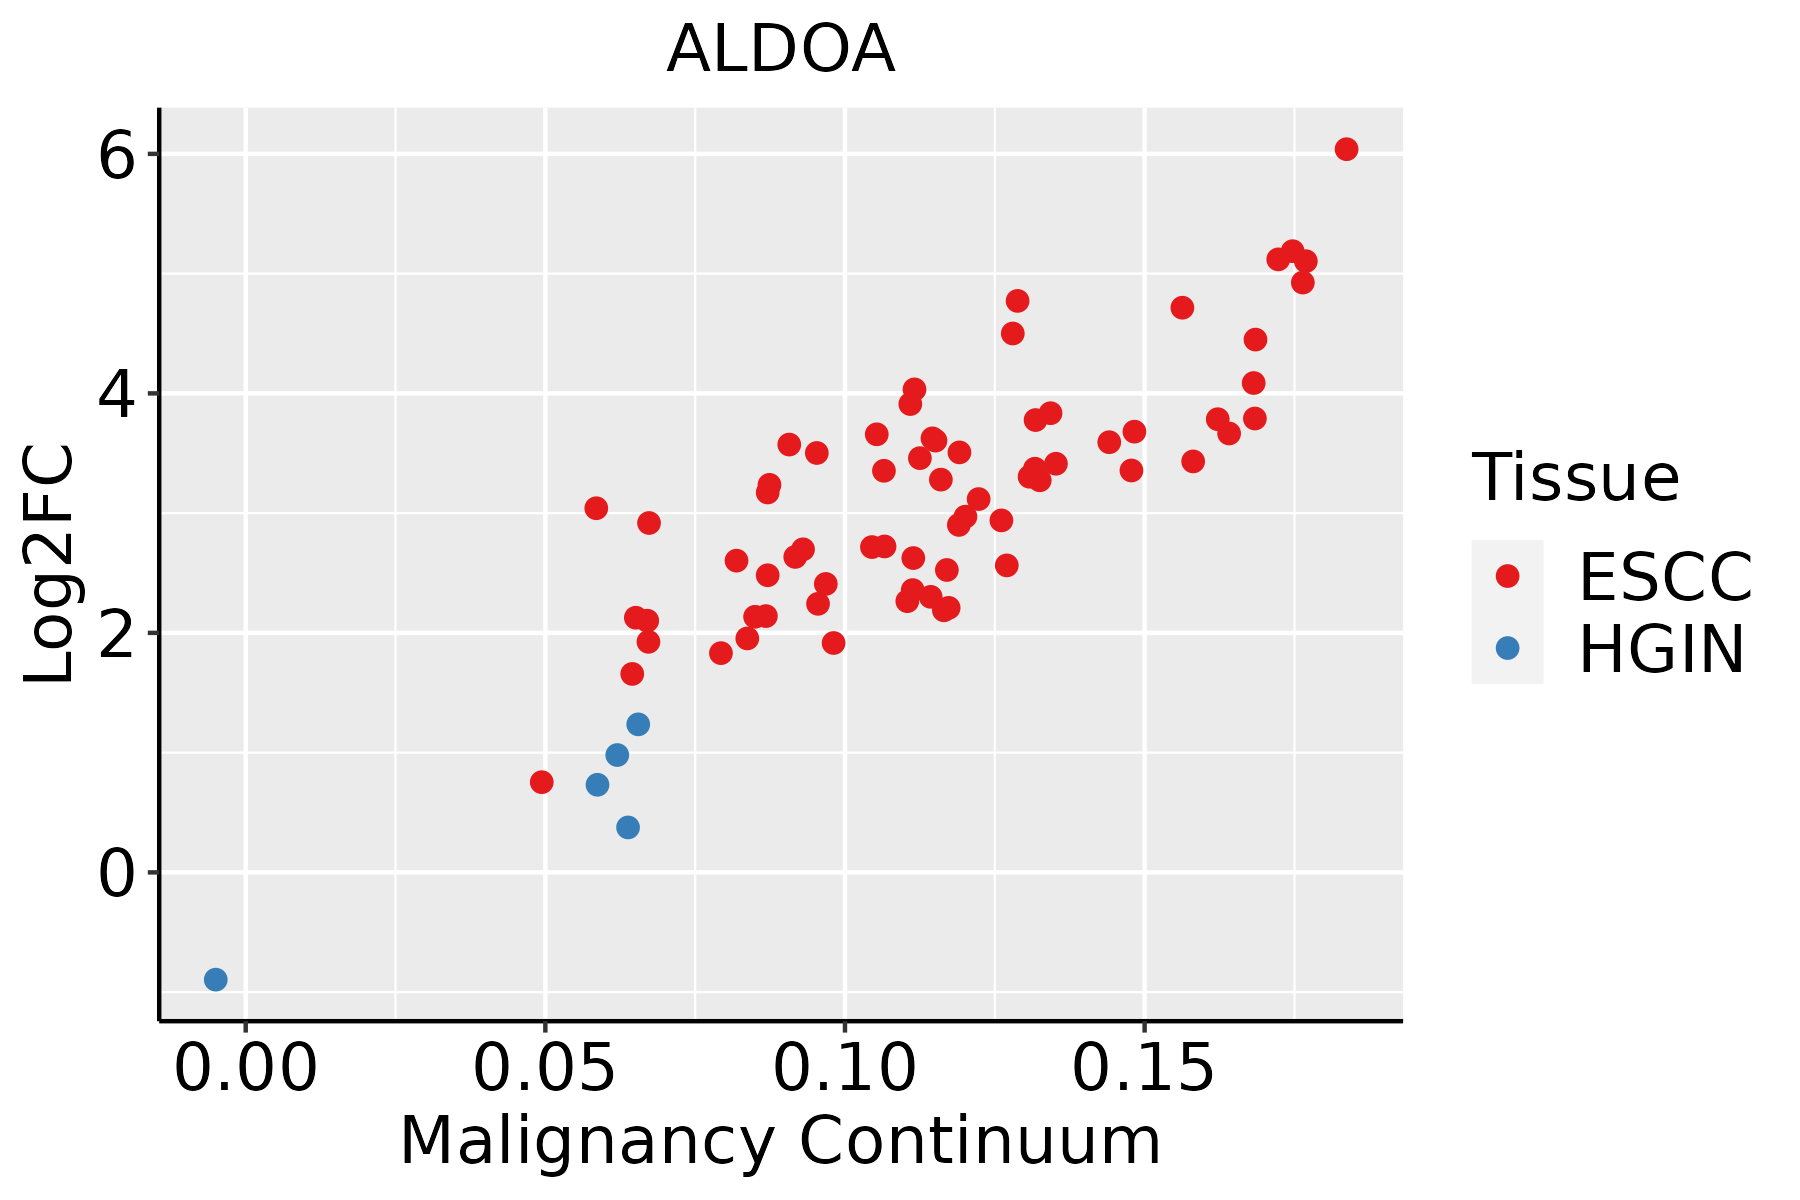 | ESCC: Esophageal squamous cell carcinoma |
| HGIN: High-grade intraepithelial neoplasias |
| LGIN: Low-grade intraepithelial neoplasias |
| GC |  | CAG: Chronic atrophic gastritis |
| CAG with IM: Chronic atrophic gastritis with intestinal metaplasia |
| CSG: Chronic superficial gastritis |
| GC: Gastric cancer |
| SIM: Severe intestinal metaplasia |
| WIM: Wild intestinal metaplasia |
| Liver | 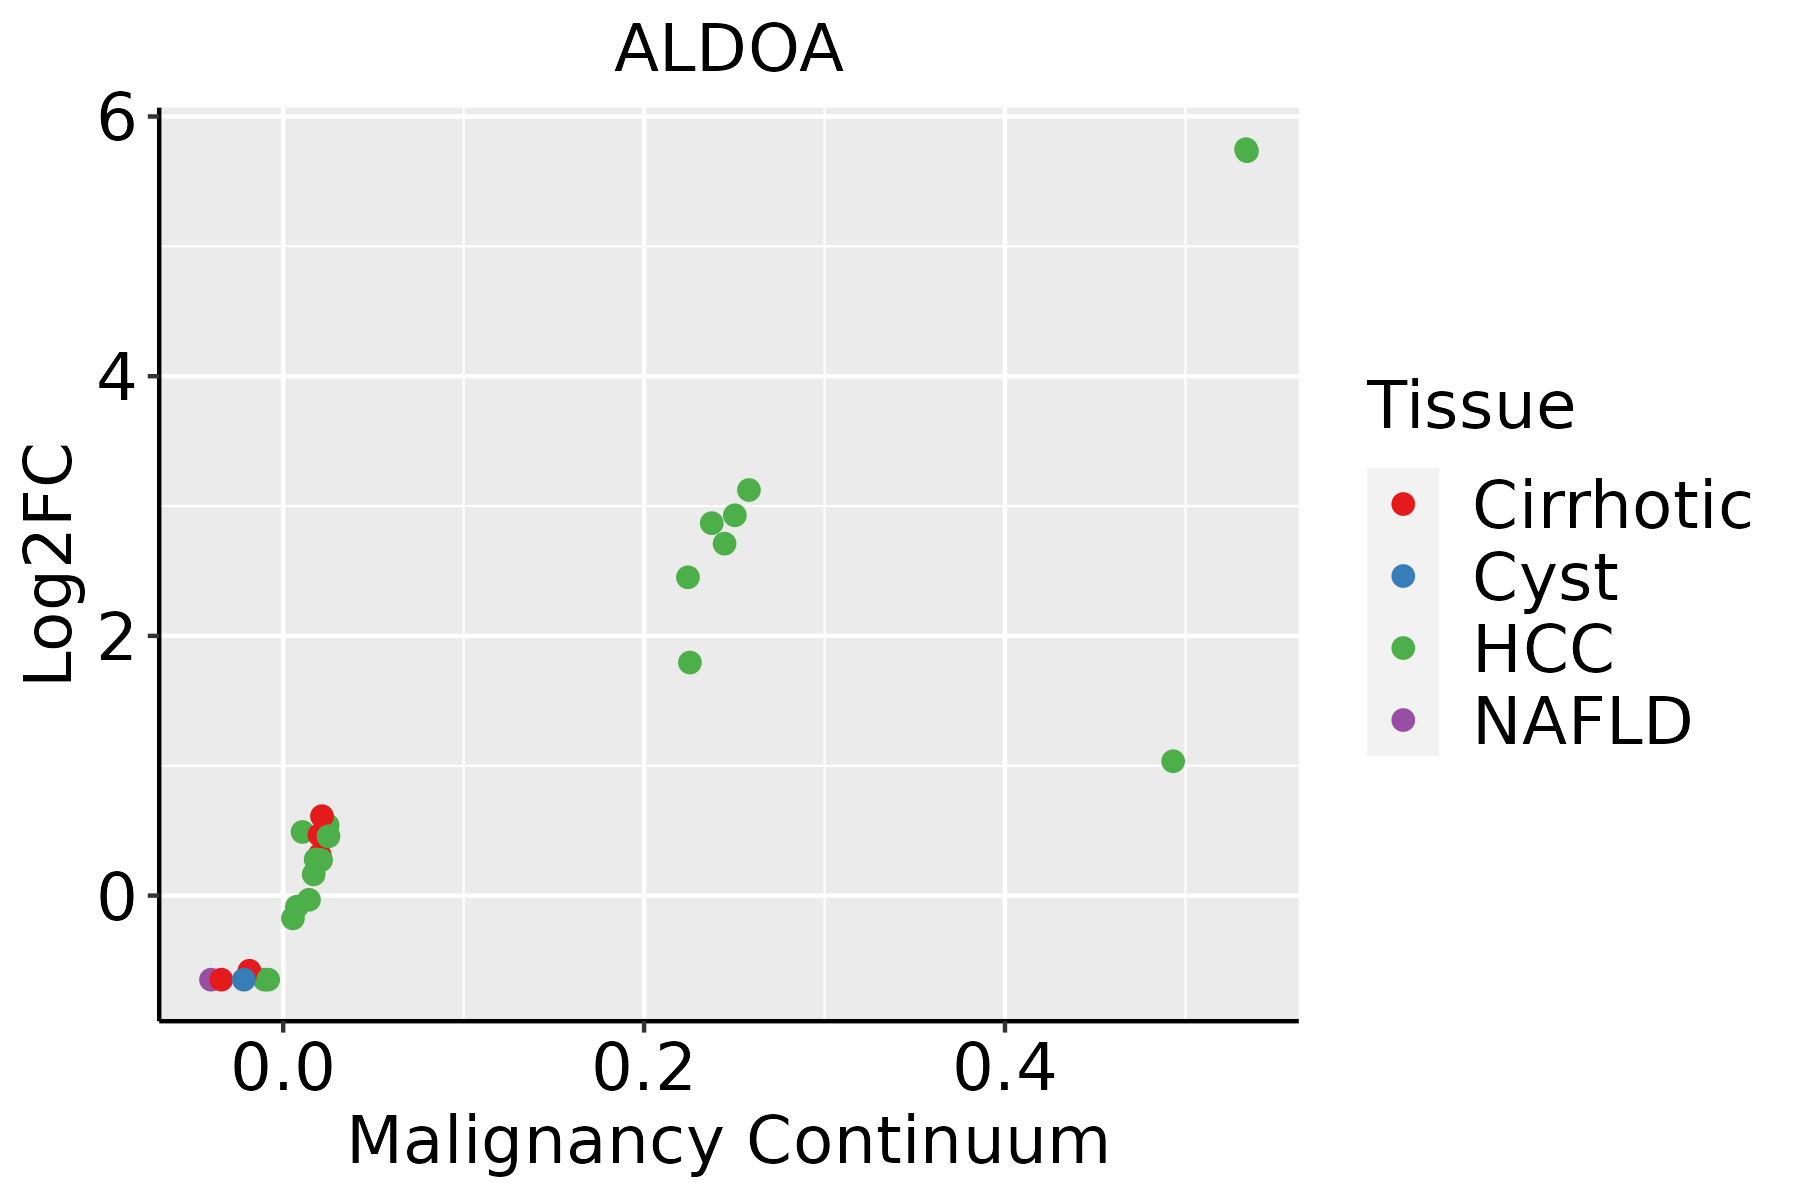 | HCC: Hepatocellular carcinoma |
| NAFLD: Non-alcoholic fatty liver disease |
| Lung | 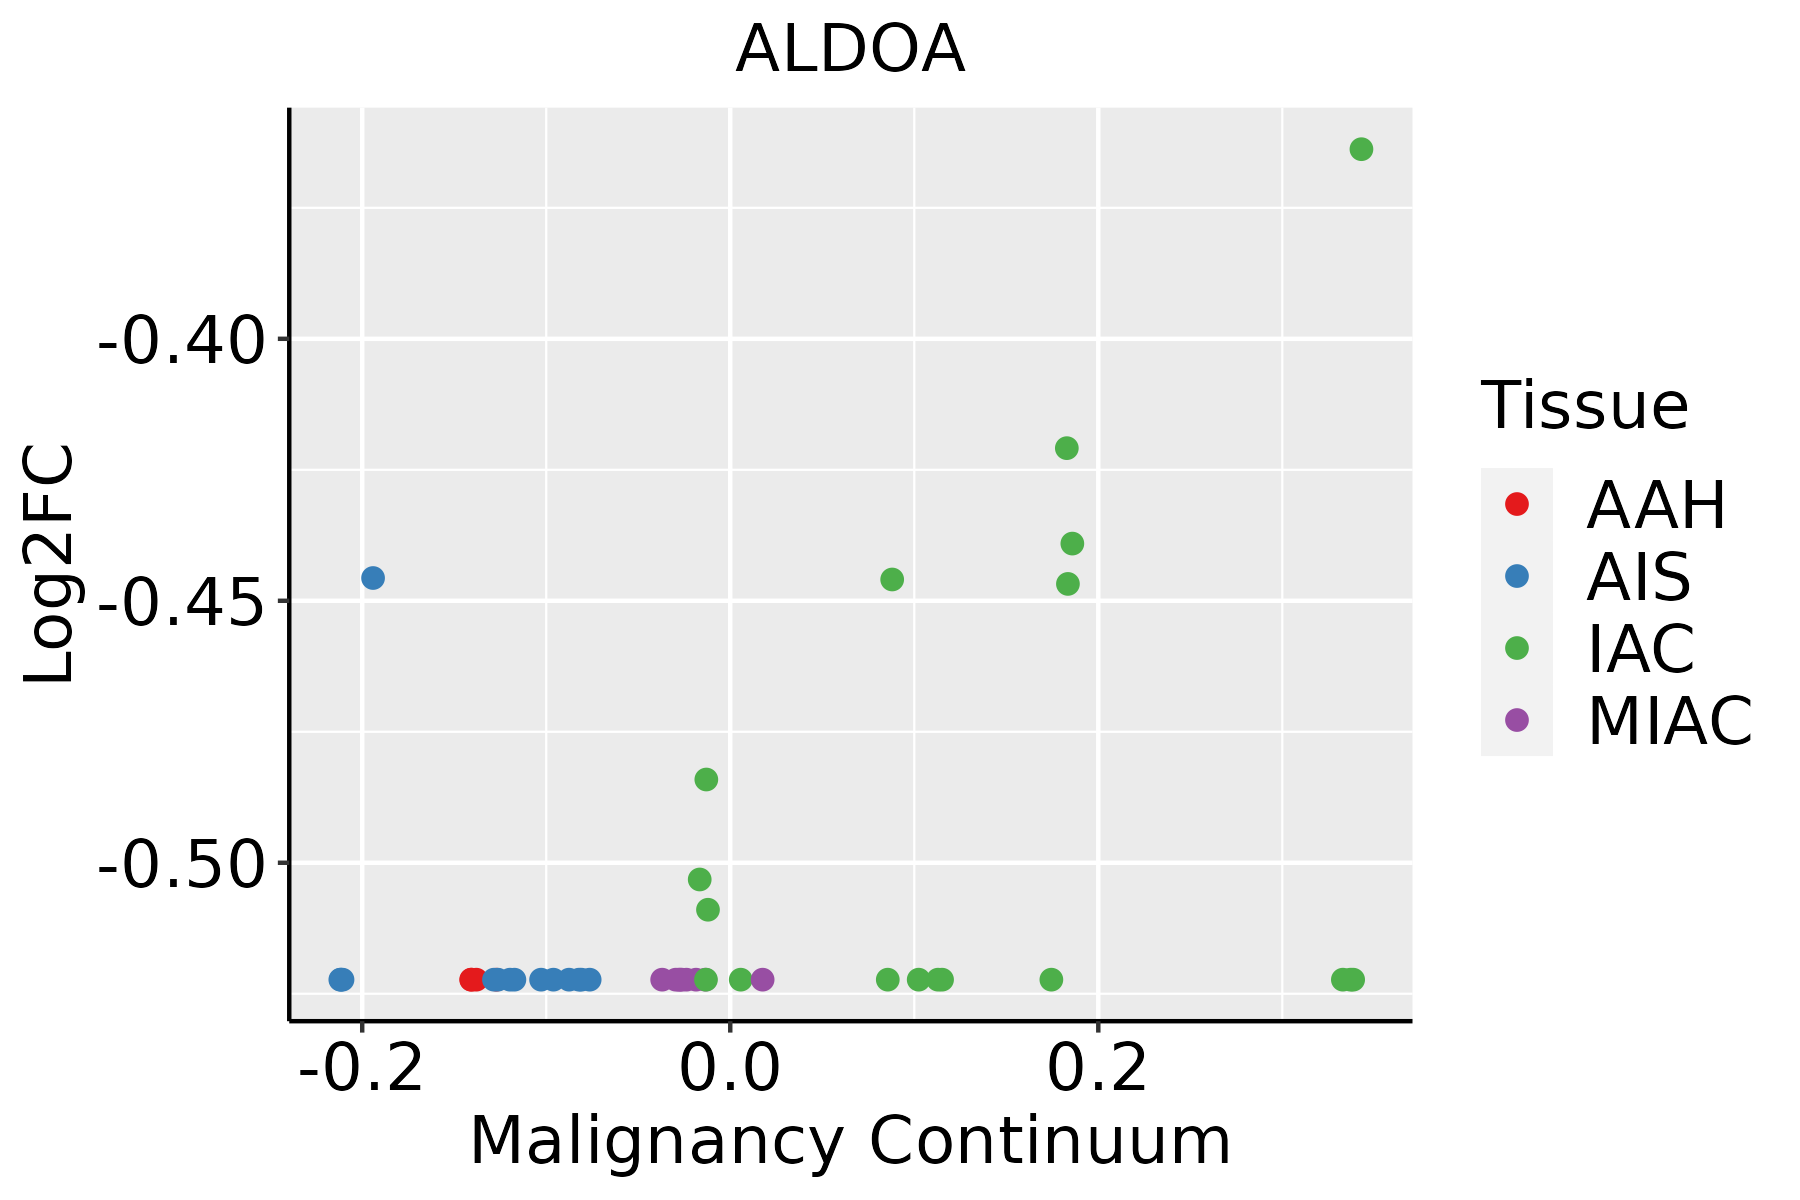 | AAH: Atypical adenomatous hyperplasia |
| AIS: Adenocarcinoma in situ |
| IAC: Invasive lung adenocarcinoma |
| MIA: Minimally invasive adenocarcinoma |
| Oral Cavity | 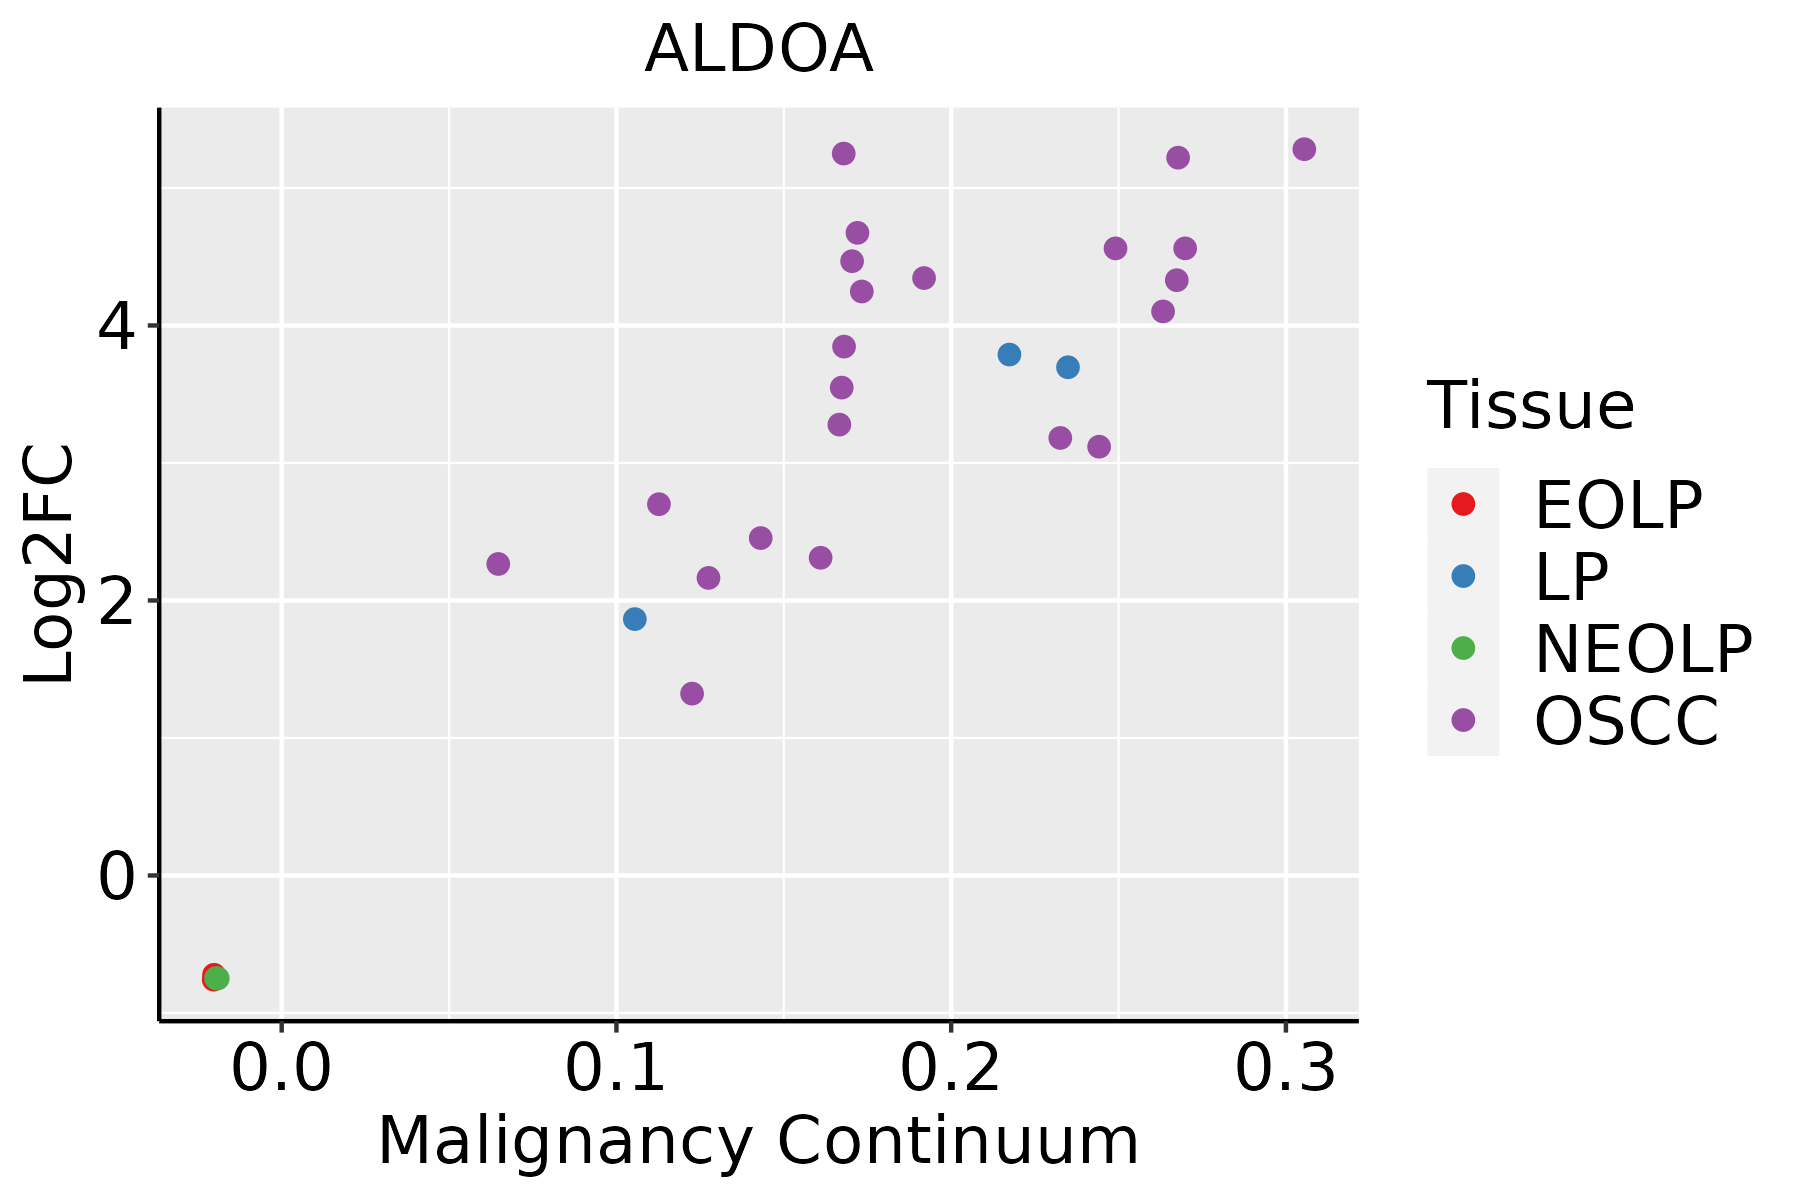 | EOLP: Erosive Oral lichen planus |
| LP: leukoplakia |
| NEOLP: Non-erosive oral lichen planus |
| OSCC: Oral squamous cell carcinoma |
| Prostate |  | BPH: Benign Prostatic Hyperplasia |
| Skin | 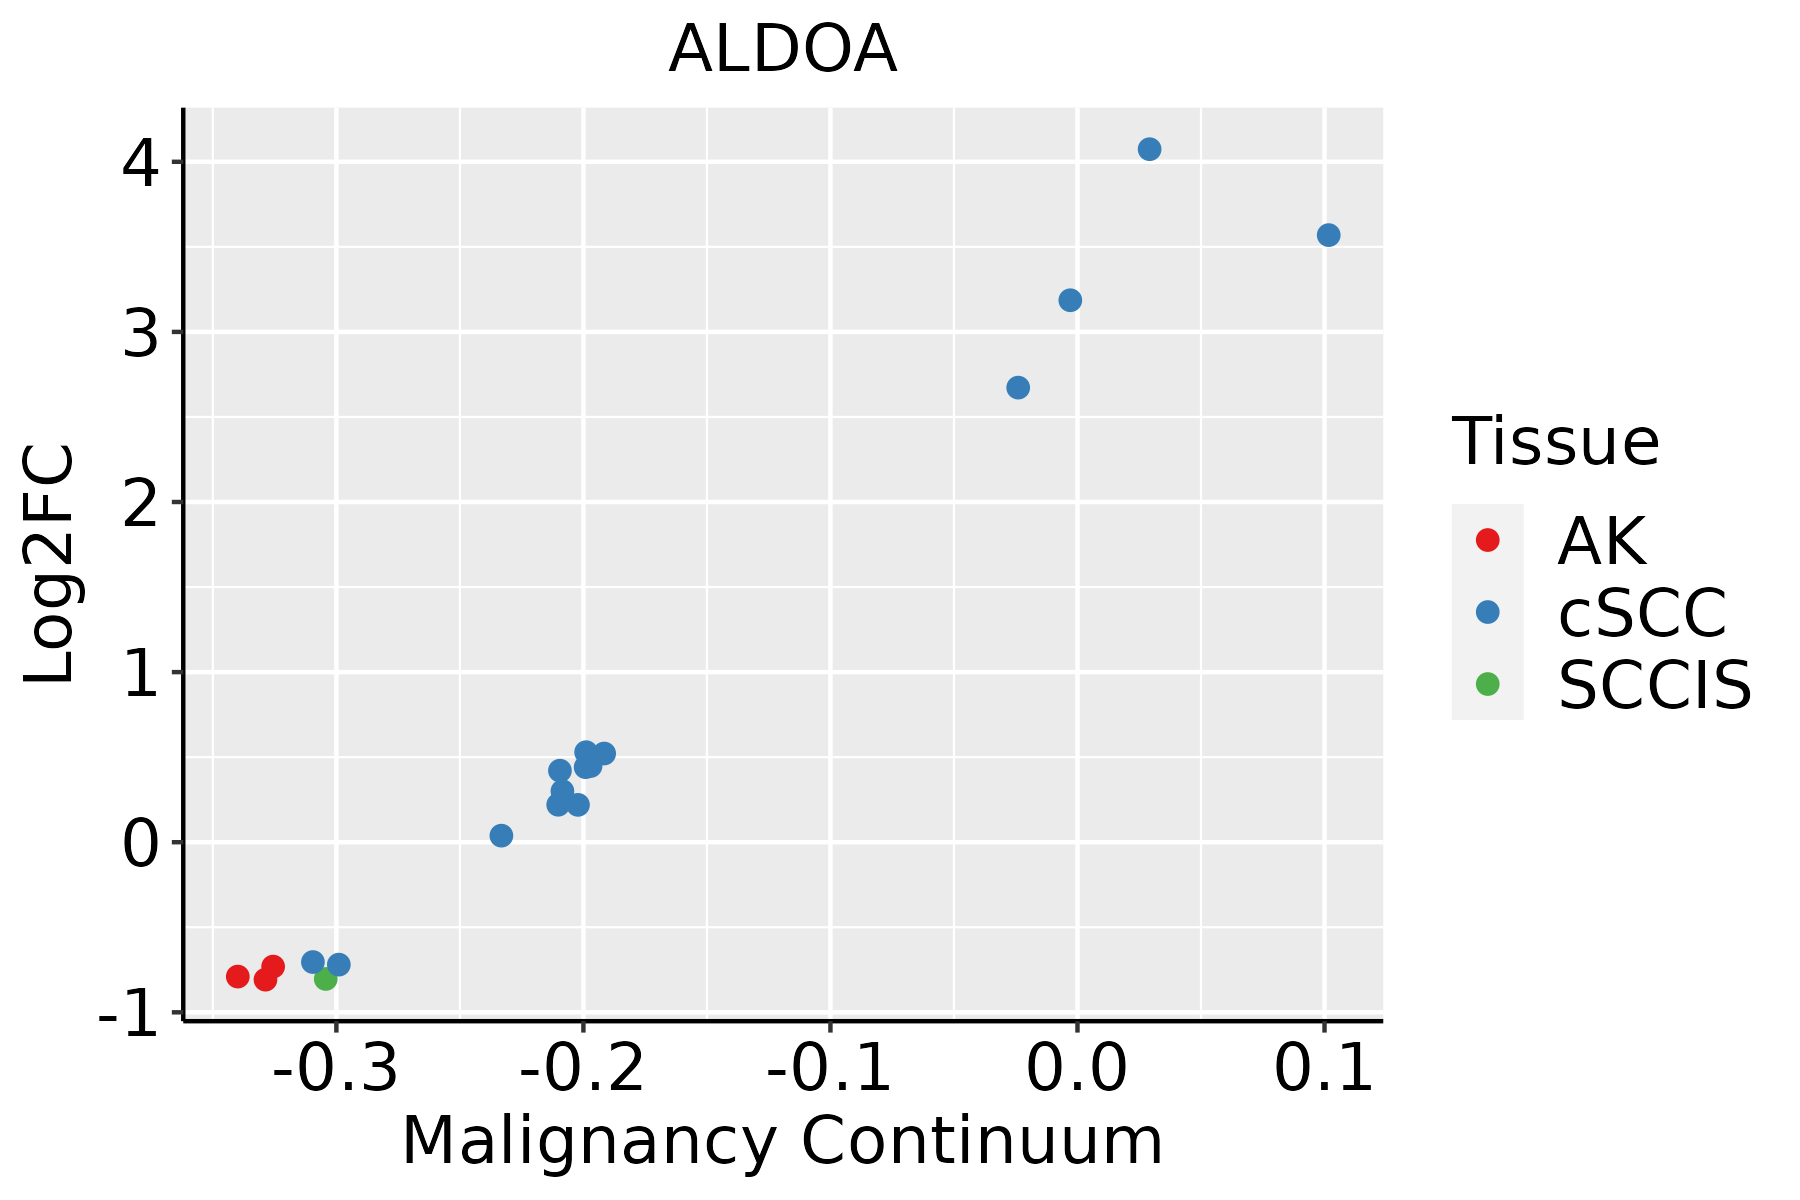 | AK: Actinic keratosis |
| cSCC: Cutaneous squamous cell carcinoma |
| SCCIS:squamous cell carcinoma in situ |
| Thyroid |  | ATC: Anaplastic thyroid cancer |
| HT: Hashimoto's thyroiditis |
| PTC: Papillary thyroid cancer |
| GO ID | Tissue | Disease Stage | Description | Gene Ratio | Bg Ratio | pvalue | p.adjust | Count |
| GO:00460349 | Breast | Precancer | ATP metabolic process | 82/1080 | 277/18723 | 1.94e-36 | 5.19e-33 | 82 |
| GO:00060918 | Breast | Precancer | generation of precursor metabolites and energy | 94/1080 | 490/18723 | 1.54e-25 | 1.64e-22 | 94 |
| GO:00067547 | Breast | Precancer | ATP biosynthetic process | 21/1080 | 57/18723 | 2.31e-12 | 4.26e-10 | 21 |
| GO:00092067 | Breast | Precancer | purine ribonucleoside triphosphate biosynthetic process | 22/1080 | 68/18723 | 1.41e-11 | 1.88e-09 | 22 |
| GO:00091457 | Breast | Precancer | purine nucleoside triphosphate biosynthetic process | 22/1080 | 69/18723 | 1.95e-11 | 2.43e-09 | 22 |
| GO:00092017 | Breast | Precancer | ribonucleoside triphosphate biosynthetic process | 22/1080 | 74/18723 | 9.18e-11 | 1.00e-08 | 22 |
| GO:00091448 | Breast | Precancer | purine nucleoside triphosphate metabolic process | 24/1080 | 88/18723 | 9.66e-11 | 1.03e-08 | 24 |
| GO:00092057 | Breast | Precancer | purine ribonucleoside triphosphate metabolic process | 23/1080 | 82/18723 | 1.27e-10 | 1.34e-08 | 23 |
| GO:00091427 | Breast | Precancer | nucleoside triphosphate biosynthetic process | 23/1080 | 85/18723 | 2.82e-10 | 2.69e-08 | 23 |
| GO:00091997 | Breast | Precancer | ribonucleoside triphosphate metabolic process | 23/1080 | 89/18723 | 7.65e-10 | 6.66e-08 | 23 |
| GO:00091418 | Breast | Precancer | nucleoside triphosphate metabolic process | 26/1080 | 112/18723 | 7.72e-10 | 6.66e-08 | 26 |
| GO:00196938 | Breast | Precancer | ribose phosphate metabolic process | 49/1080 | 396/18723 | 3.81e-07 | 1.78e-05 | 49 |
| GO:00091528 | Breast | Precancer | purine ribonucleotide biosynthetic process | 28/1080 | 169/18723 | 4.17e-07 | 1.89e-05 | 28 |
| GO:00463907 | Breast | Precancer | ribose phosphate biosynthetic process | 30/1080 | 190/18723 | 4.75e-07 | 2.11e-05 | 30 |
| GO:00092607 | Breast | Precancer | ribonucleotide biosynthetic process | 29/1080 | 182/18723 | 6.05e-07 | 2.55e-05 | 29 |
| GO:00091509 | Breast | Precancer | purine ribonucleotide metabolic process | 46/1080 | 368/18723 | 6.47e-07 | 2.71e-05 | 46 |
| GO:00091179 | Breast | Precancer | nucleotide metabolic process | 56/1080 | 489/18723 | 7.40e-07 | 3.00e-05 | 56 |
| GO:00092598 | Breast | Precancer | ribonucleotide metabolic process | 47/1080 | 385/18723 | 9.69e-07 | 3.84e-05 | 47 |
| GO:00469398 | Breast | Precancer | nucleotide phosphorylation | 20/1080 | 101/18723 | 1.07e-06 | 4.18e-05 | 20 |
| GO:00067539 | Breast | Precancer | nucleoside phosphate metabolic process | 56/1080 | 497/18723 | 1.24e-06 | 4.70e-05 | 56 |
| Pathway ID | Tissue | Disease Stage | Description | Gene Ratio | Bg Ratio | pvalue | p.adjust | qvalue | Count |
| hsa01200 | Colorectum | AD | Carbon metabolism | 55/2092 | 115/8465 | 5.53e-08 | 8.42e-07 | 5.37e-07 | 55 |
| hsa00010 | Colorectum | AD | Glycolysis / Gluconeogenesis | 34/2092 | 67/8465 | 3.63e-06 | 4.34e-05 | 2.77e-05 | 34 |
| hsa01230 | Colorectum | AD | Biosynthesis of amino acids | 28/2092 | 75/8465 | 9.99e-03 | 3.89e-02 | 2.48e-02 | 28 |
| hsa012001 | Colorectum | AD | Carbon metabolism | 55/2092 | 115/8465 | 5.53e-08 | 8.42e-07 | 5.37e-07 | 55 |
| hsa000101 | Colorectum | AD | Glycolysis / Gluconeogenesis | 34/2092 | 67/8465 | 3.63e-06 | 4.34e-05 | 2.77e-05 | 34 |
| hsa012301 | Colorectum | AD | Biosynthesis of amino acids | 28/2092 | 75/8465 | 9.99e-03 | 3.89e-02 | 2.48e-02 | 28 |
| hsa012002 | Colorectum | SER | Carbon metabolism | 40/1580 | 115/8465 | 2.77e-05 | 3.41e-04 | 2.47e-04 | 40 |
| hsa040662 | Colorectum | SER | HIF-1 signaling pathway | 36/1580 | 109/8465 | 2.27e-04 | 2.15e-03 | 1.56e-03 | 36 |
| hsa000102 | Colorectum | SER | Glycolysis / Gluconeogenesis | 24/1580 | 67/8465 | 6.62e-04 | 5.36e-03 | 3.89e-03 | 24 |
| hsa012302 | Colorectum | SER | Biosynthesis of amino acids | 23/1580 | 75/8465 | 8.11e-03 | 4.14e-02 | 3.01e-02 | 23 |
| hsa012003 | Colorectum | SER | Carbon metabolism | 40/1580 | 115/8465 | 2.77e-05 | 3.41e-04 | 2.47e-04 | 40 |
| hsa040663 | Colorectum | SER | HIF-1 signaling pathway | 36/1580 | 109/8465 | 2.27e-04 | 2.15e-03 | 1.56e-03 | 36 |
| hsa000103 | Colorectum | SER | Glycolysis / Gluconeogenesis | 24/1580 | 67/8465 | 6.62e-04 | 5.36e-03 | 3.89e-03 | 24 |
| hsa012303 | Colorectum | SER | Biosynthesis of amino acids | 23/1580 | 75/8465 | 8.11e-03 | 4.14e-02 | 3.01e-02 | 23 |
| hsa012004 | Colorectum | MSS | Carbon metabolism | 43/1875 | 115/8465 | 1.37e-04 | 1.17e-03 | 7.19e-04 | 43 |
| hsa000104 | Colorectum | MSS | Glycolysis / Gluconeogenesis | 28/1875 | 67/8465 | 2.36e-04 | 1.81e-03 | 1.11e-03 | 28 |
| hsa040664 | Colorectum | MSS | HIF-1 signaling pathway | 39/1875 | 109/8465 | 7.61e-04 | 5.00e-03 | 3.06e-03 | 39 |
| hsa012005 | Colorectum | MSS | Carbon metabolism | 43/1875 | 115/8465 | 1.37e-04 | 1.17e-03 | 7.19e-04 | 43 |
| hsa000105 | Colorectum | MSS | Glycolysis / Gluconeogenesis | 28/1875 | 67/8465 | 2.36e-04 | 1.81e-03 | 1.11e-03 | 28 |
| hsa040665 | Colorectum | MSS | HIF-1 signaling pathway | 39/1875 | 109/8465 | 7.61e-04 | 5.00e-03 | 3.06e-03 | 39 |
| Hugo Symbol | Variant Class | Variant Classification | dbSNP RS | HGVSc | HGVSp | HGVSp Short | SWISSPROT | BIOTYPE | SIFT | PolyPhen | Tumor Sample Barcode | Tissue | Histology | Sex | Age | Stage | Therapy Types | Drugs | Outcome |
| ALDOA | SNV | Missense_Mutation | | c.641C>T | p.Ser214Leu | p.S214L | P04075 | protein_coding | deleterious(0) | possibly_damaging(0.833) | TCGA-A8-A06Q-01 | Breast | breast invasive carcinoma | Female | <65 | III/IV | Unknown | Unknown | SD |
| ALDOA | SNV | Missense_Mutation | | c.987G>C | p.Gln329His | p.Q329H | P04075 | protein_coding | deleterious(0) | probably_damaging(0.991) | TCGA-A8-A09I-01 | Breast | breast invasive carcinoma | Female | >=65 | I/II | Hormone Therapy | anastrozole | SD |
| ALDOA | SNV | Missense_Mutation | | c.490N>C | p.Asp164His | p.D164H | P04075 | protein_coding | deleterious(0) | probably_damaging(0.985) | TCGA-BH-A0BZ-01 | Breast | breast invasive carcinoma | Female | <65 | III/IV | Chemotherapy | doxorubicin | CR |
| ALDOA | SNV | Missense_Mutation | | c.562N>G | p.Arg188Gly | p.R188G | P04075 | protein_coding | deleterious(0) | probably_damaging(0.989) | TCGA-BH-A0HL-01 | Breast | breast invasive carcinoma | Female | <65 | I/II | Chemotherapy | cyclophosphamide | SD |
| ALDOA | SNV | Missense_Mutation | rs201658390 | c.929C>T | p.Ala310Val | p.A310V | P04075 | protein_coding | tolerated(0.12) | benign(0.091) | TCGA-BH-A18G-01 | Breast | breast invasive carcinoma | Female | >=65 | I/II | Unknown | Unknown | SD |
| ALDOA | SNV | Missense_Mutation | | c.817N>A | p.Asp273Asn | p.D273N | P04075 | protein_coding | deleterious(0) | benign(0.036) | TCGA-D8-A27G-01 | Breast | breast invasive carcinoma | Female | >=65 | I/II | Unknown | Unknown | SD |
| ALDOA | insertion | Frame_Shift_Ins | novel | c.678_679insT | p.Arg227SerfsTer18 | p.R227Sfs*18 | P04075 | protein_coding | | | TCGA-A2-A0CQ-01 | Breast | breast invasive carcinoma | Female | <65 | I/II | Chemotherapy | adriamycin | SD |
| ALDOA | insertion | Nonsense_Mutation | novel | c.679_680insTCAGAAGCTCAGGGAAGTGAAGT | p.Arg227LeufsTer7 | p.R227Lfs*7 | P04075 | protein_coding | | | TCGA-A2-A0CQ-01 | Breast | breast invasive carcinoma | Female | <65 | I/II | Chemotherapy | adriamycin | SD |
| ALDOA | insertion | Nonsense_Mutation | novel | c.1253_1254insGAGTCCACTGGTGCGGGCAGGAGACAGAATGGG | p.Tyr418delinsTer | p.Y418delins* | P04075 | protein_coding | | | TCGA-AR-A0TY-01 | Breast | breast invasive carcinoma | Female | <65 | I/II | Unspecific | Paclitaxel | PD |
| ALDOA | SNV | Missense_Mutation | rs756789043 | c.1249G>A | p.Ala417Thr | p.A417T | P04075 | protein_coding | tolerated(0.18) | possibly_damaging(0.868) | TCGA-2W-A8YY-01 | Cervix | cervical & endocervical cancer | Female | <65 | I/II | Chemotherapy | cisplatin | CR |


