| Tissue | Expression Dynamics | Abbreviation |
| Colorectum (GSE201348) |  | FAP: Familial adenomatous polyposis |
| CRC: Colorectal cancer |
| Colorectum (HTA11) |  | AD: Adenomas |
| SER: Sessile serrated lesions |
| MSI-H: Microsatellite-high colorectal cancer |
| MSS: Microsatellite stable colorectal cancer |
| Esophagus |  | ESCC: Esophageal squamous cell carcinoma |
| HGIN: High-grade intraepithelial neoplasias |
| LGIN: Low-grade intraepithelial neoplasias |
| Liver | 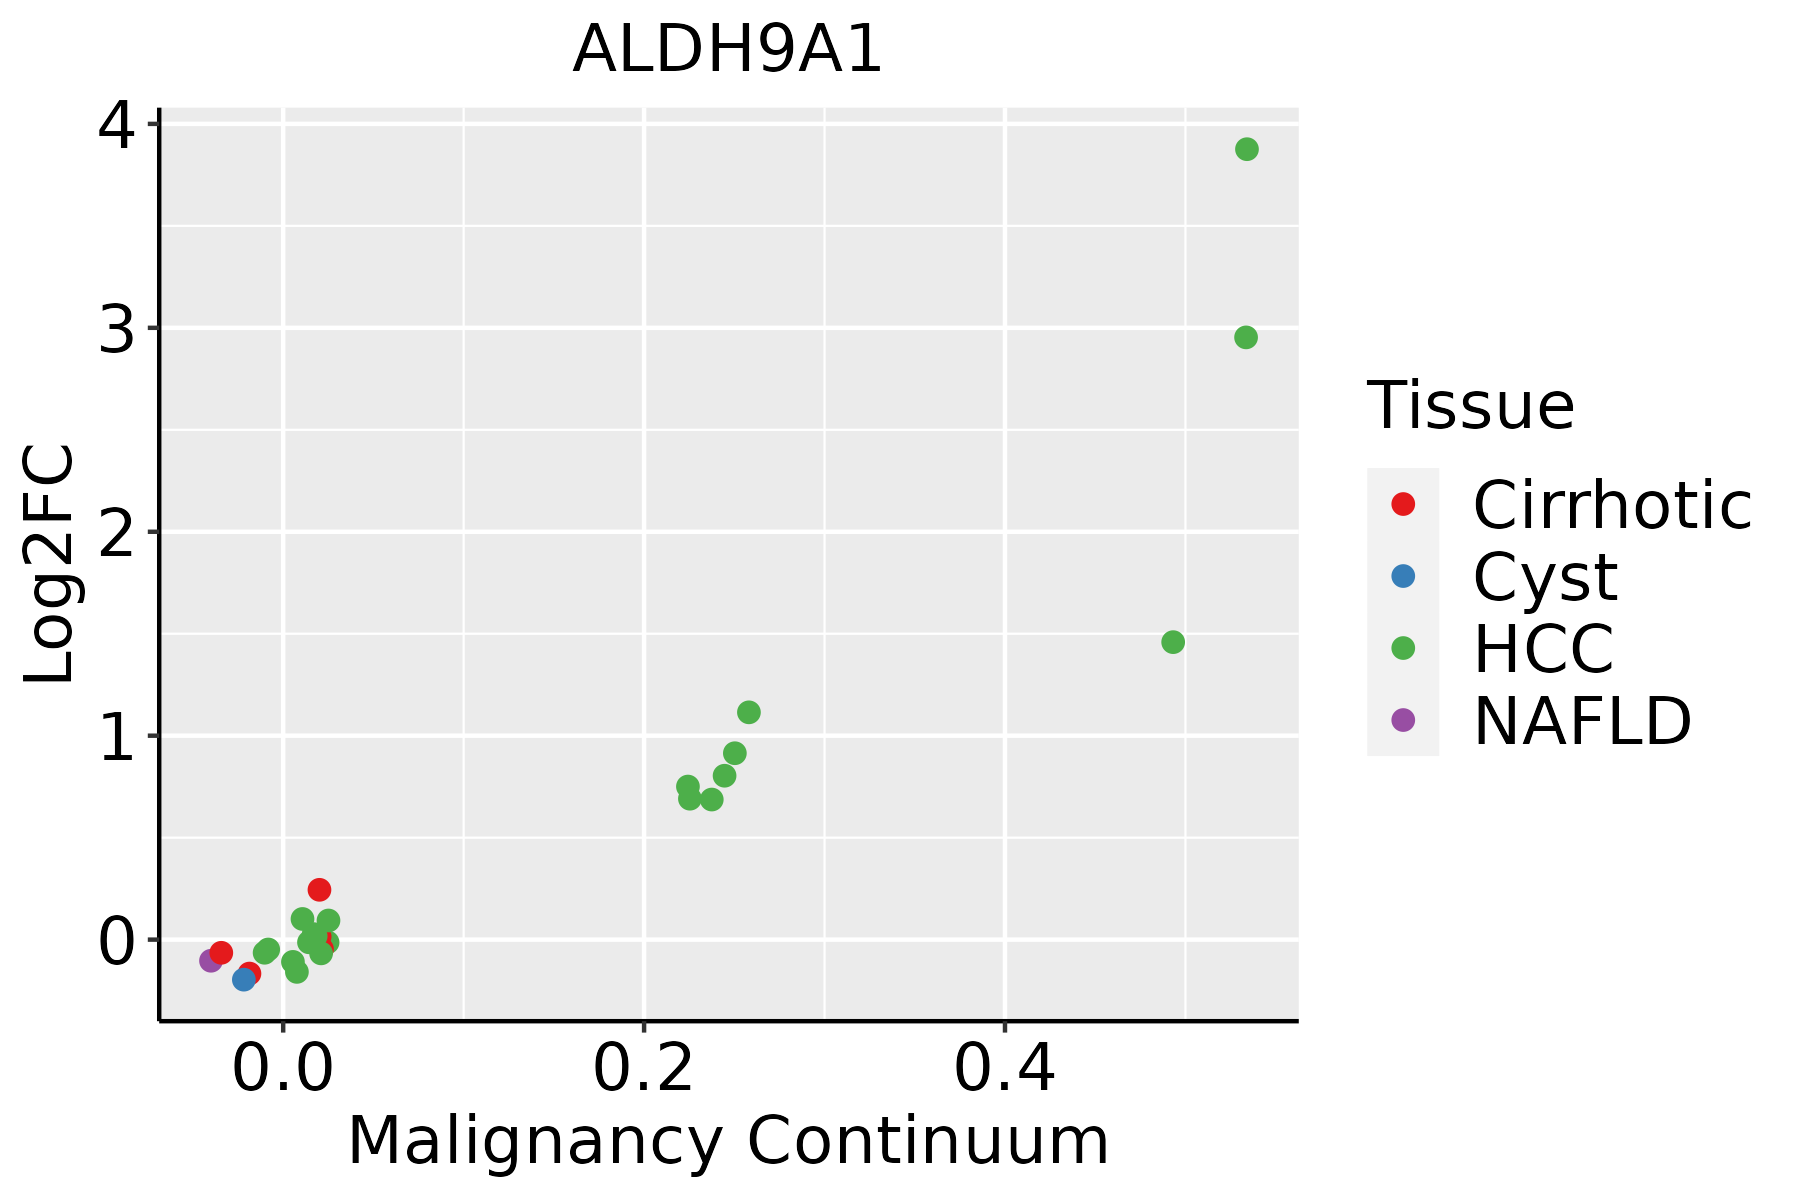 | HCC: Hepatocellular carcinoma |
| NAFLD: Non-alcoholic fatty liver disease |
| Oral Cavity | 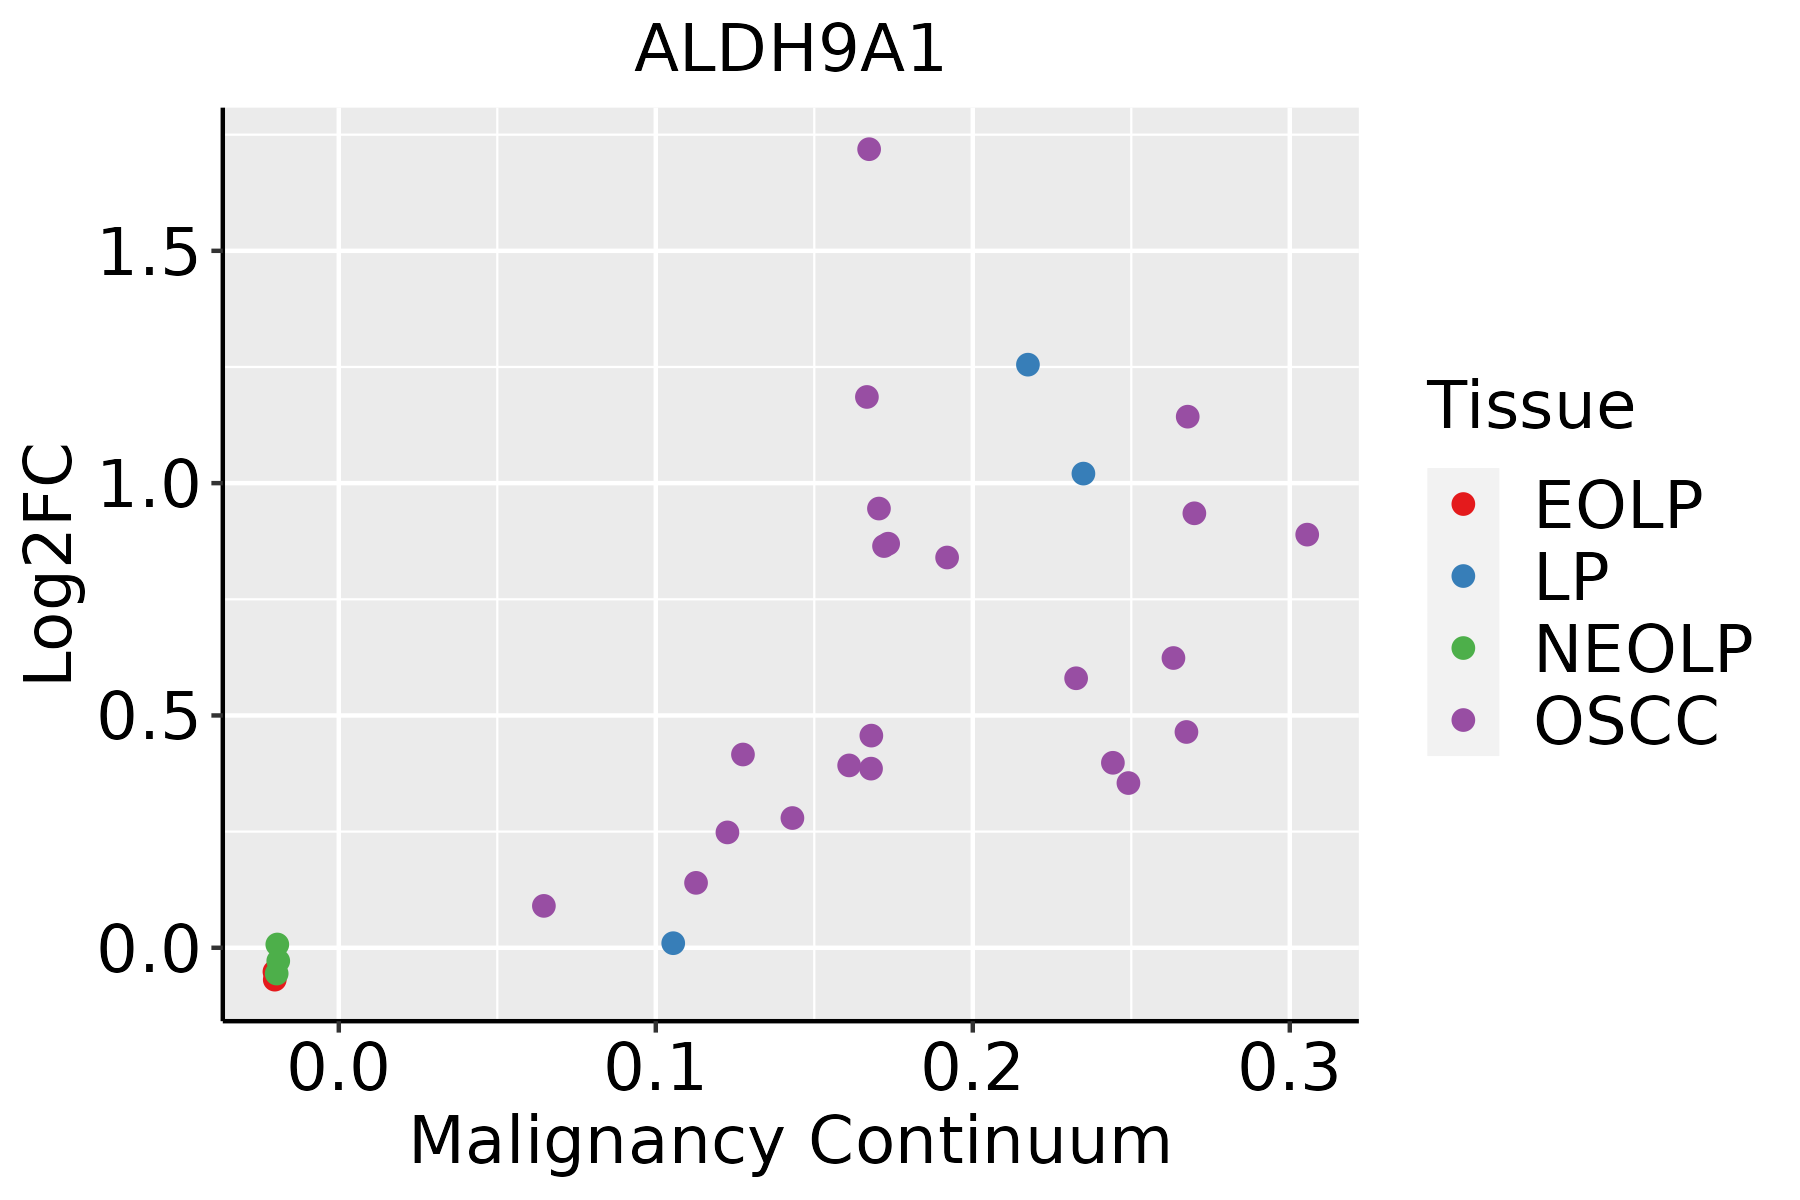 | EOLP: Erosive Oral lichen planus |
| LP: leukoplakia |
| NEOLP: Non-erosive oral lichen planus |
| OSCC: Oral squamous cell carcinoma |
| Prostate | 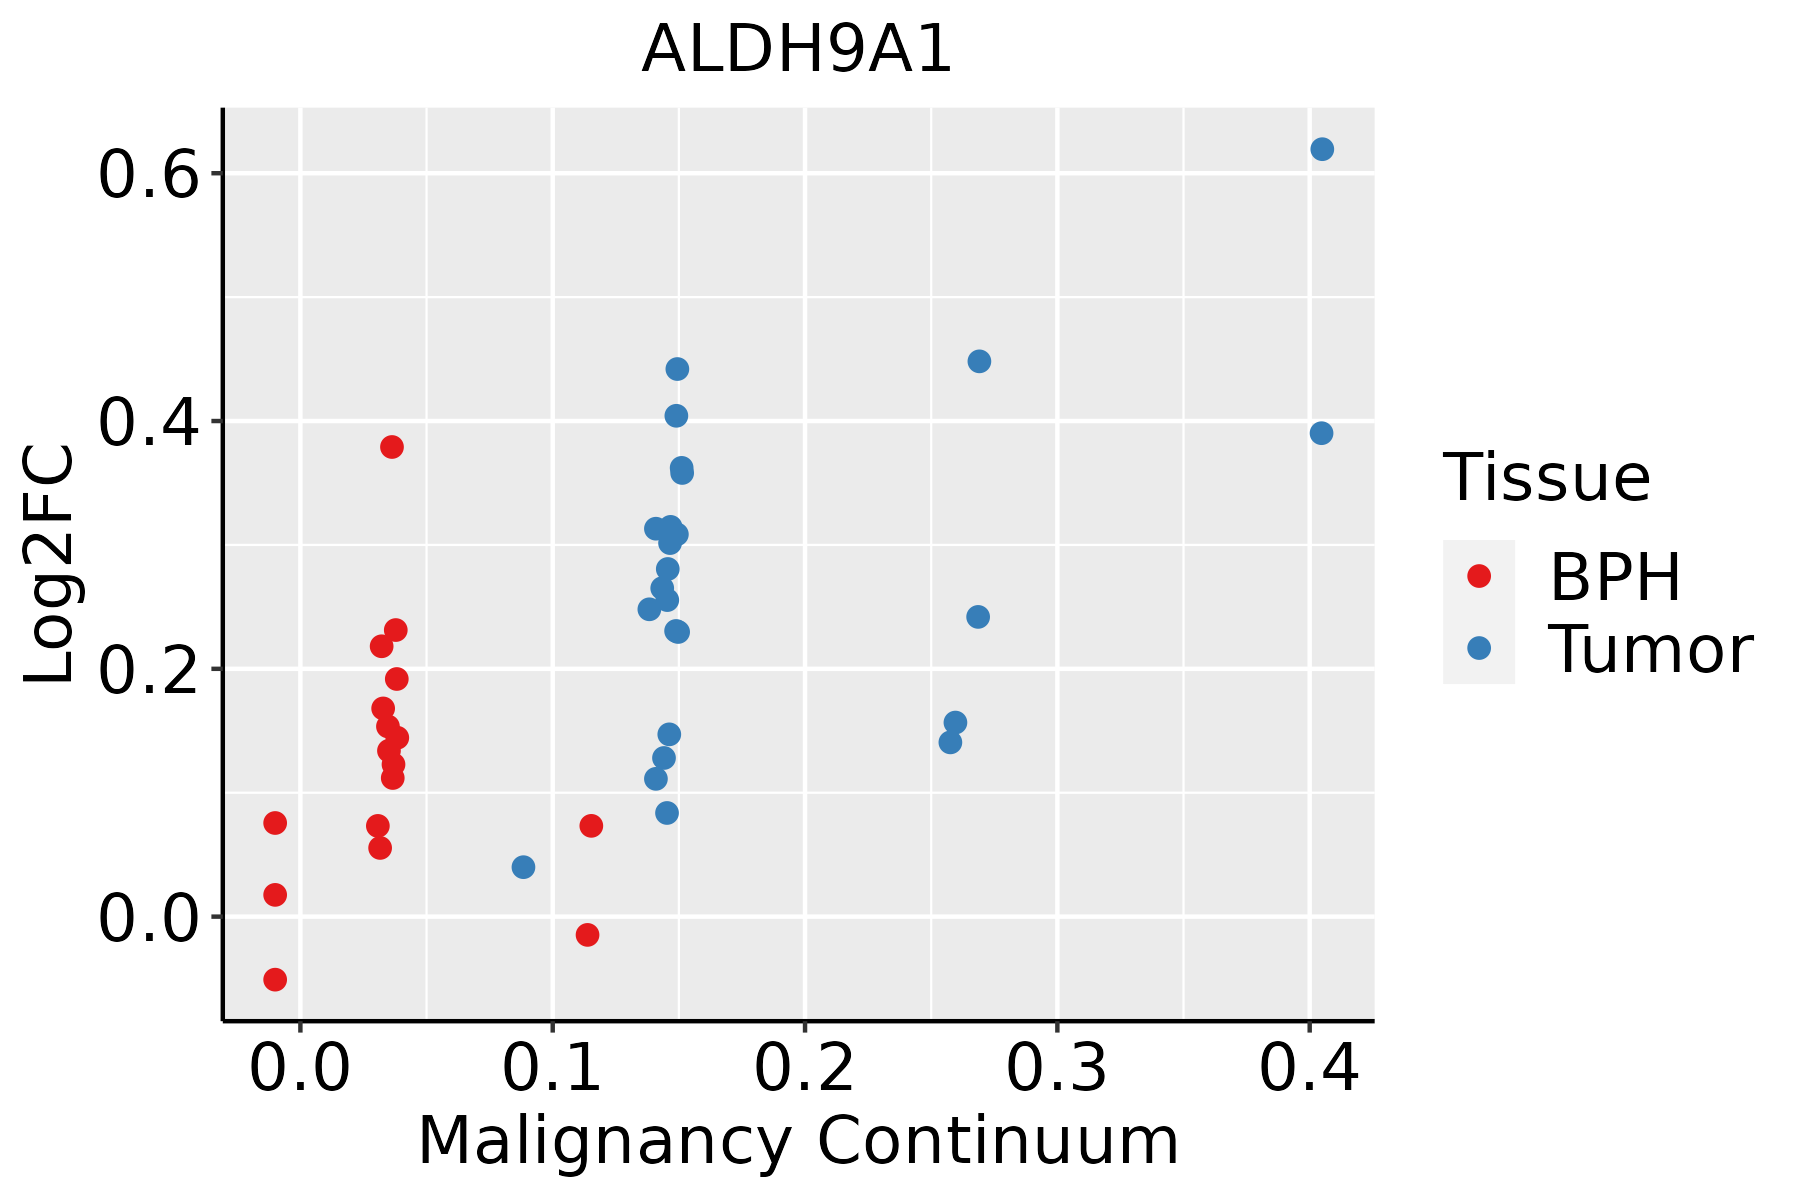 | BPH: Benign Prostatic Hyperplasia |
| Skin | 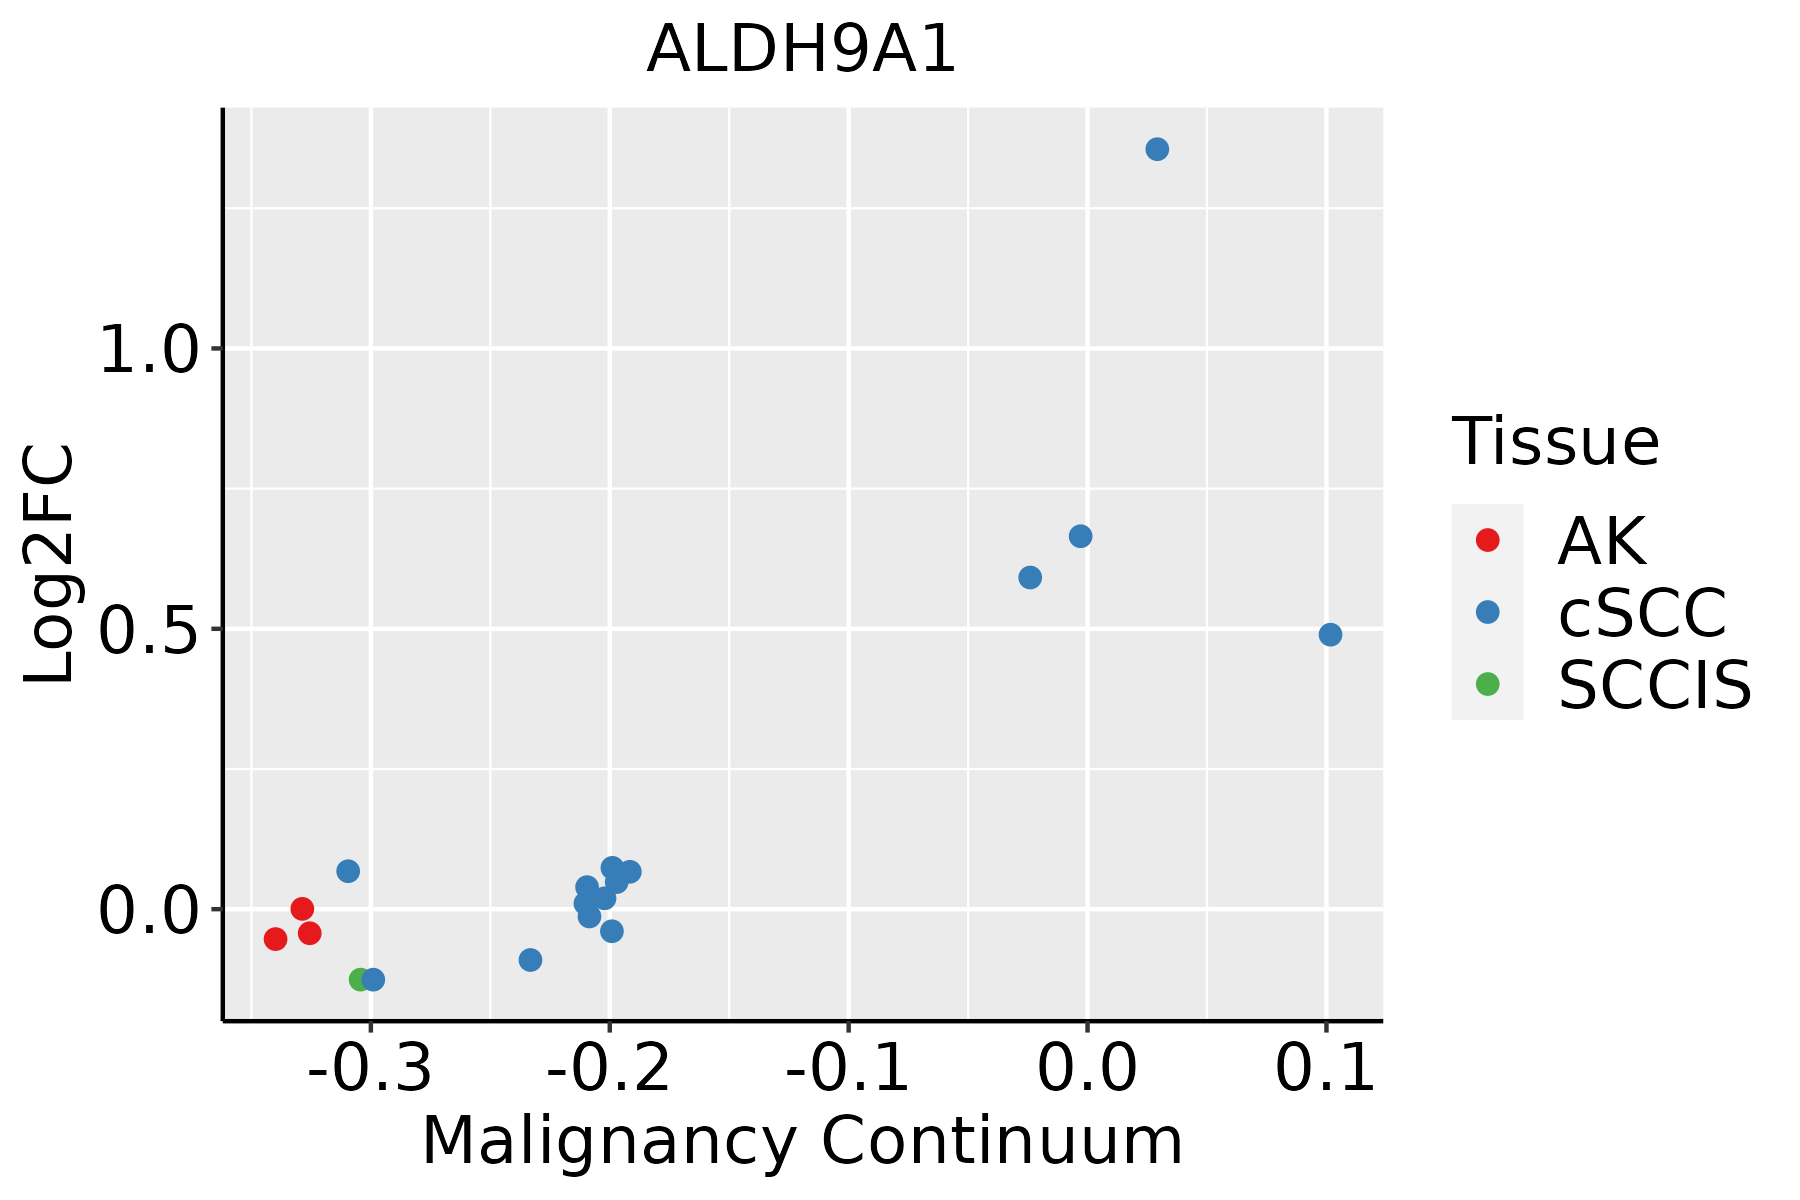 | AK: Actinic keratosis |
| cSCC: Cutaneous squamous cell carcinoma |
| SCCIS:squamous cell carcinoma in situ |
| Thyroid | 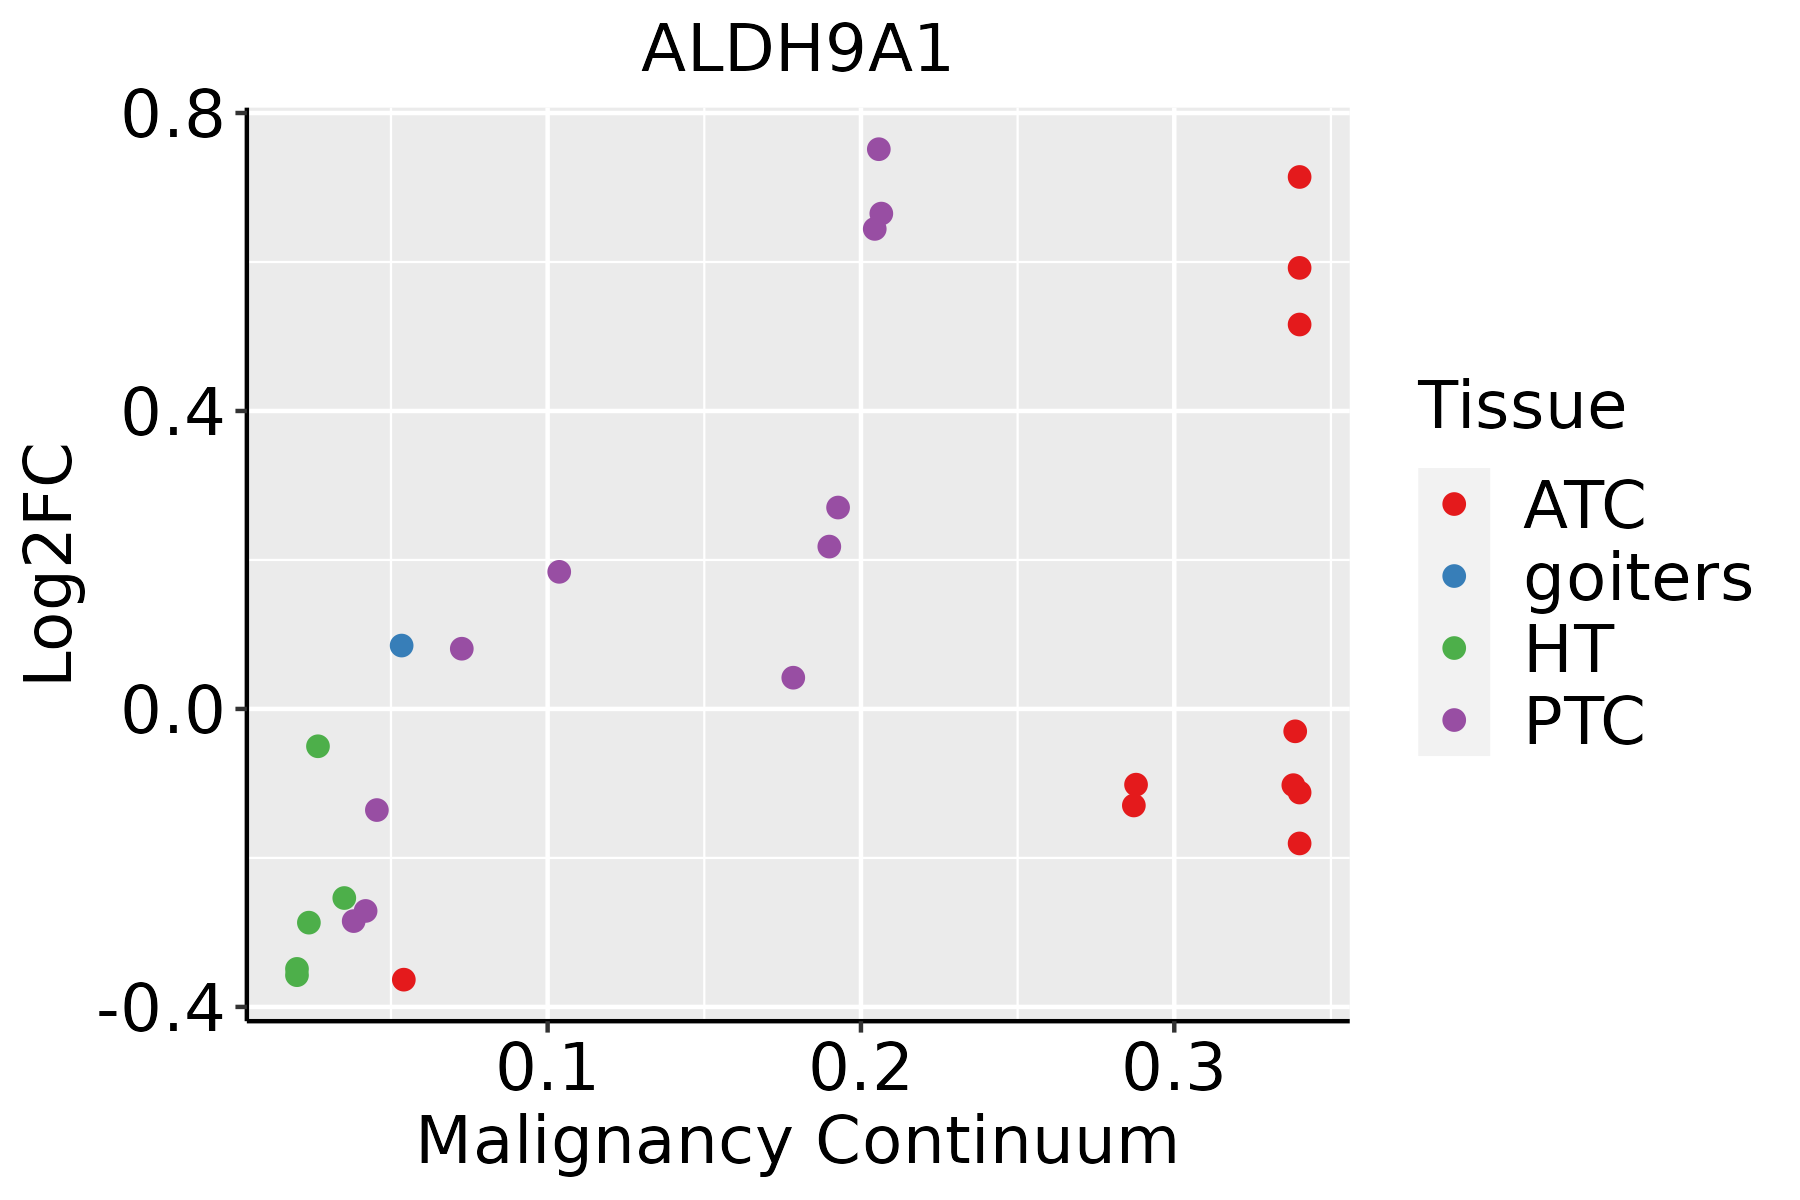 | ATC: Anaplastic thyroid cancer |
| HT: Hashimoto's thyroiditis |
| PTC: Papillary thyroid cancer |
| GO ID | Tissue | Disease Stage | Description | Gene Ratio | Bg Ratio | pvalue | p.adjust | Count |
| GO:0006575 | Colorectum | AD | cellular modified amino acid metabolic process | 59/3918 | 188/18723 | 4.80e-04 | 5.27e-03 | 59 |
| GO:0006081 | Colorectum | AD | cellular aldehyde metabolic process | 22/3918 | 60/18723 | 3.64e-03 | 2.60e-02 | 22 |
| GO:0042398 | Colorectum | AD | cellular modified amino acid biosynthetic process | 18/3918 | 46/18723 | 3.67e-03 | 2.60e-02 | 18 |
| GO:00423981 | Colorectum | MSS | cellular modified amino acid biosynthetic process | 20/3467 | 46/18723 | 8.26e-05 | 1.35e-03 | 20 |
| GO:00065751 | Colorectum | MSS | cellular modified amino acid metabolic process | 55/3467 | 188/18723 | 2.16e-04 | 3.01e-03 | 55 |
| GO:00060811 | Colorectum | MSS | cellular aldehyde metabolic process | 21/3467 | 60/18723 | 1.81e-03 | 1.60e-02 | 21 |
| GO:00060812 | Colorectum | MSI-H | cellular aldehyde metabolic process | 13/1319 | 60/18723 | 2.27e-04 | 5.94e-03 | 13 |
| GO:00423982 | Colorectum | MSI-H | cellular modified amino acid biosynthetic process | 10/1319 | 46/18723 | 1.14e-03 | 1.90e-02 | 10 |
| GO:00065752 | Colorectum | MSI-H | cellular modified amino acid metabolic process | 25/1319 | 188/18723 | 1.61e-03 | 2.39e-02 | 25 |
| GO:00065757 | Esophagus | ESCC | cellular modified amino acid metabolic process | 112/8552 | 188/18723 | 8.31e-05 | 6.06e-04 | 112 |
| GO:00423986 | Esophagus | ESCC | cellular modified amino acid biosynthetic process | 34/8552 | 46/18723 | 9.39e-05 | 6.70e-04 | 34 |
| GO:00060818 | Esophagus | ESCC | cellular aldehyde metabolic process | 40/8552 | 60/18723 | 8.30e-04 | 4.28e-03 | 40 |
| GO:00512623 | Esophagus | ESCC | protein tetramerization | 54/8552 | 87/18723 | 1.50e-03 | 7.06e-03 | 54 |
| GO:00512592 | Esophagus | ESCC | protein complex oligomerization | 130/8552 | 238/18723 | 3.29e-03 | 1.36e-02 | 130 |
| GO:004239811 | Liver | Cirrhotic | cellular modified amino acid biosynthetic process | 25/4634 | 46/18723 | 1.61e-05 | 2.19e-04 | 25 |
| GO:000657511 | Liver | Cirrhotic | cellular modified amino acid metabolic process | 70/4634 | 188/18723 | 9.04e-05 | 9.69e-04 | 70 |
| GO:00060815 | Liver | Cirrhotic | cellular aldehyde metabolic process | 28/4634 | 60/18723 | 1.83e-04 | 1.71e-03 | 28 |
| GO:004244511 | Liver | Cirrhotic | hormone metabolic process | 73/4634 | 218/18723 | 2.22e-03 | 1.36e-02 | 73 |
| GO:000657521 | Liver | HCC | cellular modified amino acid metabolic process | 119/7958 | 188/18723 | 6.47e-09 | 1.67e-07 | 119 |
| GO:004239821 | Liver | HCC | cellular modified amino acid biosynthetic process | 34/7958 | 46/18723 | 1.53e-05 | 1.67e-04 | 34 |
| Pathway ID | Tissue | Disease Stage | Description | Gene Ratio | Bg Ratio | pvalue | p.adjust | qvalue | Count |
| hsa00620 | Colorectum | AD | Pyruvate metabolism | 28/2092 | 47/8465 | 3.71e-07 | 5.41e-06 | 3.45e-06 | 28 |
| hsa00010 | Colorectum | AD | Glycolysis / Gluconeogenesis | 34/2092 | 67/8465 | 3.63e-06 | 4.34e-05 | 2.77e-05 | 34 |
| hsa00280 | Colorectum | AD | Valine, leucine and isoleucine degradation | 25/2092 | 48/8465 | 3.97e-05 | 3.41e-04 | 2.18e-04 | 25 |
| hsa00330 | Colorectum | AD | Arginine and proline metabolism | 23/2092 | 50/8465 | 8.27e-04 | 5.90e-03 | 3.76e-03 | 23 |
| hsa00310 | Colorectum | AD | Lysine degradation | 27/2092 | 63/8465 | 1.17e-03 | 7.75e-03 | 4.94e-03 | 27 |
| hsa00071 | Colorectum | AD | Fatty acid degradation | 20/2092 | 43/8465 | 1.50e-03 | 8.69e-03 | 5.54e-03 | 20 |
| hsa00561 | Colorectum | AD | Glycerolipid metabolism | 24/2092 | 63/8465 | 1.25e-02 | 4.54e-02 | 2.90e-02 | 24 |
| hsa006201 | Colorectum | AD | Pyruvate metabolism | 28/2092 | 47/8465 | 3.71e-07 | 5.41e-06 | 3.45e-06 | 28 |
| hsa000101 | Colorectum | AD | Glycolysis / Gluconeogenesis | 34/2092 | 67/8465 | 3.63e-06 | 4.34e-05 | 2.77e-05 | 34 |
| hsa002801 | Colorectum | AD | Valine, leucine and isoleucine degradation | 25/2092 | 48/8465 | 3.97e-05 | 3.41e-04 | 2.18e-04 | 25 |
| hsa003301 | Colorectum | AD | Arginine and proline metabolism | 23/2092 | 50/8465 | 8.27e-04 | 5.90e-03 | 3.76e-03 | 23 |
| hsa003101 | Colorectum | AD | Lysine degradation | 27/2092 | 63/8465 | 1.17e-03 | 7.75e-03 | 4.94e-03 | 27 |
| hsa000711 | Colorectum | AD | Fatty acid degradation | 20/2092 | 43/8465 | 1.50e-03 | 8.69e-03 | 5.54e-03 | 20 |
| hsa005611 | Colorectum | AD | Glycerolipid metabolism | 24/2092 | 63/8465 | 1.25e-02 | 4.54e-02 | 2.90e-02 | 24 |
| hsa006202 | Colorectum | SER | Pyruvate metabolism | 22/1580 | 47/8465 | 9.62e-06 | 1.33e-04 | 9.67e-05 | 22 |
| hsa003302 | Colorectum | SER | Arginine and proline metabolism | 17/1580 | 50/8465 | 7.12e-03 | 3.77e-02 | 2.74e-02 | 17 |
| hsa006203 | Colorectum | SER | Pyruvate metabolism | 22/1580 | 47/8465 | 9.62e-06 | 1.33e-04 | 9.67e-05 | 22 |
| hsa003303 | Colorectum | SER | Arginine and proline metabolism | 17/1580 | 50/8465 | 7.12e-03 | 3.77e-02 | 2.74e-02 | 17 |
| hsa006204 | Colorectum | MSS | Pyruvate metabolism | 24/1875 | 47/8465 | 1.25e-05 | 1.35e-04 | 8.27e-05 | 24 |
| hsa003304 | Colorectum | MSS | Arginine and proline metabolism | 23/1875 | 50/8465 | 1.52e-04 | 1.24e-03 | 7.61e-04 | 23 |
| Hugo Symbol | Variant Class | Variant Classification | dbSNP RS | HGVSc | HGVSp | HGVSp Short | SWISSPROT | BIOTYPE | SIFT | PolyPhen | Tumor Sample Barcode | Tissue | Histology | Sex | Age | Stage | Therapy Types | Drugs | Outcome |
| ALDH9A1 | SNV | Missense_Mutation | rs142168163 | c.1361G>A | p.Arg454Gln | p.R454Q | P49189 | protein_coding | deleterious(0.01) | probably_damaging(0.921) | TCGA-3C-AALK-01 | Breast | breast invasive carcinoma | Female | <65 | I/II | Chemotherapy | docetaxel | SD |
| ALDH9A1 | SNV | Missense_Mutation | | c.347N>T | p.Ala116Val | p.A116V | P49189 | protein_coding | deleterious(0) | probably_damaging(0.999) | TCGA-A8-A08F-01 | Breast | breast invasive carcinoma | Female | <65 | III/IV | Chemotherapy | 5-fluorouracil | CR |
| ALDH9A1 | SNV | Missense_Mutation | | c.500G>C | p.Arg167Thr | p.R167T | P49189 | protein_coding | deleterious(0.01) | probably_damaging(0.983) | TCGA-C8-A12K-01 | Breast | breast invasive carcinoma | Female | >=65 | I/II | Unknown | Unknown | SD |
| ALDH9A1 | insertion | Nonsense_Mutation | novel | c.368_369insGGCATGCGCTACCACACCCGGTTAATTTTTTTGTAT | p.Asn123delinsLysAlaCysAlaThrThrProGlyTerPhePheCysIle | p.N123delinsKACATTPG*FFCI | P49189 | protein_coding | | | TCGA-A2-A0CU-01 | Breast | breast invasive carcinoma | Female | >=65 | I/II | Hormone Therapy | tamoxiphen | SD |
| ALDH9A1 | deletion | Frame_Shift_Del | novel | c.219_220delNN | p.Glu74SerfsTer13 | p.E74Sfs*13 | P49189 | protein_coding | | | TCGA-S3-AA11-01 | Breast | breast invasive carcinoma | Female | >=65 | I/II | Hormone Therapy | letrozole | CR |
| ALDH9A1 | SNV | Missense_Mutation | novel | c.710C>A | p.Ala237Asp | p.A237D | P49189 | protein_coding | deleterious(0.03) | possibly_damaging(0.514) | TCGA-2W-A8YY-01 | Cervix | cervical & endocervical cancer | Female | <65 | I/II | Chemotherapy | cisplatin | CR |
| ALDH9A1 | SNV | Missense_Mutation | rs760770069 | c.485N>T | p.Ser162Leu | p.S162L | P49189 | protein_coding | deleterious(0.01) | probably_damaging(0.985) | TCGA-Q1-A5R2-01 | Cervix | cervical & endocervical cancer | Female | <65 | I/II | Chemotherapy | cisplatin | PR |
| ALDH9A1 | SNV | Missense_Mutation | | c.157G>C | p.Glu53Gln | p.E53Q | P49189 | protein_coding | tolerated(0.65) | benign(0.268) | TCGA-Q1-A73O-01 | Cervix | cervical & endocervical cancer | Female | <65 | I/II | Chemotherapy | cisplatin | CR |
| ALDH9A1 | SNV | Missense_Mutation | rs755173841 | c.967N>C | p.Glu323Gln | p.E323Q | P49189 | protein_coding | tolerated(0.1) | benign(0.157) | TCGA-ZJ-AAXU-01 | Cervix | cervical & endocervical cancer | Female | <65 | I/II | Unknown | Unknown | SD |
| ALDH9A1 | SNV | Missense_Mutation | | c.1245N>T | p.Glu415Asp | p.E415D | P49189 | protein_coding | deleterious(0) | possibly_damaging(0.829) | TCGA-AA-A010-01 | Colorectum | colon adenocarcinoma | Female | <65 | I/II | Chemotherapy | folinic | CR |


