
|
|||||
|
 | |
| |
| |
| |
| |
| |
|
Gene: ALDH5A1 |
Gene summary for ALDH5A1 |
| Gene information | Species | Human | Gene symbol | ALDH5A1 | Gene ID | 7915 |
| Gene name | aldehyde dehydrogenase 5 family member A1 | |
| Gene Alias | SSADH | |
| Cytomap | 6p22.3 | |
| Gene Type | protein-coding | GO ID | GO:0001505 | UniProtAcc | P51649 |
Top |
Malignant transformation analysis |
| Identification of the aberrant gene expression in precancerous and cancerous lesions by comparing the gene expression of stem-like cells in diseased tissues with normal stem cells |
| Entrez ID | Symbol | Replicates | Species | Organ | Tissue | Adj P-value | Log2FC | Malignancy |
| 7915 | ALDH5A1 | LZE24T | Human | Esophagus | ESCC | 1.23e-05 | 9.34e-02 | 0.0596 |
| 7915 | ALDH5A1 | P1T-E | Human | Esophagus | ESCC | 2.36e-02 | 2.28e-01 | 0.0875 |
| 7915 | ALDH5A1 | P2T-E | Human | Esophagus | ESCC | 1.53e-19 | 3.82e-01 | 0.1177 |
| 7915 | ALDH5A1 | P4T-E | Human | Esophagus | ESCC | 3.16e-13 | 2.16e-01 | 0.1323 |
| 7915 | ALDH5A1 | P8T-E | Human | Esophagus | ESCC | 2.02e-06 | 1.29e-01 | 0.0889 |
| 7915 | ALDH5A1 | P9T-E | Human | Esophagus | ESCC | 1.20e-02 | 8.11e-02 | 0.1131 |
| 7915 | ALDH5A1 | P11T-E | Human | Esophagus | ESCC | 2.01e-02 | 1.65e-01 | 0.1426 |
| 7915 | ALDH5A1 | P12T-E | Human | Esophagus | ESCC | 4.40e-09 | 1.90e-01 | 0.1122 |
| 7915 | ALDH5A1 | P15T-E | Human | Esophagus | ESCC | 4.40e-02 | 8.02e-02 | 0.1149 |
| 7915 | ALDH5A1 | P16T-E | Human | Esophagus | ESCC | 9.02e-11 | 1.86e-01 | 0.1153 |
| 7915 | ALDH5A1 | P20T-E | Human | Esophagus | ESCC | 5.46e-05 | 1.33e-01 | 0.1124 |
| 7915 | ALDH5A1 | P22T-E | Human | Esophagus | ESCC | 5.95e-29 | 4.59e-01 | 0.1236 |
| 7915 | ALDH5A1 | P23T-E | Human | Esophagus | ESCC | 1.04e-09 | 2.71e-01 | 0.108 |
| 7915 | ALDH5A1 | P26T-E | Human | Esophagus | ESCC | 1.88e-04 | 1.16e-01 | 0.1276 |
| 7915 | ALDH5A1 | P27T-E | Human | Esophagus | ESCC | 1.13e-16 | 2.91e-01 | 0.1055 |
| 7915 | ALDH5A1 | P28T-E | Human | Esophagus | ESCC | 5.00e-17 | 2.65e-01 | 0.1149 |
| 7915 | ALDH5A1 | P30T-E | Human | Esophagus | ESCC | 2.43e-17 | 5.35e-01 | 0.137 |
| 7915 | ALDH5A1 | P36T-E | Human | Esophagus | ESCC | 5.38e-06 | 1.26e-01 | 0.1187 |
| 7915 | ALDH5A1 | P38T-E | Human | Esophagus | ESCC | 2.79e-04 | 1.78e-01 | 0.127 |
| 7915 | ALDH5A1 | P42T-E | Human | Esophagus | ESCC | 1.15e-02 | 1.13e-01 | 0.1175 |
| Page: 1 2 3 |
| Tissue | Expression Dynamics | Abbreviation |
| Esophagus | 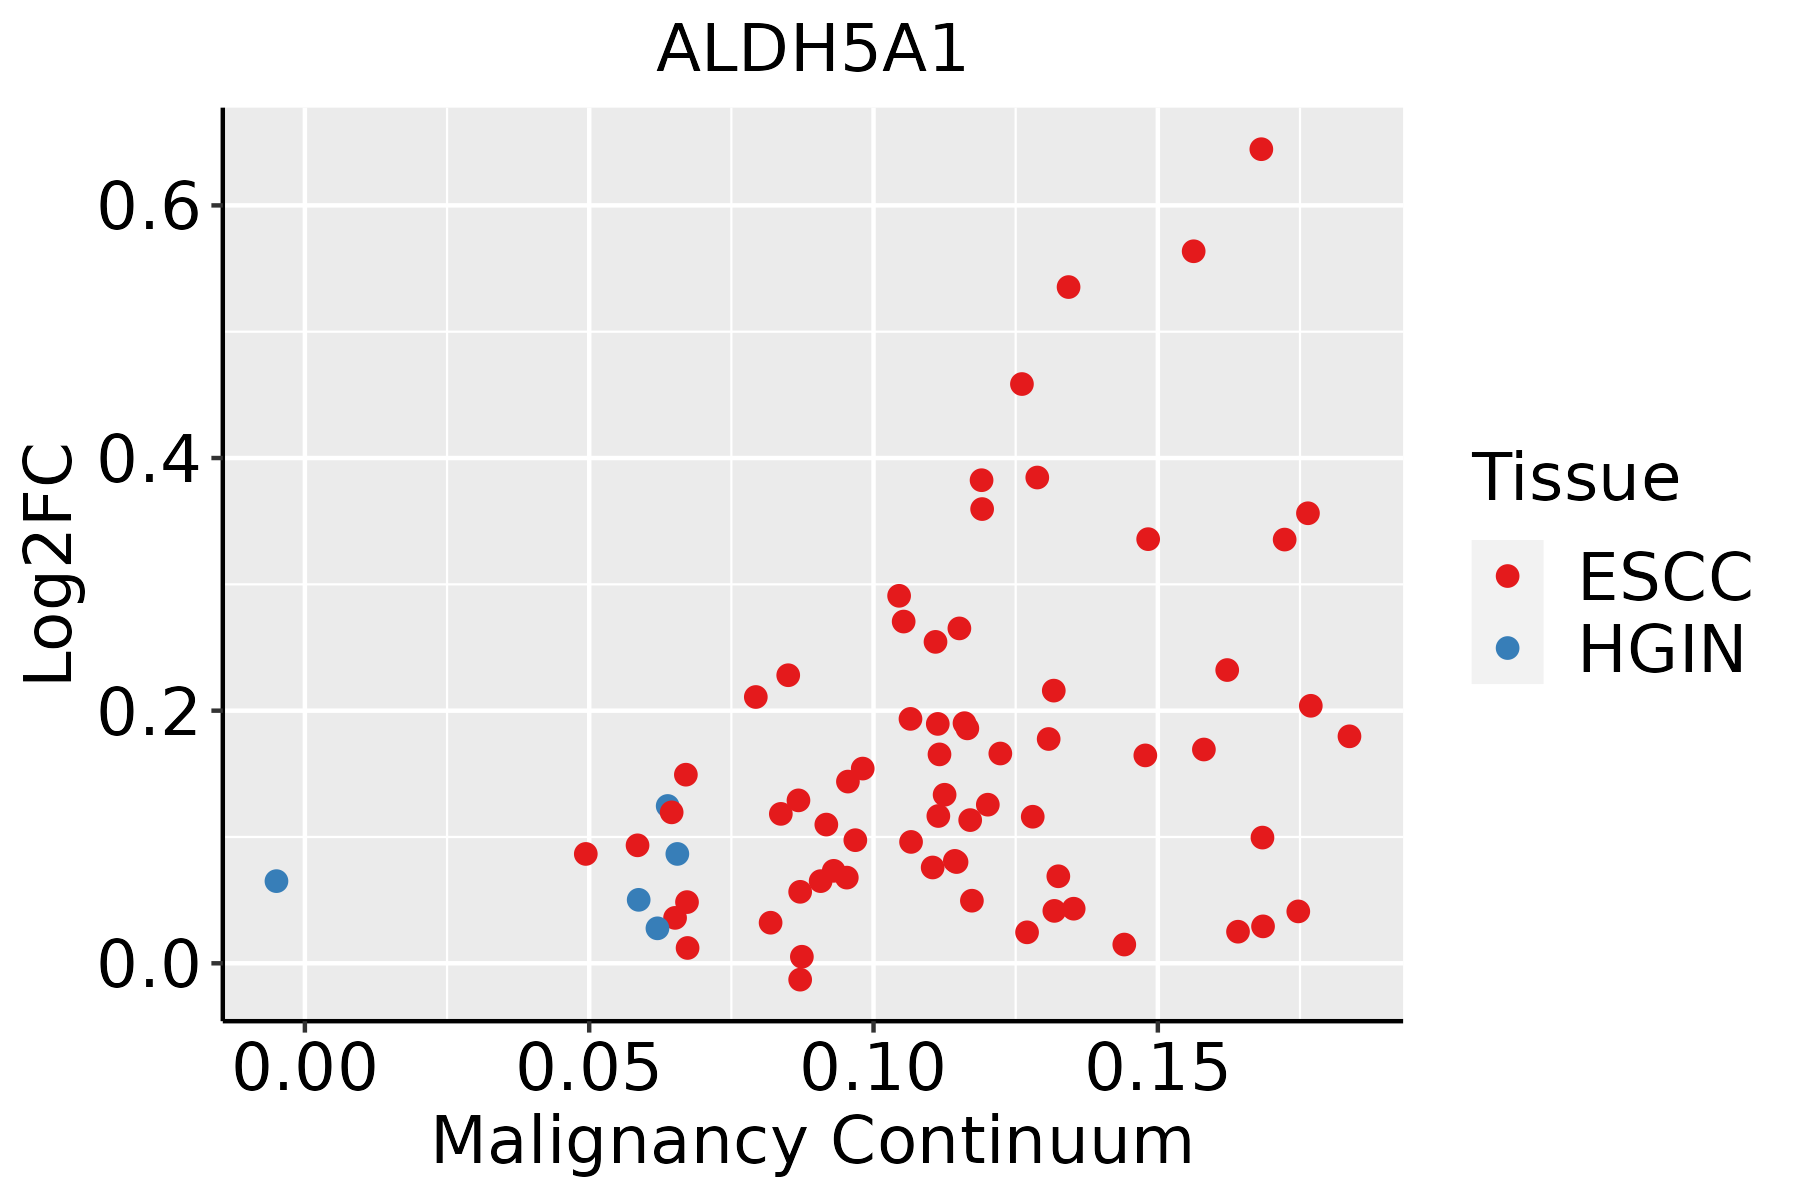 | ESCC: Esophageal squamous cell carcinoma |
| HGIN: High-grade intraepithelial neoplasias | ||
| LGIN: Low-grade intraepithelial neoplasias | ||
| Liver | 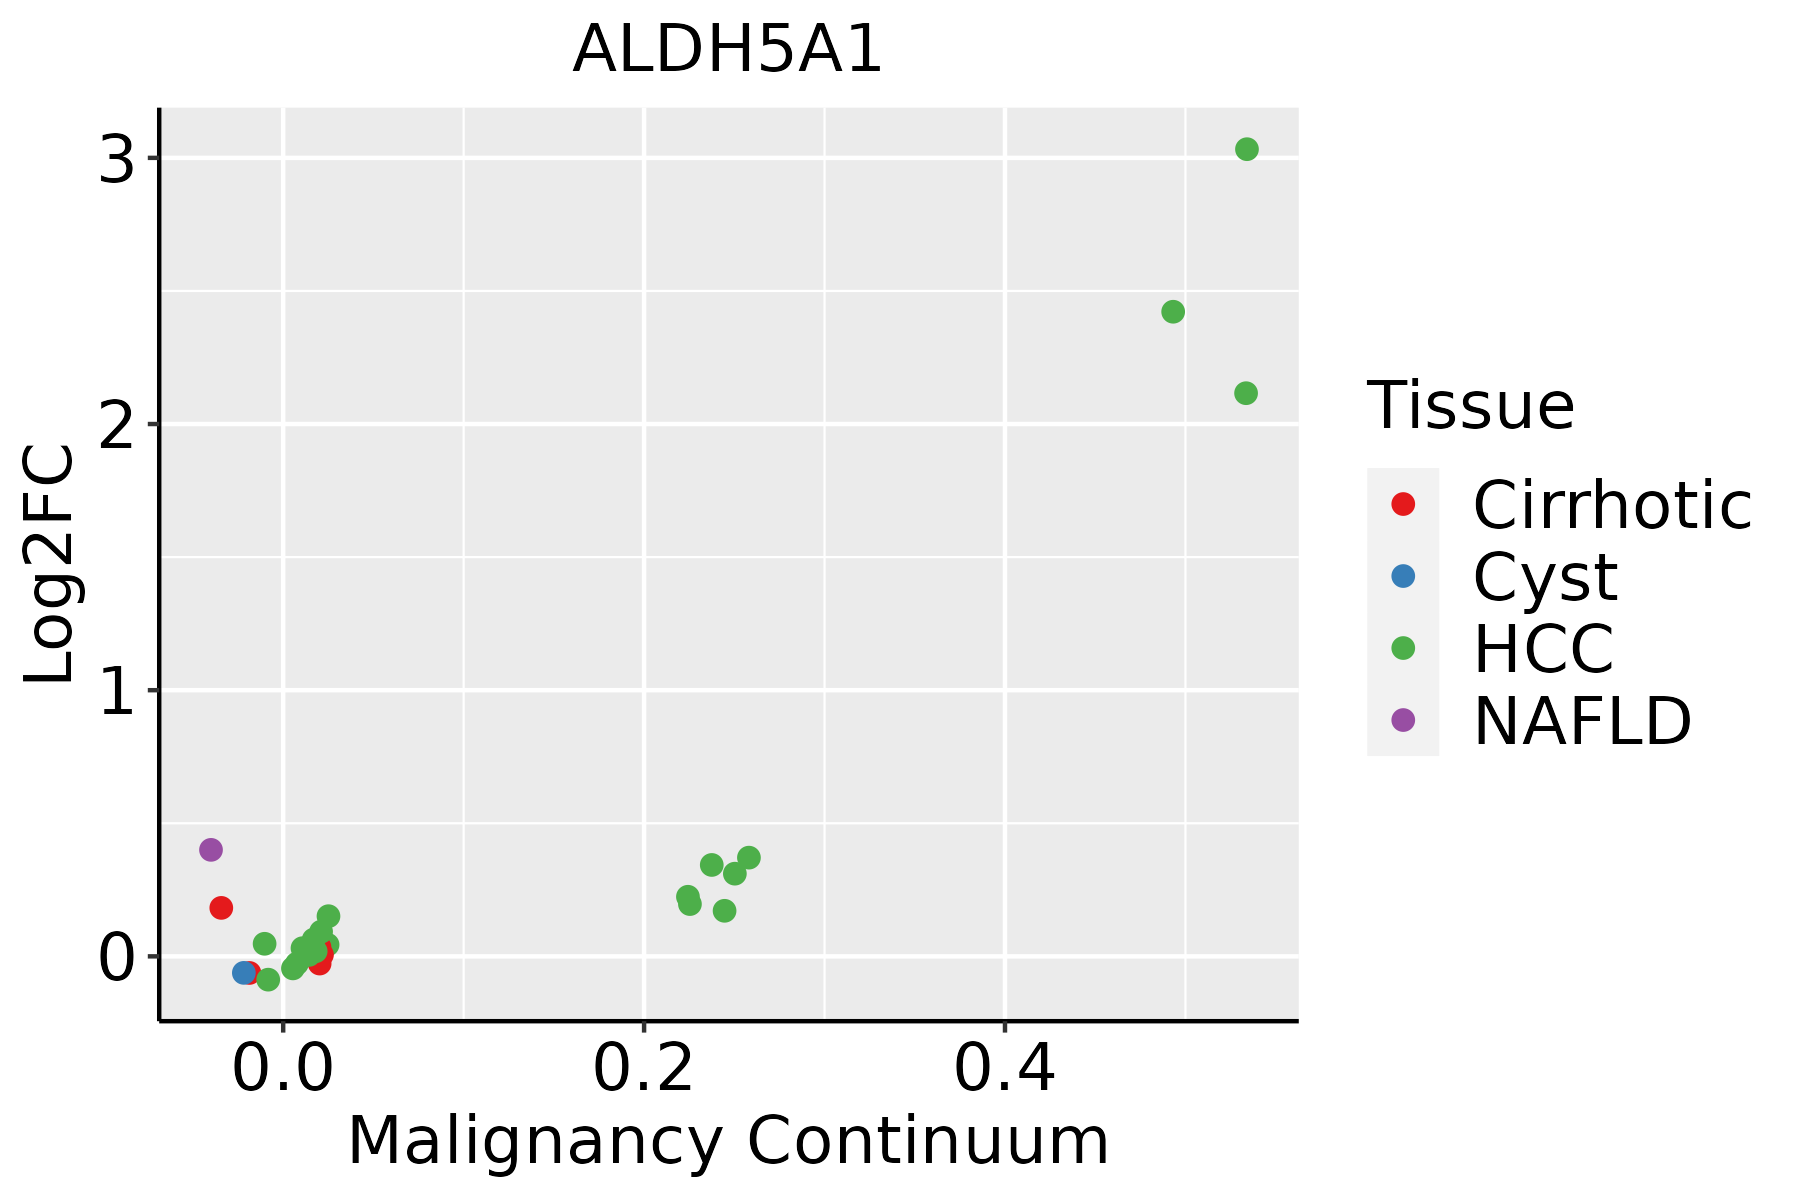 | HCC: Hepatocellular carcinoma |
| NAFLD: Non-alcoholic fatty liver disease |
| ∗log2FC in expression of this searched gene in stem-like cells from each diseased tissue sample relative to stem-like cells in normal samples in each tissue plotted against the malignancy continuum. Samples are colored based on if they are from different disease stage. |
Top |
Malignant transformation related pathway analysis |
| Find out the enriched GO biological processes and KEGG pathways involved in transition from healthy to precancer to cancer |
| Tissue | Disease Stage | Enriched GO biological Processes |
| Colorectum | AD |  |
| Colorectum | SER |  |
| Colorectum | MSS |  |
| Colorectum | MSI-H |  |
| Colorectum | FAP |  |
| ∗Top 15 enriched GO BP terms are showed in the bar plot of each disease state in each tissue. Each row represents a significant GO biological process which is colored according to the -log10(p.adjust). |
| Page: 1 2 3 4 5 6 7 8 9 |
| GO ID | Tissue | Disease Stage | Description | Gene Ratio | Bg Ratio | pvalue | p.adjust | Count |
| GO:00097919 | Esophagus | ESCC | post-embryonic development | 56/8552 | 80/18723 | 9.08e-06 | 8.71e-05 | 56 |
| GO:00442827 | Esophagus | ESCC | small molecule catabolic process | 201/8552 | 376/18723 | 1.35e-03 | 6.41e-03 | 201 |
| GO:00436485 | Esophagus | ESCC | dicarboxylic acid metabolic process | 58/8552 | 96/18723 | 2.55e-03 | 1.09e-02 | 58 |
| GO:00463953 | Liver | NAFLD | carboxylic acid catabolic process | 73/1882 | 236/18723 | 4.16e-19 | 1.22e-15 | 73 |
| GO:00160544 | Liver | NAFLD | organic acid catabolic process | 73/1882 | 240/18723 | 1.20e-18 | 2.34e-15 | 73 |
| GO:00442825 | Liver | NAFLD | small molecule catabolic process | 91/1882 | 376/18723 | 8.96e-16 | 1.31e-12 | 91 |
| GO:0009063 | Liver | NAFLD | cellular amino acid catabolic process | 36/1882 | 110/18723 | 6.56e-11 | 1.99e-08 | 36 |
| GO:00065203 | Liver | NAFLD | cellular amino acid metabolic process | 63/1882 | 284/18723 | 1.14e-09 | 2.17e-07 | 63 |
| GO:19016053 | Liver | NAFLD | alpha-amino acid metabolic process | 46/1882 | 195/18723 | 2.74e-08 | 2.86e-06 | 46 |
| GO:00436483 | Liver | NAFLD | dicarboxylic acid metabolic process | 22/1882 | 96/18723 | 1.73e-04 | 3.08e-03 | 22 |
| GO:004428221 | Liver | HCC | small molecule catabolic process | 225/7958 | 376/18723 | 6.50e-12 | 2.80e-10 | 225 |
| GO:001605421 | Liver | HCC | organic acid catabolic process | 152/7958 | 240/18723 | 5.11e-11 | 1.92e-09 | 152 |
| GO:00463952 | Liver | HCC | carboxylic acid catabolic process | 149/7958 | 236/18723 | 1.11e-10 | 3.87e-09 | 149 |
| GO:19016052 | Liver | HCC | alpha-amino acid metabolic process | 124/7958 | 195/18723 | 2.07e-09 | 5.79e-08 | 124 |
| GO:00436482 | Liver | HCC | dicarboxylic acid metabolic process | 68/7958 | 96/18723 | 1.73e-08 | 4.14e-07 | 68 |
| GO:00065202 | Liver | HCC | cellular amino acid metabolic process | 167/7958 | 284/18723 | 1.91e-08 | 4.56e-07 | 167 |
| GO:00090632 | Liver | HCC | cellular amino acid catabolic process | 70/7958 | 110/18723 | 6.12e-06 | 7.52e-05 | 70 |
| GO:0009064 | Liver | HCC | glutamine family amino acid metabolic process | 47/7958 | 78/18723 | 1.17e-03 | 6.54e-03 | 47 |
| GO:0006536 | Liver | HCC | glutamate metabolic process | 21/7958 | 33/18723 | 1.16e-02 | 4.28e-02 | 21 |
| Page: 1 |
| Pathway ID | Tissue | Disease Stage | Description | Gene Ratio | Bg Ratio | pvalue | p.adjust | qvalue | Count |
| hsa00650 | Liver | NAFLD | Butanoate metabolism | 11/1043 | 27/8465 | 1.88e-04 | 3.62e-03 | 2.92e-03 | 11 |
| hsa006501 | Liver | NAFLD | Butanoate metabolism | 11/1043 | 27/8465 | 1.88e-04 | 3.62e-03 | 2.92e-03 | 11 |
| hsa006504 | Liver | HCC | Butanoate metabolism | 19/4020 | 27/8465 | 1.37e-02 | 3.33e-02 | 1.85e-02 | 19 |
| hsa006505 | Liver | HCC | Butanoate metabolism | 19/4020 | 27/8465 | 1.37e-02 | 3.33e-02 | 1.85e-02 | 19 |
| Page: 1 |
Top |
Cell-cell communication analysis |
| Identification of potential cell-cell interactions between two cell types and their ligand-receptor pairs for different disease states |
| Ligand | Receptor | LRpair | Pathway | Tissue | Disease Stage |
| Page: 1 |
Top |
Single-cell gene regulatory network inference analysis |
| Find out the significant the regulons (TFs) and the target genes of each regulon across cell types for different disease states |
| TF | Cell Type | Tissue | Disease Stage | Target Gene | RSS | Regulon Activity |
| ∗The dot plots of a searched regulon are shown for all cell subpopulations in each disease state of each tissue based on the regulon specific score inferred using pySCENIC and by calculating the average expression. |
| Page: 1 |
Top |
Somatic mutation of malignant transformation related genes |
| Annotation of somatic variants for genes involved in malignant transformation |
| Hugo Symbol | Variant Class | Variant Classification | dbSNP RS | HGVSc | HGVSp | HGVSp Short | SWISSPROT | BIOTYPE | SIFT | PolyPhen | Tumor Sample Barcode | Tissue | Histology | Sex | Age | Stage | Therapy Types | Drugs | Outcome |
| ALDH5A1 | SNV | Missense_Mutation | novel | c.674N>A | p.Val225Asp | p.V225D | P51649 | protein_coding | deleterious(0) | possibly_damaging(0.884) | TCGA-AC-A6IW-01 | Breast | breast invasive carcinoma | Female | >=65 | I/II | Unknown | Unknown | SD |
| ALDH5A1 | SNV | Missense_Mutation | rs768957232 | c.1420N>A | p.Ala474Thr | p.A474T | P51649 | protein_coding | deleterious(0.03) | benign(0.087) | TCGA-AN-A0AK-01 | Breast | breast invasive carcinoma | Female | >=65 | I/II | Unknown | Unknown | SD |
| ALDH5A1 | SNV | Missense_Mutation | c.396A>G | p.Ile132Met | p.I132M | P51649 | protein_coding | tolerated(1) | benign(0.011) | TCGA-BH-A0HA-01 | Breast | breast invasive carcinoma | Female | <65 | I/II | Unknown | Unknown | SD | |
| ALDH5A1 | SNV | Missense_Mutation | novel | c.1478N>A | p.Arg493Lys | p.R493K | P51649 | protein_coding | deleterious(0.03) | probably_damaging(0.996) | TCGA-D8-A27T-01 | Breast | breast invasive carcinoma | Female | <65 | III/IV | Chemotherapy | doxorubicine+cyclophosphamide | SD |
| ALDH5A1 | SNV | Missense_Mutation | c.872N>T | p.Ser291Phe | p.S291F | P51649 | protein_coding | deleterious(0) | possibly_damaging(0.809) | TCGA-EK-A3GK-01 | Cervix | cervical & endocervical cancer | Female | <65 | I/II | Unknown | Unknown | SD | |
| ALDH5A1 | SNV | Missense_Mutation | novel | c.1639N>A | p.Gly547Ser | p.G547S | P51649 | protein_coding | deleterious(0.03) | possibly_damaging(0.595) | TCGA-MY-A913-01 | Cervix | cervical & endocervical cancer | Female | <65 | I/II | Chemotherapy | cisplatin | CR |
| ALDH5A1 | SNV | Missense_Mutation | c.363T>G | p.Ser121Arg | p.S121R | P51649 | protein_coding | deleterious(0) | probably_damaging(0.988) | TCGA-AA-A00N-01 | Colorectum | colon adenocarcinoma | Male | >=65 | I/II | Unknown | Unknown | PD | |
| ALDH5A1 | SNV | Missense_Mutation | c.1212G>T | p.Lys404Asn | p.K404N | P51649 | protein_coding | deleterious(0.01) | probably_damaging(0.999) | TCGA-AA-A01S-01 | Colorectum | colon adenocarcinoma | Female | <65 | III/IV | Unknown | Unknown | SD | |
| ALDH5A1 | SNV | Missense_Mutation | rs754091433 | c.1147N>A | p.Val383Ile | p.V383I | P51649 | protein_coding | tolerated(0.14) | benign(0.006) | TCGA-AD-A5EJ-01 | Colorectum | colon adenocarcinoma | Female | >=65 | I/II | Unknown | Unknown | SD |
| ALDH5A1 | SNV | Missense_Mutation | c.409N>T | p.Asp137Tyr | p.D137Y | P51649 | protein_coding | deleterious(0.01) | probably_damaging(0.934) | TCGA-AZ-4315-01 | Colorectum | colon adenocarcinoma | Male | <65 | I/II | Unknown | Unknown | SD |
| Page: 1 2 3 4 5 6 |
Top |
Related drugs of malignant transformation related genes |
| Identification of chemicals and drugs interact with genes involved in malignant transfromation |
| (DGIdb 4.0) |
| Entrez ID | Symbol | Category | Interaction Types | Drug Claim Name | Drug Name | PMIDs |
| 7915 | ALDH5A1 | DRUGGABLE GENOME, ENZYME | inhibitor | CHEMBL433 | VALPROATE SODIUM | |
| 7915 | ALDH5A1 | DRUGGABLE GENOME, ENZYME | methadone | METHADONE | 24230997 | |
| 7915 | ALDH5A1 | DRUGGABLE GENOME, ENZYME | valproic acid | 23407051 | ||
| 7915 | ALDH5A1 | DRUGGABLE GENOME, ENZYME | T83193 | |||
| 7915 | ALDH5A1 | DRUGGABLE GENOME, ENZYME | inhibitor | CHEMBL2105613 | DIVALPROEX SODIUM | |
| 7915 | ALDH5A1 | DRUGGABLE GENOME, ENZYME | VALPROIC ACID | VALPROIC ACID | 11086726 | |
| 7915 | ALDH5A1 | DRUGGABLE GENOME, ENZYME | inhibitor | 252827498 | CHEMBL378577 | |
| 7915 | ALDH5A1 | DRUGGABLE GENOME, ENZYME | Succinic acid | |||
| 7915 | ALDH5A1 | DRUGGABLE GENOME, ENZYME | Chlormerodrin | CHLORMERODRIN | ||
| 7915 | ALDH5A1 | DRUGGABLE GENOME, ENZYME | inhibitor | CHEMBL109 | VALPROIC ACID |
| Page: 1 |

Copyright 2023-Present -The University of Texas Health Science Center at Houston |