
|
|||||
|
 | |
| |
| |
| |
| |
| |
|
Gene: ALDH4A1 |
Gene summary for ALDH4A1 |
| Gene information | Species | Human | Gene symbol | ALDH4A1 | Gene ID | 8659 |
| Gene name | aldehyde dehydrogenase 4 family member A1 | |
| Gene Alias | ALDH4 | |
| Cytomap | 1p36.13 | |
| Gene Type | protein-coding | GO ID | GO:0006082 | UniProtAcc | P30038 |
Top |
Malignant transformation analysis |
| Identification of the aberrant gene expression in precancerous and cancerous lesions by comparing the gene expression of stem-like cells in diseased tissues with normal stem cells |
| Entrez ID | Symbol | Replicates | Species | Organ | Tissue | Adj P-value | Log2FC | Malignancy |
| 8659 | ALDH4A1 | HTA11_1938_2000001011 | Human | Colorectum | AD | 1.67e-02 | 1.51e-01 | -0.0811 |
| 8659 | ALDH4A1 | HTA11_696_2000001011 | Human | Colorectum | AD | 1.92e-04 | 1.31e-01 | -0.1464 |
| 8659 | ALDH4A1 | HTA11_1391_2000001011 | Human | Colorectum | AD | 3.47e-06 | 2.13e-01 | -0.059 |
| 8659 | ALDH4A1 | HTA11_546_2000001011 | Human | Colorectum | AD | 7.78e-03 | 1.68e-01 | -0.0842 |
| 8659 | ALDH4A1 | HTA11_866_3004761011 | Human | Colorectum | AD | 3.84e-05 | 1.42e-01 | 0.096 |
| 8659 | ALDH4A1 | HTA11_7663_2000001011 | Human | Colorectum | SER | 6.81e-04 | 2.31e-01 | 0.0131 |
| 8659 | ALDH4A1 | HTA11_10711_2000001011 | Human | Colorectum | AD | 4.64e-04 | 1.54e-01 | 0.0338 |
| 8659 | ALDH4A1 | HTA11_7696_3000711011 | Human | Colorectum | AD | 1.73e-12 | 2.65e-01 | 0.0674 |
| 8659 | ALDH4A1 | HTA11_99999970781_79442 | Human | Colorectum | MSS | 3.80e-25 | 5.06e-01 | 0.294 |
| 8659 | ALDH4A1 | HTA11_99999965104_69814 | Human | Colorectum | MSS | 3.26e-04 | 1.69e-01 | 0.281 |
| 8659 | ALDH4A1 | HTA11_99999971662_82457 | Human | Colorectum | MSS | 2.14e-33 | 7.34e-01 | 0.3859 |
| 8659 | ALDH4A1 | HTA11_99999974143_84620 | Human | Colorectum | MSS | 3.80e-25 | 5.64e-01 | 0.3005 |
| 8659 | ALDH4A1 | P2T-E | Human | Esophagus | ESCC | 1.79e-10 | 1.36e-01 | 0.1177 |
| 8659 | ALDH4A1 | P4T-E | Human | Esophagus | ESCC | 9.51e-14 | 2.01e-01 | 0.1323 |
| 8659 | ALDH4A1 | P10T-E | Human | Esophagus | ESCC | 1.41e-08 | 1.54e-01 | 0.116 |
| 8659 | ALDH4A1 | P11T-E | Human | Esophagus | ESCC | 4.93e-08 | 3.13e-01 | 0.1426 |
| 8659 | ALDH4A1 | P12T-E | Human | Esophagus | ESCC | 4.08e-06 | 6.66e-02 | 0.1122 |
| 8659 | ALDH4A1 | P15T-E | Human | Esophagus | ESCC | 1.82e-08 | 1.69e-01 | 0.1149 |
| 8659 | ALDH4A1 | P16T-E | Human | Esophagus | ESCC | 3.30e-12 | 5.02e-02 | 0.1153 |
| 8659 | ALDH4A1 | P20T-E | Human | Esophagus | ESCC | 1.71e-03 | 1.47e-01 | 0.1124 |
| Page: 1 2 3 4 5 |
| Tissue | Expression Dynamics | Abbreviation |
| Colorectum (GSE201348) |  | FAP: Familial adenomatous polyposis |
| CRC: Colorectal cancer | ||
| Colorectum (HTA11) |  | AD: Adenomas |
| SER: Sessile serrated lesions | ||
| MSI-H: Microsatellite-high colorectal cancer | ||
| MSS: Microsatellite stable colorectal cancer | ||
| Esophagus | 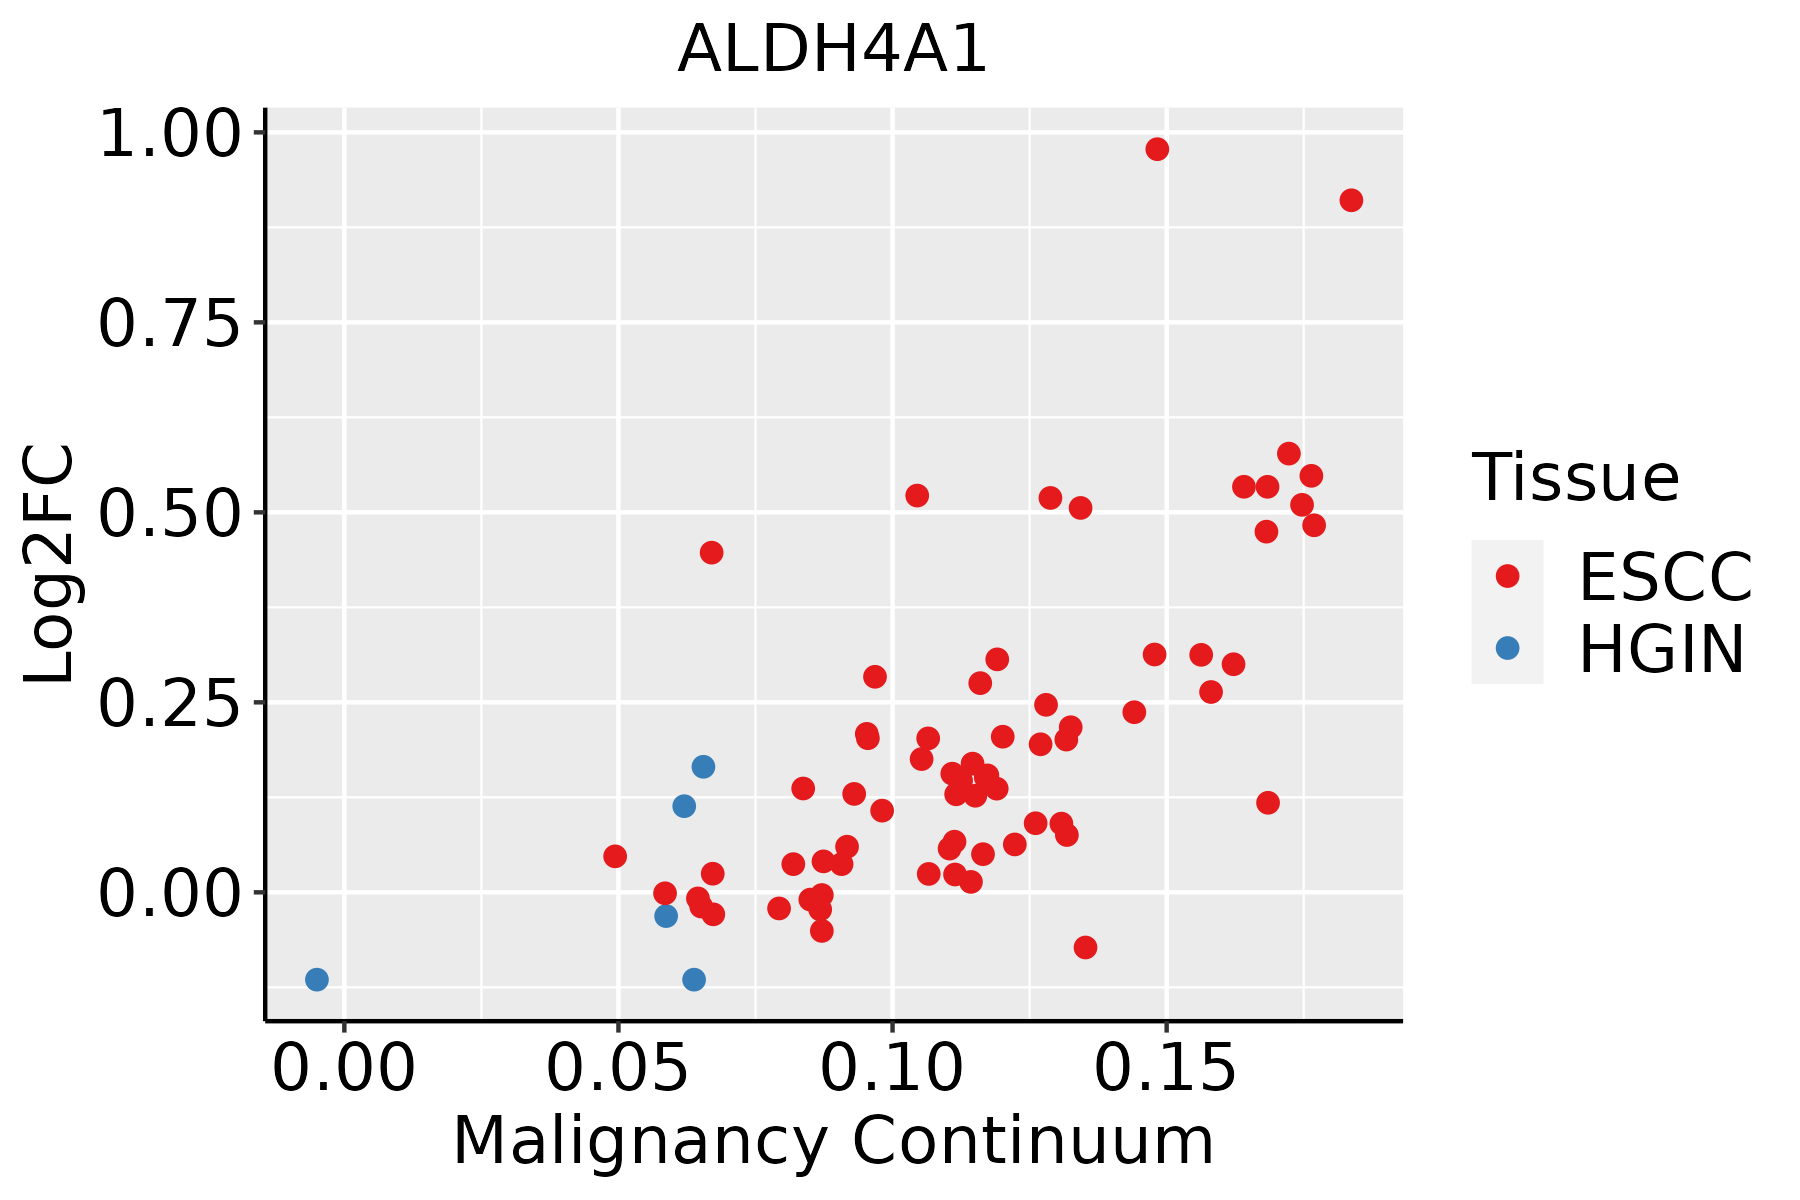 | ESCC: Esophageal squamous cell carcinoma |
| HGIN: High-grade intraepithelial neoplasias | ||
| LGIN: Low-grade intraepithelial neoplasias | ||
| Liver | 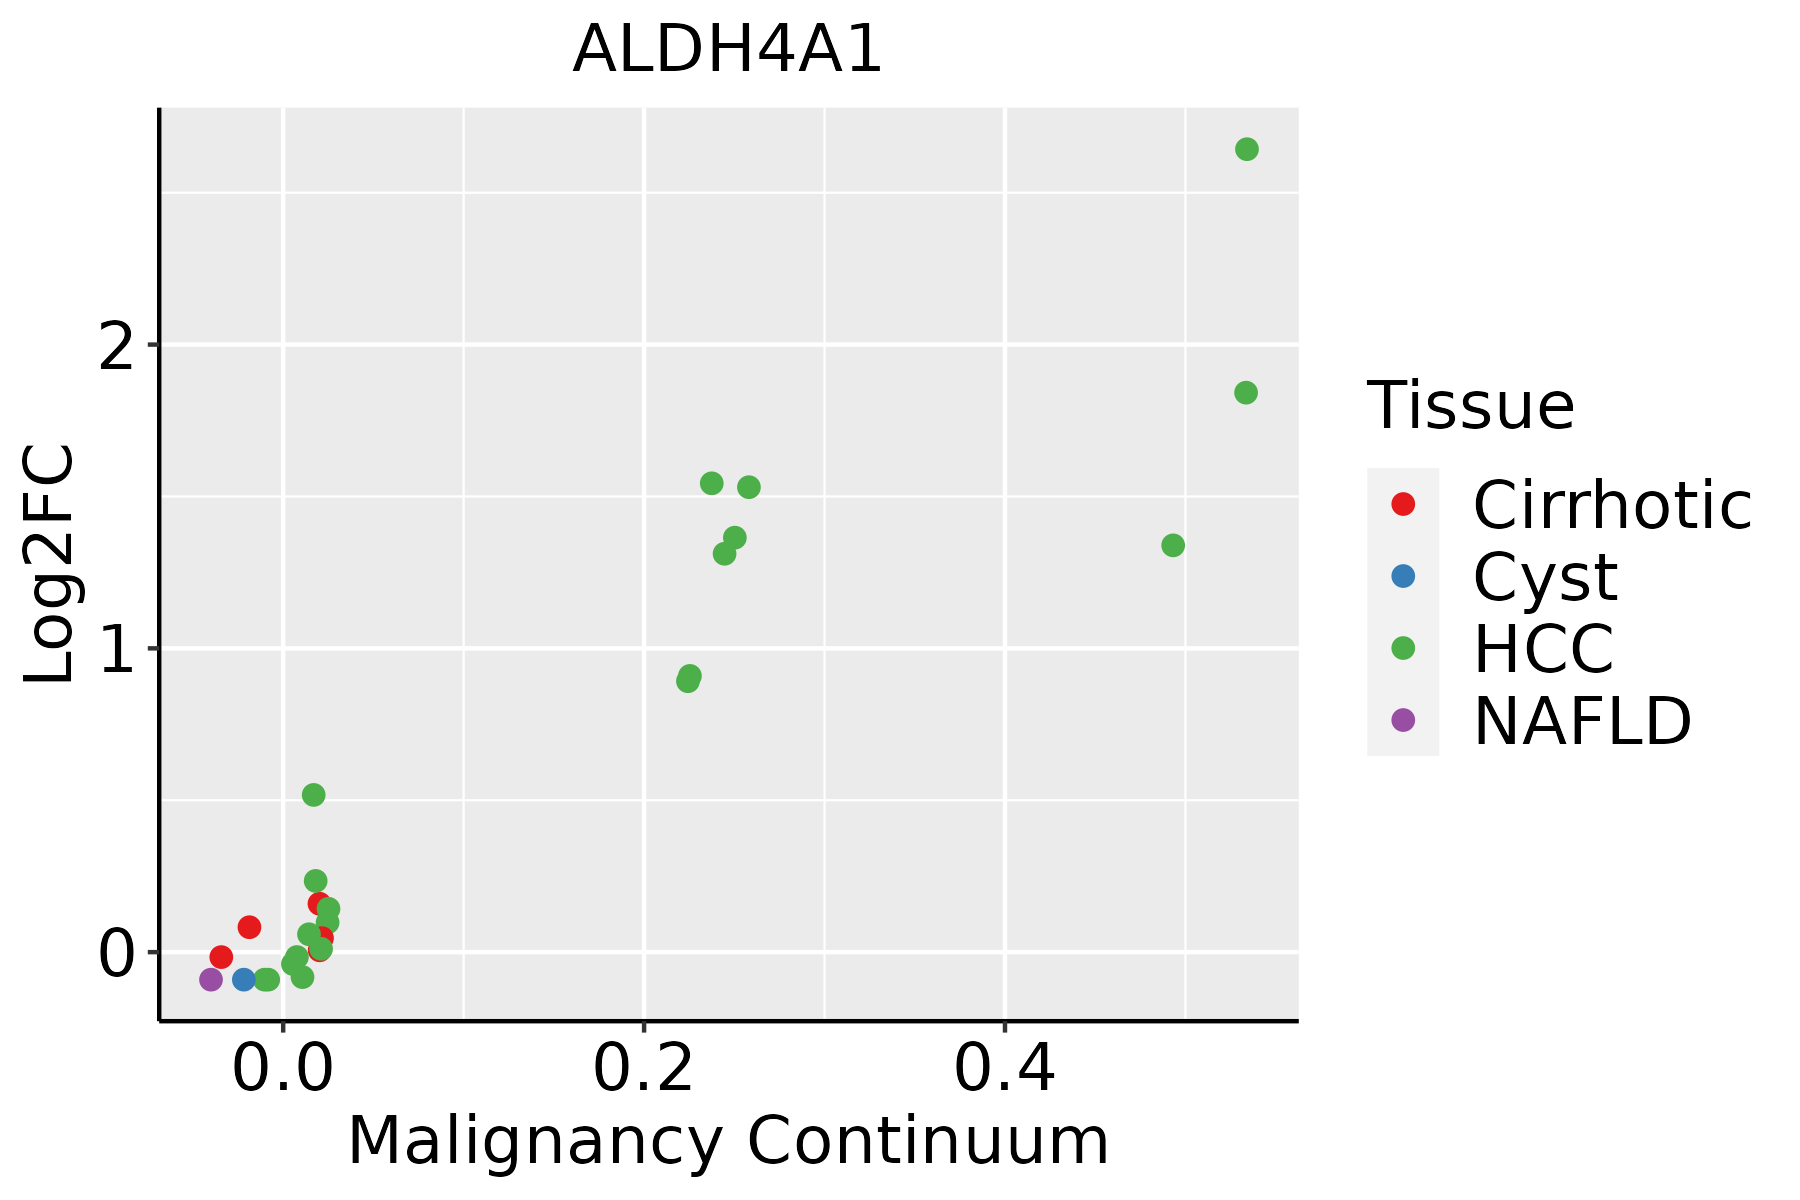 | HCC: Hepatocellular carcinoma |
| NAFLD: Non-alcoholic fatty liver disease | ||
| Oral Cavity |  | EOLP: Erosive Oral lichen planus |
| LP: leukoplakia | ||
| NEOLP: Non-erosive oral lichen planus | ||
| OSCC: Oral squamous cell carcinoma | ||
| Skin | 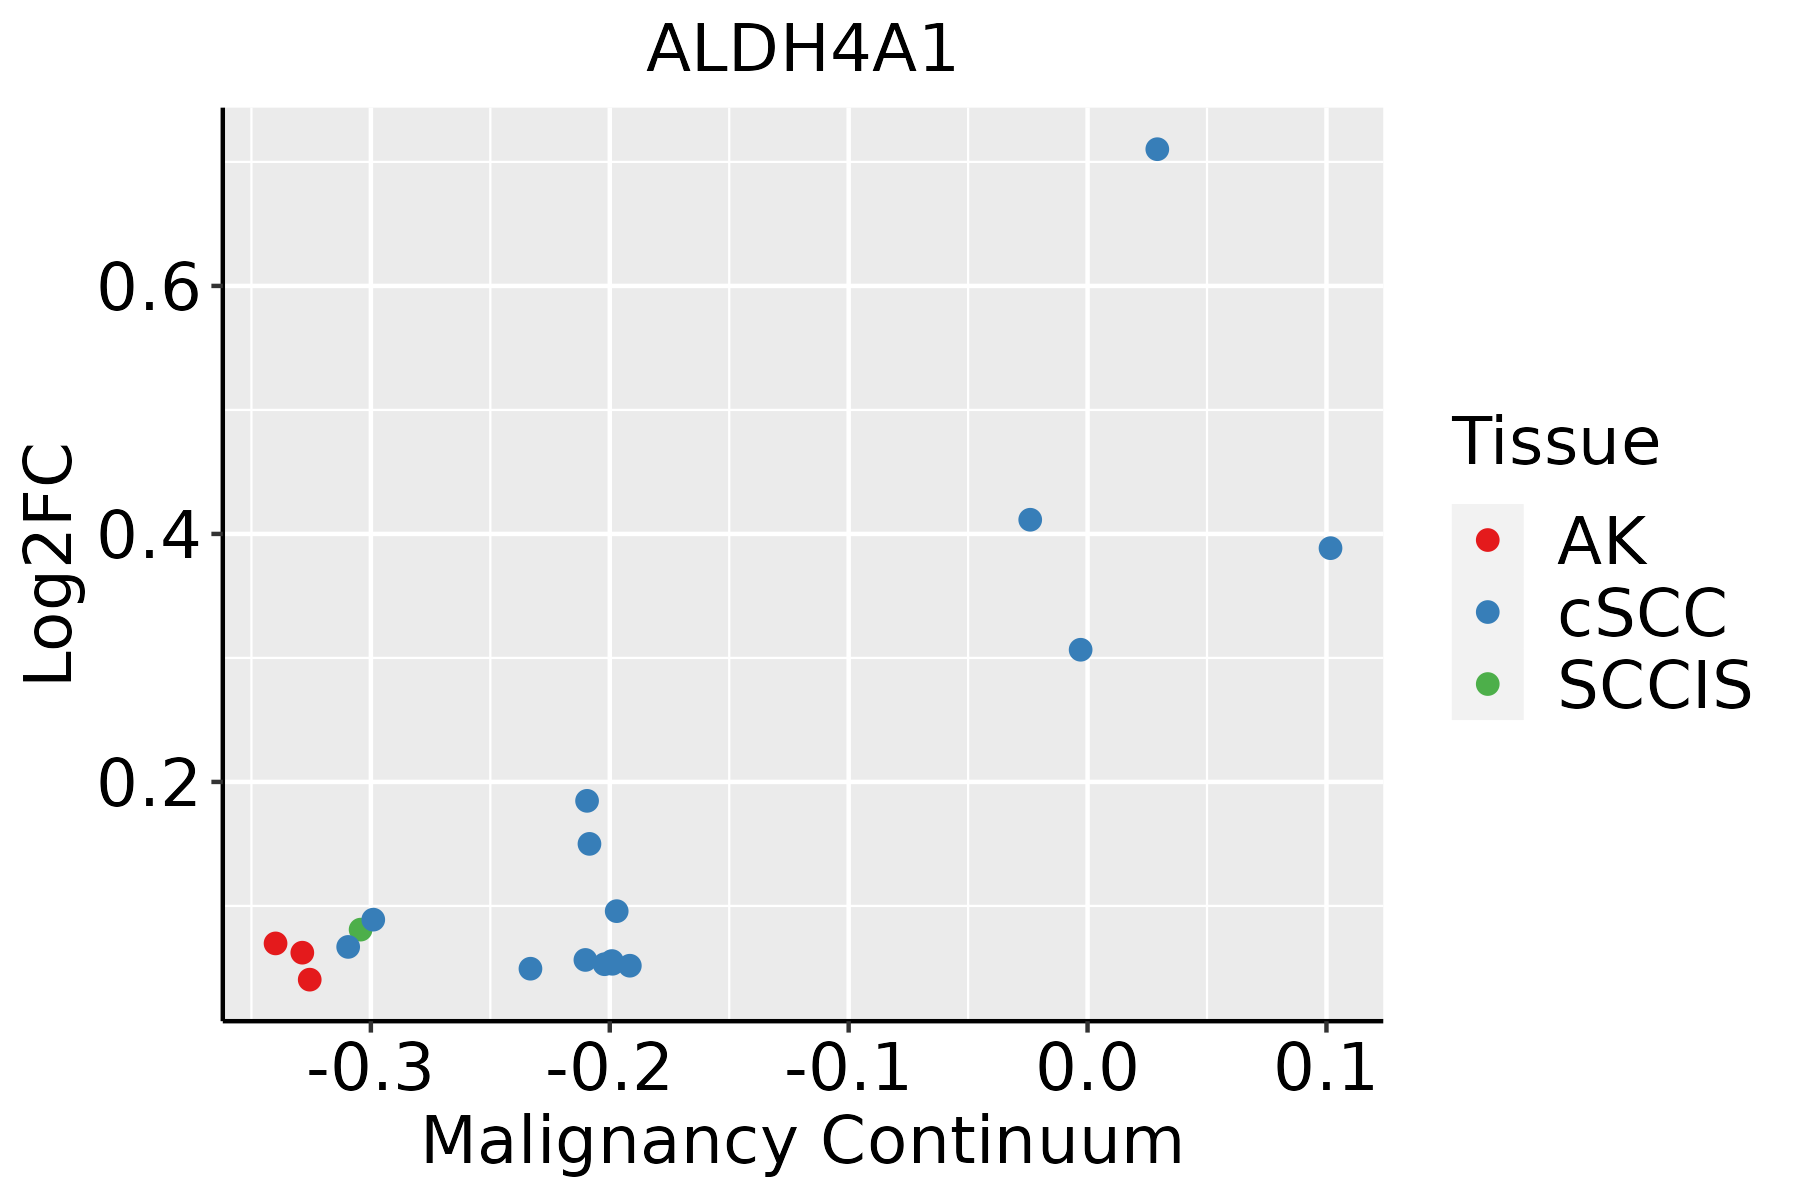 | AK: Actinic keratosis |
| cSCC: Cutaneous squamous cell carcinoma | ||
| SCCIS:squamous cell carcinoma in situ |
| ∗log2FC in expression of this searched gene in stem-like cells from each diseased tissue sample relative to stem-like cells in normal samples in each tissue plotted against the malignancy continuum. Samples are colored based on if they are from different disease stage. |
Top |
Malignant transformation related pathway analysis |
| Find out the enriched GO biological processes and KEGG pathways involved in transition from healthy to precancer to cancer |
| Tissue | Disease Stage | Enriched GO biological Processes |
| Colorectum | AD |  |
| Colorectum | SER |  |
| Colorectum | MSS |  |
| Colorectum | MSI-H |  |
| Colorectum | FAP |  |
| ∗Top 15 enriched GO BP terms are showed in the bar plot of each disease state in each tissue. Each row represents a significant GO biological process which is colored according to the -log10(p.adjust). |
| Page: 1 2 3 4 5 6 7 8 9 |
| GO ID | Tissue | Disease Stage | Description | Gene Ratio | Bg Ratio | pvalue | p.adjust | Count |
| GO:0006091 | Colorectum | AD | generation of precursor metabolites and energy | 209/3918 | 490/18723 | 3.17e-28 | 6.61e-25 | 209 |
| GO:0022900 | Colorectum | AD | electron transport chain | 89/3918 | 175/18723 | 1.42e-18 | 8.91e-16 | 89 |
| GO:0044282 | Colorectum | AD | small molecule catabolic process | 118/3918 | 376/18723 | 1.05e-06 | 3.55e-05 | 118 |
| GO:0016054 | Colorectum | AD | organic acid catabolic process | 73/3918 | 240/18723 | 3.20e-04 | 3.81e-03 | 73 |
| GO:0006575 | Colorectum | AD | cellular modified amino acid metabolic process | 59/3918 | 188/18723 | 4.80e-04 | 5.27e-03 | 59 |
| GO:0043648 | Colorectum | AD | dicarboxylic acid metabolic process | 34/3918 | 96/18723 | 7.22e-04 | 7.28e-03 | 34 |
| GO:0046395 | Colorectum | AD | carboxylic acid catabolic process | 70/3918 | 236/18723 | 9.06e-04 | 8.71e-03 | 70 |
| GO:0006520 | Colorectum | AD | cellular amino acid metabolic process | 81/3918 | 284/18723 | 1.37e-03 | 1.19e-02 | 81 |
| GO:00060911 | Colorectum | SER | generation of precursor metabolites and energy | 168/2897 | 490/18723 | 1.39e-25 | 1.70e-22 | 168 |
| GO:00229001 | Colorectum | SER | electron transport chain | 77/2897 | 175/18723 | 1.77e-19 | 1.36e-16 | 77 |
| GO:00442821 | Colorectum | SER | small molecule catabolic process | 87/2897 | 376/18723 | 5.31e-05 | 1.27e-03 | 87 |
| GO:00160541 | Colorectum | SER | organic acid catabolic process | 53/2897 | 240/18723 | 4.04e-03 | 3.30e-02 | 53 |
| GO:00065201 | Colorectum | SER | cellular amino acid metabolic process | 61/2897 | 284/18723 | 4.20e-03 | 3.41e-02 | 61 |
| GO:00060912 | Colorectum | MSS | generation of precursor metabolites and energy | 186/3467 | 490/18723 | 1.14e-24 | 2.15e-21 | 186 |
| GO:00229002 | Colorectum | MSS | electron transport chain | 83/3467 | 175/18723 | 2.06e-18 | 1.17e-15 | 83 |
| GO:00065751 | Colorectum | MSS | cellular modified amino acid metabolic process | 55/3467 | 188/18723 | 2.16e-04 | 3.01e-03 | 55 |
| GO:00442822 | Colorectum | MSS | small molecule catabolic process | 94/3467 | 376/18723 | 9.85e-04 | 9.86e-03 | 94 |
| GO:00160542 | Colorectum | MSS | organic acid catabolic process | 61/3467 | 240/18723 | 4.72e-03 | 3.31e-02 | 61 |
| GO:0006091110 | Esophagus | ESCC | generation of precursor metabolites and energy | 331/8552 | 490/18723 | 3.86e-23 | 8.45e-21 | 331 |
| GO:0022900110 | Esophagus | ESCC | electron transport chain | 133/8552 | 175/18723 | 2.18e-16 | 1.67e-14 | 133 |
| Page: 1 2 3 |
| Pathway ID | Tissue | Disease Stage | Description | Gene Ratio | Bg Ratio | pvalue | p.adjust | qvalue | Count |
| hsa00330 | Colorectum | AD | Arginine and proline metabolism | 23/2092 | 50/8465 | 8.27e-04 | 5.90e-03 | 3.76e-03 | 23 |
| hsa003301 | Colorectum | AD | Arginine and proline metabolism | 23/2092 | 50/8465 | 8.27e-04 | 5.90e-03 | 3.76e-03 | 23 |
| hsa003302 | Colorectum | SER | Arginine and proline metabolism | 17/1580 | 50/8465 | 7.12e-03 | 3.77e-02 | 2.74e-02 | 17 |
| hsa003303 | Colorectum | SER | Arginine and proline metabolism | 17/1580 | 50/8465 | 7.12e-03 | 3.77e-02 | 2.74e-02 | 17 |
| hsa003304 | Colorectum | MSS | Arginine and proline metabolism | 23/1875 | 50/8465 | 1.52e-04 | 1.24e-03 | 7.61e-04 | 23 |
| hsa003305 | Colorectum | MSS | Arginine and proline metabolism | 23/1875 | 50/8465 | 1.52e-04 | 1.24e-03 | 7.61e-04 | 23 |
| hsa003308 | Liver | Cirrhotic | Arginine and proline metabolism | 25/2530 | 50/8465 | 2.18e-03 | 9.41e-03 | 5.80e-03 | 25 |
| hsa0033011 | Liver | Cirrhotic | Arginine and proline metabolism | 25/2530 | 50/8465 | 2.18e-03 | 9.41e-03 | 5.80e-03 | 25 |
| hsa0033021 | Liver | HCC | Arginine and proline metabolism | 33/4020 | 50/8465 | 6.28e-03 | 1.77e-02 | 9.83e-03 | 33 |
| hsa0033031 | Liver | HCC | Arginine and proline metabolism | 33/4020 | 50/8465 | 6.28e-03 | 1.77e-02 | 9.83e-03 | 33 |
| hsa0033010 | Oral cavity | OSCC | Arginine and proline metabolism | 30/3704 | 50/8465 | 1.50e-02 | 3.26e-02 | 1.66e-02 | 30 |
| hsa0033013 | Oral cavity | OSCC | Arginine and proline metabolism | 30/3704 | 50/8465 | 1.50e-02 | 3.26e-02 | 1.66e-02 | 30 |
| hsa0033023 | Oral cavity | LP | Arginine and proline metabolism | 26/2418 | 50/8465 | 3.94e-04 | 2.08e-03 | 1.34e-03 | 26 |
| hsa0033033 | Oral cavity | LP | Arginine and proline metabolism | 26/2418 | 50/8465 | 3.94e-04 | 2.08e-03 | 1.34e-03 | 26 |
| Page: 1 |
Top |
Cell-cell communication analysis |
| Identification of potential cell-cell interactions between two cell types and their ligand-receptor pairs for different disease states |
| Ligand | Receptor | LRpair | Pathway | Tissue | Disease Stage |
| Page: 1 |
Top |
Single-cell gene regulatory network inference analysis |
| Find out the significant the regulons (TFs) and the target genes of each regulon across cell types for different disease states |
| TF | Cell Type | Tissue | Disease Stage | Target Gene | RSS | Regulon Activity |
| ∗The dot plots of a searched regulon are shown for all cell subpopulations in each disease state of each tissue based on the regulon specific score inferred using pySCENIC and by calculating the average expression. |
| Page: 1 |
Top |
Somatic mutation of malignant transformation related genes |
| Annotation of somatic variants for genes involved in malignant transformation |
| Hugo Symbol | Variant Class | Variant Classification | dbSNP RS | HGVSc | HGVSp | HGVSp Short | SWISSPROT | BIOTYPE | SIFT | PolyPhen | Tumor Sample Barcode | Tissue | Histology | Sex | Age | Stage | Therapy Types | Drugs | Outcome |
| ALDH4A1 | SNV | Missense_Mutation | novel | c.1449N>A | p.Phe483Leu | p.F483L | P30038 | protein_coding | deleterious(0.02) | probably_damaging(0.973) | TCGA-B6-A3ZX-01 | Breast | breast invasive carcinoma | Female | <65 | III/IV | Chemotherapy | cyclophosphamide | PD |
| ALDH4A1 | SNV | Missense_Mutation | novel | c.842N>A | p.Gly281Asp | p.G281D | P30038 | protein_coding | deleterious(0) | probably_damaging(0.991) | TCGA-EA-A410-01 | Cervix | cervical & endocervical cancer | Female | <65 | I/II | Unknown | Unknown | SD |
| ALDH4A1 | SNV | Missense_Mutation | rs142969512 | c.1048N>A | p.Ala350Thr | p.A350T | P30038 | protein_coding | deleterious(0) | probably_damaging(0.918) | TCGA-AA-3811-01 | Colorectum | colon adenocarcinoma | Female | >=65 | III/IV | Unknown | Unknown | PD |
| ALDH4A1 | SNV | Missense_Mutation | c.1469T>C | p.Val490Ala | p.V490A | P30038 | protein_coding | tolerated(0.11) | benign(0.021) | TCGA-AA-3864-01 | Colorectum | colon adenocarcinoma | Male | >=65 | I/II | Unknown | Unknown | SD | |
| ALDH4A1 | SNV | Missense_Mutation | novel | c.214N>A | p.Glu72Lys | p.E72K | P30038 | protein_coding | tolerated(0.1) | benign(0.056) | TCGA-AA-A010-01 | Colorectum | colon adenocarcinoma | Female | <65 | I/II | Chemotherapy | folinic | CR |
| ALDH4A1 | SNV | Missense_Mutation | rs142969512 | c.1048G>A | p.Ala350Thr | p.A350T | P30038 | protein_coding | deleterious(0) | probably_damaging(0.918) | TCGA-AD-6964-01 | Colorectum | colon adenocarcinoma | Male | <65 | III/IV | Chemotherapy | folfox | PD |
| ALDH4A1 | SNV | Missense_Mutation | novel | c.1079N>C | p.Leu360Pro | p.L360P | P30038 | protein_coding | deleterious(0) | probably_damaging(0.987) | TCGA-AZ-6598-01 | Colorectum | colon adenocarcinoma | Female | >=65 | I/II | Unknown | Unknown | SD |
| ALDH4A1 | SNV | Missense_Mutation | rs139487658 | c.370C>T | p.Arg124Trp | p.R124W | P30038 | protein_coding | deleterious(0) | probably_damaging(0.999) | TCGA-AZ-6601-01 | Colorectum | colon adenocarcinoma | Male | >=65 | I/II | Unknown | Unknown | PD |
| ALDH4A1 | insertion | Frame_Shift_Ins | novel | c.569dupC | p.Ser191GlufsTer21 | p.S191Efs*21 | P30038 | protein_coding | TCGA-A6-5661-01 | Colorectum | colon adenocarcinoma | Female | >=65 | I/II | Unknown | Unknown | SD | ||
| ALDH4A1 | SNV | Missense_Mutation | novel | c.650N>A | p.Gly217Asp | p.G217D | P30038 | protein_coding | deleterious(0) | probably_damaging(0.994) | TCGA-A5-A0GW-01 | Endometrium | uterine corpus endometrioid carcinoma | Female | <65 | I/II | Unknown | Unknown | SD |
| Page: 1 2 3 4 5 |
Top |
Related drugs of malignant transformation related genes |
| Identification of chemicals and drugs interact with genes involved in malignant transfromation |
| (DGIdb 4.0) |
| Entrez ID | Symbol | Category | Interaction Types | Drug Claim Name | Drug Name | PMIDs |
| Page: 1 |

Copyright 2023-Present -The University of Texas Health Science Center at Houston |