
|
|||||
|
 | |
| |
| |
| |
| |
| |
|
Gene: ALDH3B2 |
Gene summary for ALDH3B2 |
| Gene information | Species | Human | Gene symbol | ALDH3B2 | Gene ID | 222 |
| Gene name | aldehyde dehydrogenase 3 family member B2 | |
| Gene Alias | ALDH8 | |
| Cytomap | 11q13.2 | |
| Gene Type | protein-coding | GO ID | GO:0006066 | UniProtAcc | NA |
Top |
Malignant transformation analysis |
| Identification of the aberrant gene expression in precancerous and cancerous lesions by comparing the gene expression of stem-like cells in diseased tissues with normal stem cells |
| Entrez ID | Symbol | Replicates | Species | Organ | Tissue | Adj P-value | Log2FC | Malignancy |
| 222 | ALDH3B2 | GSM4909282 | Human | Breast | IDC | 1.20e-09 | 3.18e-01 | -0.0288 |
| 222 | ALDH3B2 | GSM4909285 | Human | Breast | IDC | 6.01e-05 | 1.61e-01 | 0.21 |
| 222 | ALDH3B2 | GSM4909289 | Human | Breast | IDC | 3.12e-04 | 4.85e-01 | 0.1064 |
| 222 | ALDH3B2 | GSM4909290 | Human | Breast | IDC | 2.58e-19 | 5.21e-01 | 0.2096 |
| 222 | ALDH3B2 | GSM4909298 | Human | Breast | IDC | 8.06e-04 | 1.15e-01 | 0.1551 |
| 222 | ALDH3B2 | GSM4909312 | Human | Breast | IDC | 1.54e-04 | 3.31e-01 | 0.1552 |
| 222 | ALDH3B2 | GSM4909313 | Human | Breast | IDC | 8.68e-03 | 2.85e-01 | 0.0391 |
| 222 | ALDH3B2 | GSM4909317 | Human | Breast | IDC | 1.28e-03 | 2.28e-01 | 0.1355 |
| 222 | ALDH3B2 | GSM4909321 | Human | Breast | IDC | 1.34e-03 | 2.46e-01 | 0.1559 |
| 222 | ALDH3B2 | brca2 | Human | Breast | Precancer | 5.88e-05 | 1.64e-01 | -0.024 |
| 222 | ALDH3B2 | M1 | Human | Breast | IDC | 8.50e-12 | 4.29e-01 | 0.1577 |
| 222 | ALDH3B2 | NCCBC2 | Human | Breast | DCIS | 3.38e-05 | 6.23e-01 | 0.1554 |
| 222 | ALDH3B2 | NCCBC6 | Human | Breast | DCIS | 1.60e-11 | 9.81e-01 | 0.2095 |
| 222 | ALDH3B2 | DCIS2 | Human | Breast | DCIS | 9.23e-03 | -5.91e-03 | 0.0085 |
| 222 | ALDH3B2 | P1T-E | Human | Esophagus | ESCC | 1.64e-05 | 3.26e-01 | 0.0875 |
| 222 | ALDH3B2 | P2T-E | Human | Esophagus | ESCC | 8.40e-04 | 1.01e-01 | 0.1177 |
| 222 | ALDH3B2 | P4T-E | Human | Esophagus | ESCC | 8.33e-13 | 3.71e-01 | 0.1323 |
| 222 | ALDH3B2 | P5T-E | Human | Esophagus | ESCC | 8.08e-19 | 3.72e-01 | 0.1327 |
| 222 | ALDH3B2 | P8T-E | Human | Esophagus | ESCC | 9.65e-22 | 5.79e-01 | 0.0889 |
| 222 | ALDH3B2 | P9T-E | Human | Esophagus | ESCC | 1.11e-03 | 1.24e-01 | 0.1131 |
| Page: 1 2 3 |
| Tissue | Expression Dynamics | Abbreviation |
| Breast | 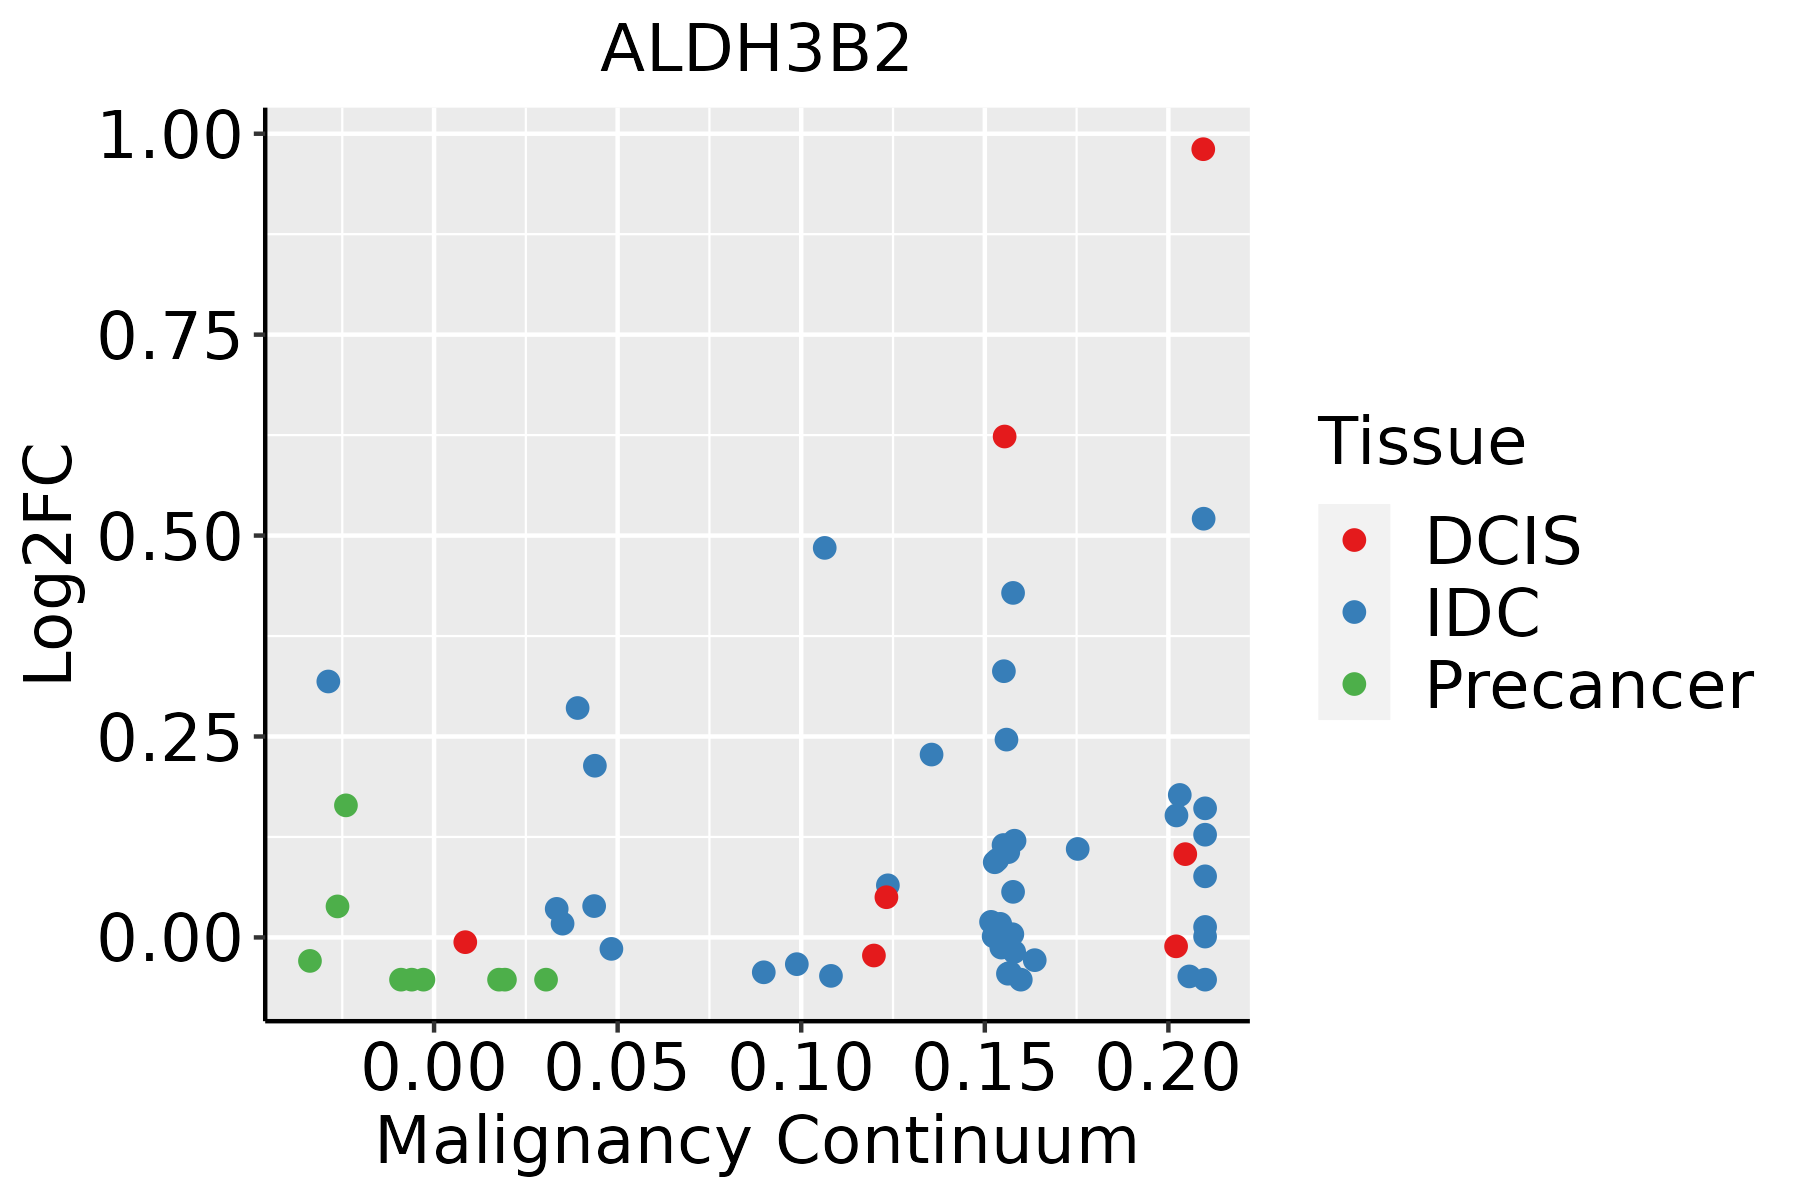 | IDC: Invasive ductal carcinoma |
| DCIS: Ductal carcinoma in situ | ||
| Precancer(BRCA1-mut): Precancerous lesion from BRCA1 mutation carriers | ||
| Esophagus |  | ESCC: Esophageal squamous cell carcinoma |
| HGIN: High-grade intraepithelial neoplasias | ||
| LGIN: Low-grade intraepithelial neoplasias | ||
| Oral Cavity | 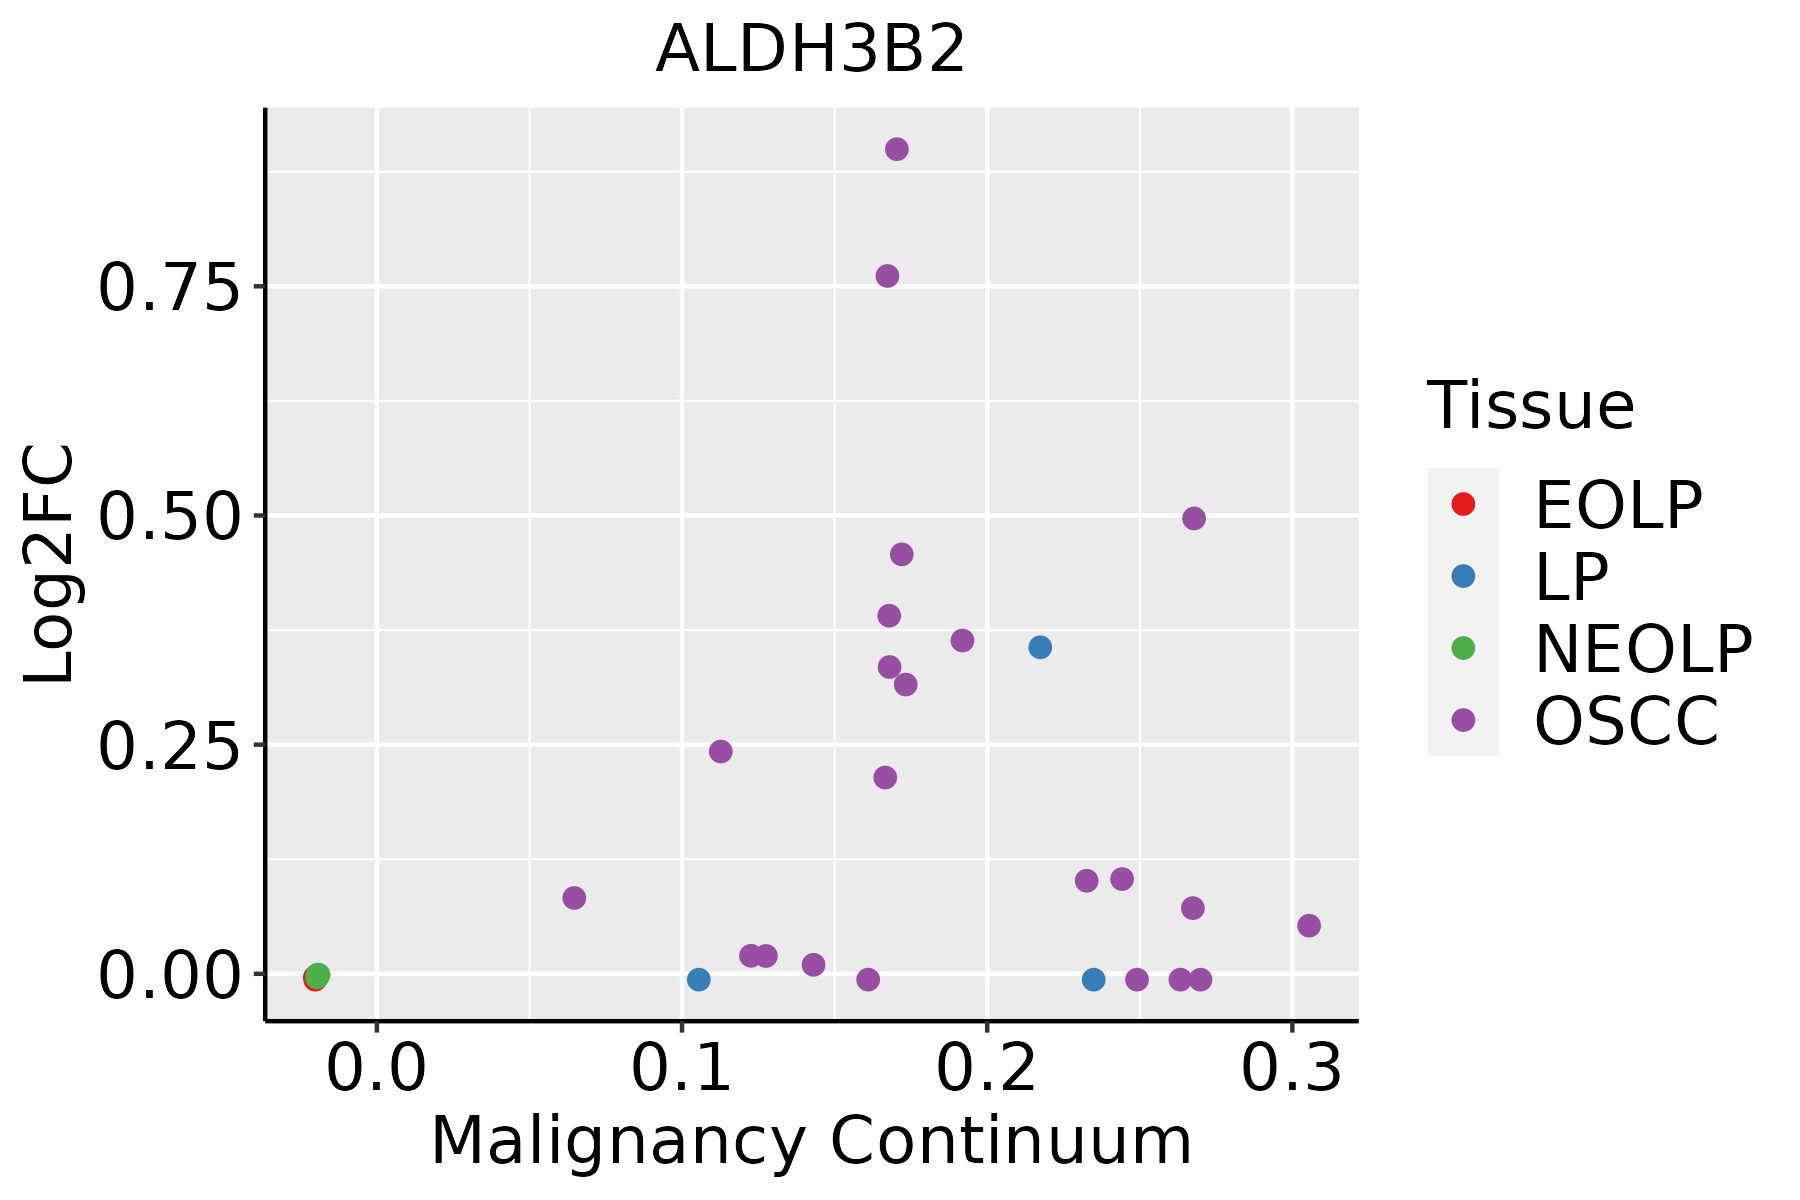 | EOLP: Erosive Oral lichen planus |
| LP: leukoplakia | ||
| NEOLP: Non-erosive oral lichen planus | ||
| OSCC: Oral squamous cell carcinoma |
| ∗log2FC in expression of this searched gene in stem-like cells from each diseased tissue sample relative to stem-like cells in normal samples in each tissue plotted against the malignancy continuum. Samples are colored based on if they are from different disease stage. |
Top |
Malignant transformation related pathway analysis |
| Find out the enriched GO biological processes and KEGG pathways involved in transition from healthy to precancer to cancer |
| Tissue | Disease Stage | Enriched GO biological Processes |
| Colorectum | AD |  |
| Colorectum | SER |  |
| Colorectum | MSS |  |
| Colorectum | MSI-H |  |
| Colorectum | FAP |  |
| ∗Top 15 enriched GO BP terms are showed in the bar plot of each disease state in each tissue. Each row represents a significant GO biological process which is colored according to the -log10(p.adjust). |
| Page: 1 2 3 4 5 6 7 8 9 |
| GO ID | Tissue | Disease Stage | Description | Gene Ratio | Bg Ratio | pvalue | p.adjust | Count |
| GO:00066433 | Esophagus | ESCC | membrane lipid metabolic process | 130/8552 | 203/18723 | 9.29e-08 | 1.54e-06 | 130 |
| GO:00464673 | Esophagus | ESCC | membrane lipid biosynthetic process | 91/8552 | 142/18723 | 7.19e-06 | 7.19e-05 | 91 |
| GO:00060668 | Esophagus | ESCC | alcohol metabolic process | 202/8552 | 353/18723 | 7.32e-06 | 7.26e-05 | 202 |
| GO:00066652 | Esophagus | ESCC | sphingolipid metabolic process | 96/8552 | 155/18723 | 3.21e-05 | 2.66e-04 | 96 |
| GO:00060818 | Esophagus | ESCC | cellular aldehyde metabolic process | 40/8552 | 60/18723 | 8.30e-04 | 4.28e-03 | 40 |
| GO:00442827 | Esophagus | ESCC | small molecule catabolic process | 201/8552 | 376/18723 | 1.35e-03 | 6.41e-03 | 201 |
| GO:00301481 | Esophagus | ESCC | sphingolipid biosynthetic process | 62/8552 | 103/18723 | 2.10e-03 | 9.38e-03 | 62 |
| GO:00066432 | Oral cavity | OSCC | membrane lipid metabolic process | 111/7305 | 203/18723 | 4.02e-06 | 4.69e-05 | 111 |
| GO:00060667 | Oral cavity | OSCC | alcohol metabolic process | 179/7305 | 353/18723 | 4.54e-06 | 5.21e-05 | 179 |
| GO:00066651 | Oral cavity | OSCC | sphingolipid metabolic process | 84/7305 | 155/18723 | 8.64e-05 | 6.61e-04 | 84 |
| GO:00464672 | Oral cavity | OSCC | membrane lipid biosynthetic process | 77/7305 | 142/18723 | 1.63e-04 | 1.13e-03 | 77 |
| GO:00060817 | Oral cavity | OSCC | cellular aldehyde metabolic process | 36/7305 | 60/18723 | 7.94e-04 | 4.27e-03 | 36 |
| GO:00442826 | Oral cavity | OSCC | small molecule catabolic process | 174/7305 | 376/18723 | 2.25e-03 | 1.00e-02 | 174 |
| GO:0030148 | Oral cavity | OSCC | sphingolipid biosynthetic process | 53/7305 | 103/18723 | 6.81e-03 | 2.53e-02 | 53 |
| Page: 1 |
| Pathway ID | Tissue | Disease Stage | Description | Gene Ratio | Bg Ratio | pvalue | p.adjust | qvalue | Count |
| hsa0001010 | Breast | Precancer | Glycolysis / Gluconeogenesis | 13/684 | 67/8465 | 2.39e-03 | 1.51e-02 | 1.16e-02 | 13 |
| hsa0001013 | Breast | Precancer | Glycolysis / Gluconeogenesis | 13/684 | 67/8465 | 2.39e-03 | 1.51e-02 | 1.16e-02 | 13 |
| hsa0001014 | Oral cavity | OSCC | Glycolysis / Gluconeogenesis | 40/3704 | 67/8465 | 6.08e-03 | 1.44e-02 | 7.31e-03 | 40 |
| hsa0001015 | Oral cavity | OSCC | Glycolysis / Gluconeogenesis | 40/3704 | 67/8465 | 6.08e-03 | 1.44e-02 | 7.31e-03 | 40 |
| Page: 1 |
Top |
Cell-cell communication analysis |
| Identification of potential cell-cell interactions between two cell types and their ligand-receptor pairs for different disease states |
| Ligand | Receptor | LRpair | Pathway | Tissue | Disease Stage |
| Page: 1 |
Top |
Single-cell gene regulatory network inference analysis |
| Find out the significant the regulons (TFs) and the target genes of each regulon across cell types for different disease states |
| TF | Cell Type | Tissue | Disease Stage | Target Gene | RSS | Regulon Activity |
| ∗The dot plots of a searched regulon are shown for all cell subpopulations in each disease state of each tissue based on the regulon specific score inferred using pySCENIC and by calculating the average expression. |
| Page: 1 |
Top |
Somatic mutation of malignant transformation related genes |
| Annotation of somatic variants for genes involved in malignant transformation |
| Hugo Symbol | Variant Class | Variant Classification | dbSNP RS | HGVSc | HGVSp | HGVSp Short | SWISSPROT | BIOTYPE | SIFT | PolyPhen | Tumor Sample Barcode | Tissue | Histology | Sex | Age | Stage | Therapy Types | Drugs | Outcome |
| ALDH3B2 | SNV | Missense_Mutation | c.762C>G | p.Ile254Met | p.I254M | P48448 | protein_coding | deleterious(0.01) | probably_damaging(0.975) | TCGA-BH-A0DZ-01 | Breast | breast invasive carcinoma | Female | <65 | I/II | Chemotherapy | docetaxel | SD | |
| ALDH3B2 | SNV | Missense_Mutation | c.864N>A | p.Asn288Lys | p.N288K | P48448 | protein_coding | tolerated(0.35) | benign(0.007) | TCGA-BH-A18Q-01 | Breast | breast invasive carcinoma | Female | <65 | I/II | Unknown | Unknown | SD | |
| ALDH3B2 | SNV | Missense_Mutation | rs1140670 | c.139N>A | p.Ala47Thr | p.A47T | P48448 | protein_coding | deleterious(0) | probably_damaging(1) | TCGA-EW-A1IZ-01 | Breast | breast invasive carcinoma | Female | <65 | III/IV | Chemotherapy | taxotere | SD |
| ALDH3B2 | SNV | Missense_Mutation | novel | c.1052N>T | p.Pro351Leu | p.P351L | P48448 | protein_coding | tolerated(0.18) | benign(0.029) | TCGA-UL-AAZ6-01 | Breast | breast invasive carcinoma | Female | >=65 | I/II | Chemotherapy | herceptin | SD |
| ALDH3B2 | insertion | Nonsense_Mutation | novel | c.512_513insAATCTGCAAAACAAAATGAGGTGAT | p.Cys171Ter | p.C171* | P48448 | protein_coding | TCGA-A8-A06X-01 | Breast | breast invasive carcinoma | Female | >=65 | I/II | Unknown | Unknown | SD | ||
| ALDH3B2 | SNV | Missense_Mutation | rs147016371 | c.853N>A | p.Ala285Thr | p.A285T | P48448 | protein_coding | tolerated(0.1) | possibly_damaging(0.595) | TCGA-2W-A8YY-01 | Cervix | cervical & endocervical cancer | Female | <65 | I/II | Chemotherapy | cisplatin | CR |
| ALDH3B2 | SNV | Missense_Mutation | rs111503561 | c.737C>T | p.Thr246Met | p.T246M | P48448 | protein_coding | tolerated(0.07) | benign(0.223) | TCGA-EA-A410-01 | Cervix | cervical & endocervical cancer | Female | <65 | I/II | Unknown | Unknown | SD |
| ALDH3B2 | SNV | Missense_Mutation | novel | c.520N>C | p.Glu174Gln | p.E174Q | P48448 | protein_coding | tolerated(0.08) | possibly_damaging(0.898) | TCGA-Q1-A73O-01 | Cervix | cervical & endocervical cancer | Female | <65 | I/II | Chemotherapy | cisplatin | CR |
| ALDH3B2 | SNV | Missense_Mutation | rs149110344 | c.634C>T | p.Arg212Trp | p.R212W | P48448 | protein_coding | deleterious(0.01) | possibly_damaging(0.579) | TCGA-VS-A9UH-01 | Cervix | cervical & endocervical cancer | Female | <65 | I/II | Chemotherapy | cisplatin | CR |
| ALDH3B2 | SNV | Missense_Mutation | c.1021N>G | p.Phe341Val | p.F341V | P48448 | protein_coding | deleterious(0.01) | probably_damaging(1) | TCGA-AA-3492-01 | Colorectum | colon adenocarcinoma | Female | >=65 | I/II | Unknown | Unknown | SD |
| Page: 1 2 3 4 5 |
Top |
Related drugs of malignant transformation related genes |
| Identification of chemicals and drugs interact with genes involved in malignant transfromation |
| (DGIdb 4.0) |
| Entrez ID | Symbol | Category | Interaction Types | Drug Claim Name | Drug Name | PMIDs |
| Page: 1 |

Copyright 2023-Present -The University of Texas Health Science Center at Houston |