
|
|||||
|
 | |
| |
| |
| |
| |
| |
|
Gene: ALDH3B1 |
Gene summary for ALDH3B1 |
| Gene information | Species | Human | Gene symbol | ALDH3B1 | Gene ID | 221 |
| Gene name | aldehyde dehydrogenase 3 family member B1 | |
| Gene Alias | ALDH4 | |
| Cytomap | 11q13.2 | |
| Gene Type | protein-coding | GO ID | GO:0006066 | UniProtAcc | A0A024R5D8 |
Top |
Malignant transformation analysis |
| Identification of the aberrant gene expression in precancerous and cancerous lesions by comparing the gene expression of stem-like cells in diseased tissues with normal stem cells |
| Entrez ID | Symbol | Replicates | Species | Organ | Tissue | Adj P-value | Log2FC | Malignancy |
| 221 | ALDH3B1 | LZE5T | Human | Esophagus | ESCC | 1.54e-04 | 2.69e-01 | 0.0514 |
| 221 | ALDH3B1 | LZE24T | Human | Esophagus | ESCC | 1.48e-08 | 3.74e-01 | 0.0596 |
| 221 | ALDH3B1 | P5T-E | Human | Esophagus | ESCC | 3.15e-02 | 4.81e-02 | 0.1327 |
| 221 | ALDH3B1 | P8T-E | Human | Esophagus | ESCC | 2.66e-24 | 4.11e-01 | 0.0889 |
| 221 | ALDH3B1 | P11T-E | Human | Esophagus | ESCC | 9.07e-04 | 1.66e-01 | 0.1426 |
| 221 | ALDH3B1 | P12T-E | Human | Esophagus | ESCC | 2.70e-02 | 1.69e-02 | 0.1122 |
| 221 | ALDH3B1 | P19T-E | Human | Esophagus | ESCC | 5.57e-05 | 2.71e-01 | 0.1662 |
| 221 | ALDH3B1 | P21T-E | Human | Esophagus | ESCC | 4.09e-03 | 2.65e-02 | 0.1617 |
| 221 | ALDH3B1 | P22T-E | Human | Esophagus | ESCC | 8.79e-04 | 4.28e-02 | 0.1236 |
| 221 | ALDH3B1 | P24T-E | Human | Esophagus | ESCC | 3.03e-07 | 9.78e-02 | 0.1287 |
| 221 | ALDH3B1 | P32T-E | Human | Esophagus | ESCC | 2.04e-03 | 7.17e-02 | 0.1666 |
| 221 | ALDH3B1 | P36T-E | Human | Esophagus | ESCC | 2.82e-02 | 1.27e-01 | 0.1187 |
| 221 | ALDH3B1 | P56T-E | Human | Esophagus | ESCC | 6.66e-05 | 3.63e-01 | 0.1613 |
| 221 | ALDH3B1 | P57T-E | Human | Esophagus | ESCC | 2.18e-07 | 1.19e-01 | 0.0926 |
| 221 | ALDH3B1 | P61T-E | Human | Esophagus | ESCC | 1.62e-06 | 1.78e-01 | 0.099 |
| 221 | ALDH3B1 | P74T-E | Human | Esophagus | ESCC | 1.86e-07 | 3.10e-01 | 0.1479 |
| 221 | ALDH3B1 | P75T-E | Human | Esophagus | ESCC | 9.37e-09 | 3.06e-01 | 0.1125 |
| 221 | ALDH3B1 | P76T-E | Human | Esophagus | ESCC | 8.45e-04 | 4.83e-02 | 0.1207 |
| 221 | ALDH3B1 | P82T-E | Human | Esophagus | ESCC | 4.96e-16 | 8.24e-01 | 0.1072 |
| 221 | ALDH3B1 | P94T-E | Human | Esophagus | ESCC | 3.53e-11 | 6.99e-01 | 0.0879 |
| Page: 1 2 |
| Tissue | Expression Dynamics | Abbreviation |
| Esophagus | 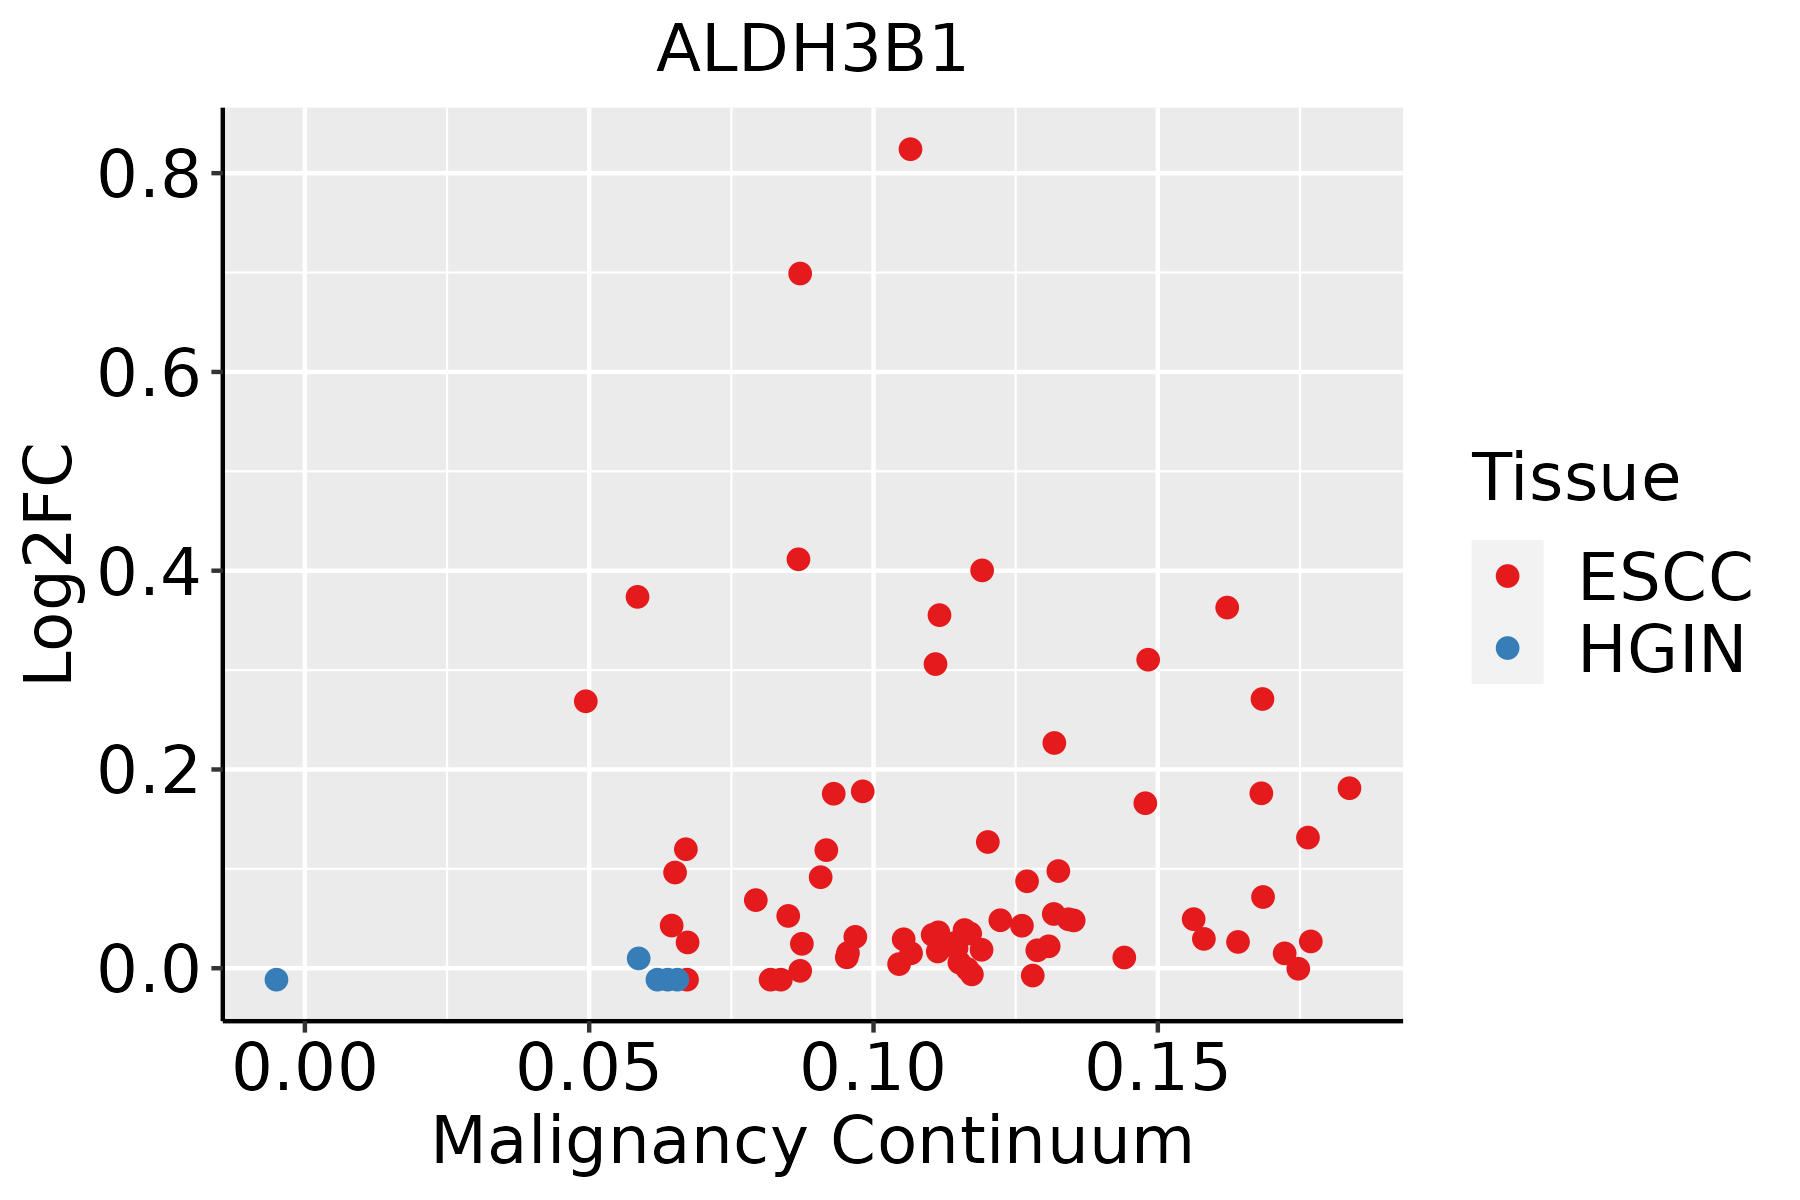 | ESCC: Esophageal squamous cell carcinoma |
| HGIN: High-grade intraepithelial neoplasias | ||
| LGIN: Low-grade intraepithelial neoplasias | ||
| Liver |  | HCC: Hepatocellular carcinoma |
| NAFLD: Non-alcoholic fatty liver disease | ||
| Oral Cavity | 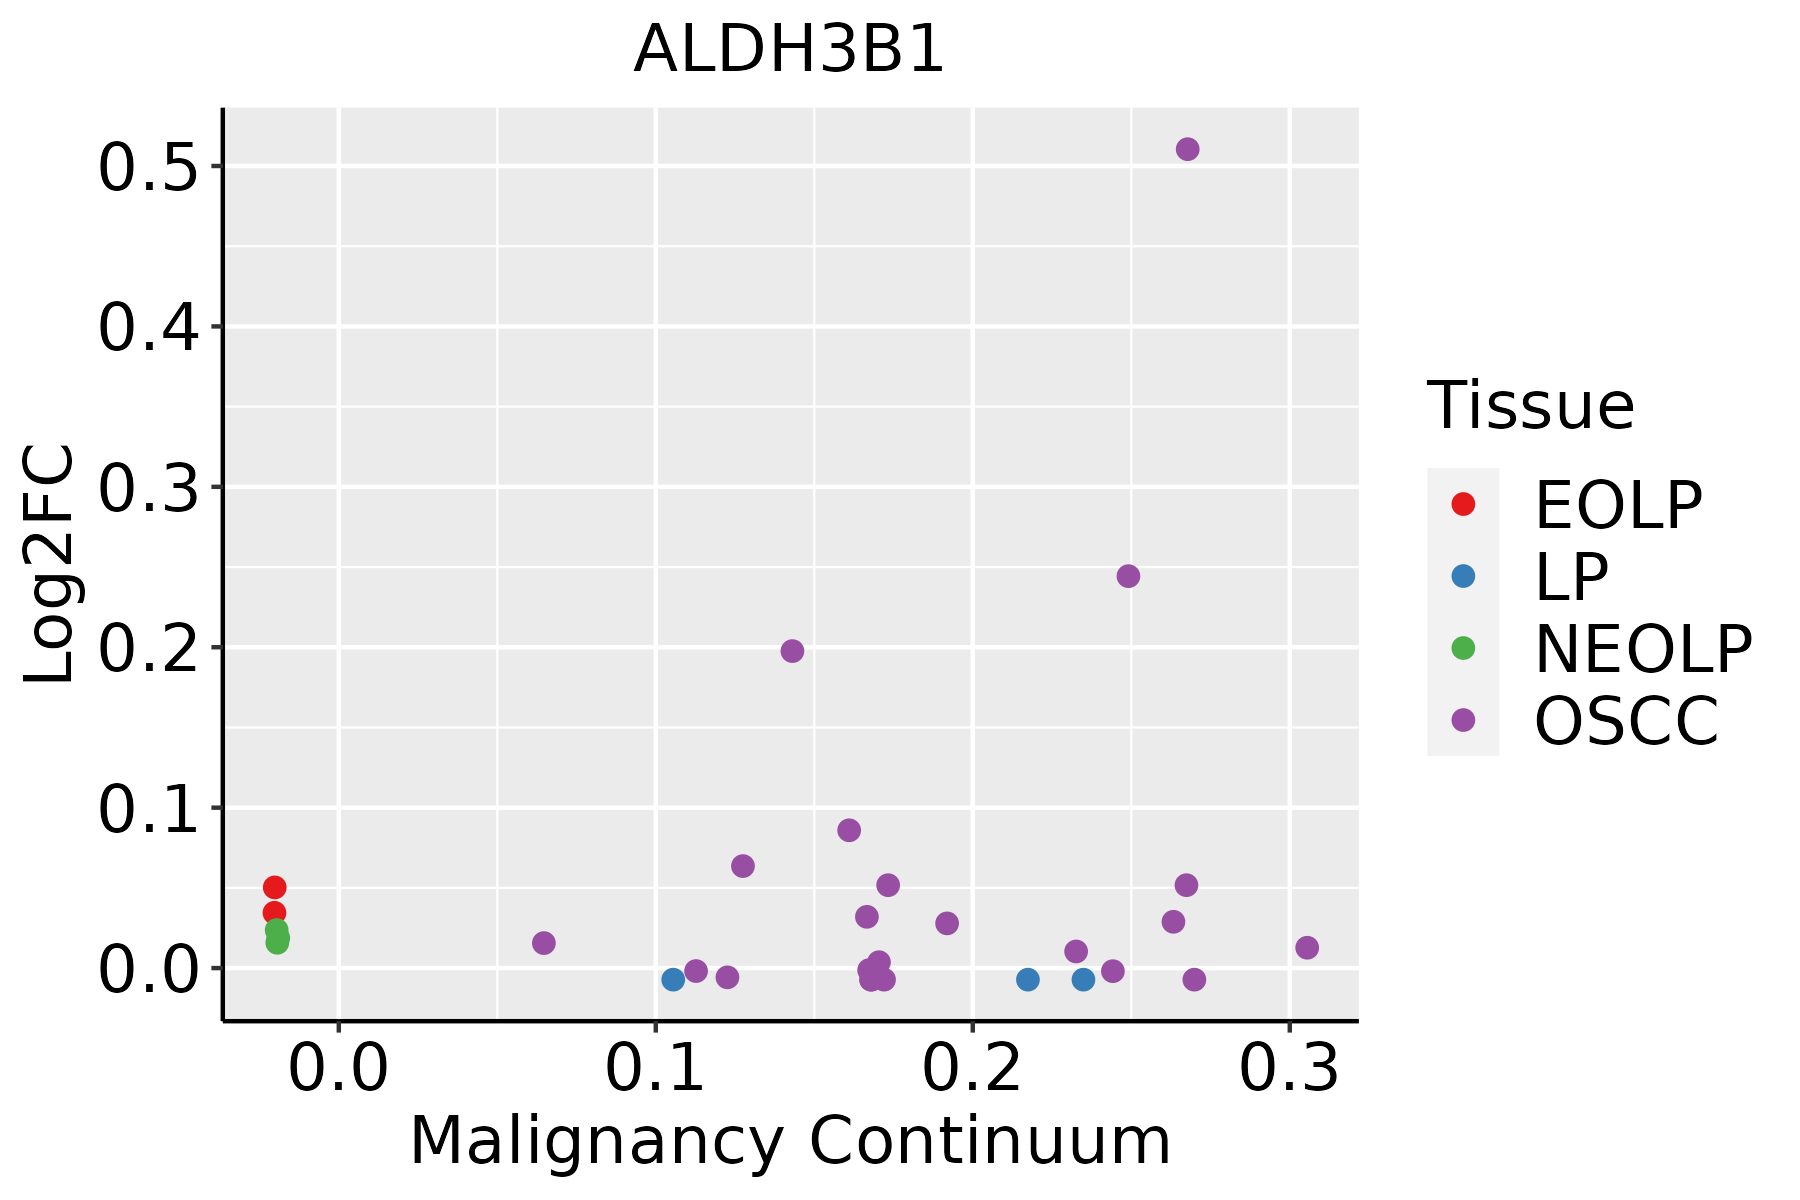 | EOLP: Erosive Oral lichen planus |
| LP: leukoplakia | ||
| NEOLP: Non-erosive oral lichen planus | ||
| OSCC: Oral squamous cell carcinoma |
| ∗log2FC in expression of this searched gene in stem-like cells from each diseased tissue sample relative to stem-like cells in normal samples in each tissue plotted against the malignancy continuum. Samples are colored based on if they are from different disease stage. |
Top |
Malignant transformation related pathway analysis |
| Find out the enriched GO biological processes and KEGG pathways involved in transition from healthy to precancer to cancer |
| Tissue | Disease Stage | Enriched GO biological Processes |
| Colorectum | AD |  |
| Colorectum | SER |  |
| Colorectum | MSS |  |
| Colorectum | MSI-H |  |
| Colorectum | FAP |  |
| ∗Top 15 enriched GO BP terms are showed in the bar plot of each disease state in each tissue. Each row represents a significant GO biological process which is colored according to the -log10(p.adjust). |
| Page: 1 2 3 4 5 6 7 8 9 |
| GO ID | Tissue | Disease Stage | Description | Gene Ratio | Bg Ratio | pvalue | p.adjust | Count |
| GO:0006979111 | Esophagus | ESCC | response to oxidative stress | 303/8552 | 446/18723 | 7.15e-22 | 1.30e-19 | 303 |
| GO:0062197111 | Esophagus | ESCC | cellular response to chemical stress | 234/8552 | 337/18723 | 5.37e-19 | 5.97e-17 | 234 |
| GO:0034599111 | Esophagus | ESCC | cellular response to oxidative stress | 197/8552 | 288/18723 | 3.76e-15 | 2.15e-13 | 197 |
| GO:00066433 | Esophagus | ESCC | membrane lipid metabolic process | 130/8552 | 203/18723 | 9.29e-08 | 1.54e-06 | 130 |
| GO:00464673 | Esophagus | ESCC | membrane lipid biosynthetic process | 91/8552 | 142/18723 | 7.19e-06 | 7.19e-05 | 91 |
| GO:00060668 | Esophagus | ESCC | alcohol metabolic process | 202/8552 | 353/18723 | 7.32e-06 | 7.26e-05 | 202 |
| GO:00066652 | Esophagus | ESCC | sphingolipid metabolic process | 96/8552 | 155/18723 | 3.21e-05 | 2.66e-04 | 96 |
| GO:00060818 | Esophagus | ESCC | cellular aldehyde metabolic process | 40/8552 | 60/18723 | 8.30e-04 | 4.28e-03 | 40 |
| GO:00442827 | Esophagus | ESCC | small molecule catabolic process | 201/8552 | 376/18723 | 1.35e-03 | 6.41e-03 | 201 |
| GO:00301481 | Esophagus | ESCC | sphingolipid biosynthetic process | 62/8552 | 103/18723 | 2.10e-03 | 9.38e-03 | 62 |
| GO:000697922 | Liver | HCC | response to oxidative stress | 281/7958 | 446/18723 | 9.75e-19 | 1.24e-16 | 281 |
| GO:006219722 | Liver | HCC | cellular response to chemical stress | 216/7958 | 337/18723 | 6.86e-16 | 5.44e-14 | 216 |
| GO:003459922 | Liver | HCC | cellular response to oxidative stress | 183/7958 | 288/18723 | 3.65e-13 | 1.93e-11 | 183 |
| GO:004428221 | Liver | HCC | small molecule catabolic process | 225/7958 | 376/18723 | 6.50e-12 | 2.80e-10 | 225 |
| GO:000606621 | Liver | HCC | alcohol metabolic process | 208/7958 | 353/18723 | 2.80e-10 | 9.50e-09 | 208 |
| GO:00066431 | Liver | HCC | membrane lipid metabolic process | 115/7958 | 203/18723 | 3.17e-05 | 3.22e-04 | 115 |
| GO:000608112 | Liver | HCC | cellular aldehyde metabolic process | 39/7958 | 60/18723 | 3.61e-04 | 2.50e-03 | 39 |
| GO:0006665 | Liver | HCC | sphingolipid metabolic process | 85/7958 | 155/18723 | 1.27e-03 | 6.92e-03 | 85 |
| GO:0046467 | Liver | HCC | membrane lipid biosynthetic process | 78/7958 | 142/18723 | 1.85e-03 | 9.46e-03 | 78 |
| GO:00461851 | Liver | HCC | aldehyde catabolic process | 10/7958 | 12/18723 | 4.79e-03 | 2.02e-02 | 10 |
| Page: 1 2 |
| Pathway ID | Tissue | Disease Stage | Description | Gene Ratio | Bg Ratio | pvalue | p.adjust | qvalue | Count |
| hsa0001016 | Esophagus | ESCC | Glycolysis / Gluconeogenesis | 42/4205 | 67/8465 | 2.15e-02 | 4.78e-02 | 2.45e-02 | 42 |
| hsa0001017 | Esophagus | ESCC | Glycolysis / Gluconeogenesis | 42/4205 | 67/8465 | 2.15e-02 | 4.78e-02 | 2.45e-02 | 42 |
| hsa0001022 | Liver | HCC | Glycolysis / Gluconeogenesis | 43/4020 | 67/8465 | 4.26e-03 | 1.29e-02 | 7.15e-03 | 43 |
| hsa004102 | Liver | HCC | beta-Alanine metabolism | 22/4020 | 31/8465 | 6.93e-03 | 1.92e-02 | 1.07e-02 | 22 |
| hsa0001032 | Liver | HCC | Glycolysis / Gluconeogenesis | 43/4020 | 67/8465 | 4.26e-03 | 1.29e-02 | 7.15e-03 | 43 |
| hsa004103 | Liver | HCC | beta-Alanine metabolism | 22/4020 | 31/8465 | 6.93e-03 | 1.92e-02 | 1.07e-02 | 22 |
| hsa0001014 | Oral cavity | OSCC | Glycolysis / Gluconeogenesis | 40/3704 | 67/8465 | 6.08e-03 | 1.44e-02 | 7.31e-03 | 40 |
| hsa0001015 | Oral cavity | OSCC | Glycolysis / Gluconeogenesis | 40/3704 | 67/8465 | 6.08e-03 | 1.44e-02 | 7.31e-03 | 40 |
| Page: 1 |
Top |
Cell-cell communication analysis |
| Identification of potential cell-cell interactions between two cell types and their ligand-receptor pairs for different disease states |
| Ligand | Receptor | LRpair | Pathway | Tissue | Disease Stage |
| Page: 1 |
Top |
Single-cell gene regulatory network inference analysis |
| Find out the significant the regulons (TFs) and the target genes of each regulon across cell types for different disease states |
| TF | Cell Type | Tissue | Disease Stage | Target Gene | RSS | Regulon Activity |
| ∗The dot plots of a searched regulon are shown for all cell subpopulations in each disease state of each tissue based on the regulon specific score inferred using pySCENIC and by calculating the average expression. |
| Page: 1 |
Top |
Somatic mutation of malignant transformation related genes |
| Annotation of somatic variants for genes involved in malignant transformation |
| Hugo Symbol | Variant Class | Variant Classification | dbSNP RS | HGVSc | HGVSp | HGVSp Short | SWISSPROT | BIOTYPE | SIFT | PolyPhen | Tumor Sample Barcode | Tissue | Histology | Sex | Age | Stage | Therapy Types | Drugs | Outcome |
| ALDH3B1 | SNV | Missense_Mutation | rs757647123 | c.532N>C | p.Glu178Gln | p.E178Q | P43353 | protein_coding | tolerated(0.08) | benign(0.113) | TCGA-A8-A095-01 | Breast | breast invasive carcinoma | Female | <65 | I/II | Chemotherapy | 5-fluorouracil | CR |
| ALDH3B1 | SNV | Missense_Mutation | novel | c.1185G>C | p.Met395Ile | p.M395I | P43353 | protein_coding | tolerated(0.38) | benign(0.007) | TCGA-A8-A09G-01 | Breast | breast invasive carcinoma | Female | >=65 | III/IV | Unknown | Unknown | SD |
| ALDH3B1 | SNV | Missense_Mutation | novel | c.1240C>A | p.His414Asn | p.H414N | P43353 | protein_coding | deleterious(0) | probably_damaging(0.998) | TCGA-E9-A22G-01 | Breast | breast invasive carcinoma | Female | <65 | I/II | Chemotherapy | doxorubicin | SD |
| ALDH3B1 | SNV | Missense_Mutation | novel | c.1331N>T | p.Pro444Leu | p.P444L | P43353 | protein_coding | deleterious(0) | probably_damaging(1) | TCGA-2W-A8YY-01 | Cervix | cervical & endocervical cancer | Female | <65 | I/II | Chemotherapy | cisplatin | CR |
| ALDH3B1 | SNV | Missense_Mutation | novel | c.722N>A | p.Gly241Asp | p.G241D | P43353 | protein_coding | deleterious(0) | probably_damaging(1) | TCGA-AA-3672-01 | Colorectum | colon adenocarcinoma | Female | >=65 | III/IV | Unknown | Unknown | SD |
| ALDH3B1 | SNV | Missense_Mutation | rs780821654 | c.1033N>A | p.Val345Met | p.V345M | P43353 | protein_coding | deleterious(0) | probably_damaging(0.994) | TCGA-AA-3984-01 | Colorectum | colon adenocarcinoma | Female | <65 | I/II | Unknown | Unknown | SD |
| ALDH3B1 | SNV | Missense_Mutation | novel | c.162N>T | p.Lys54Asn | p.K54N | P43353 | protein_coding | deleterious(0) | probably_damaging(0.999) | TCGA-AZ-4313-01 | Colorectum | colon adenocarcinoma | Female | <65 | I/II | Unknown | Unknown | SD |
| ALDH3B1 | SNV | Missense_Mutation | novel | c.34N>T | p.Arg12Trp | p.R12W | P43353 | protein_coding | deleterious(0.01) | probably_damaging(1) | TCGA-G4-6588-01 | Colorectum | colon adenocarcinoma | Female | <65 | I/II | Unknown | Unknown | SD |
| ALDH3B1 | SNV | Missense_Mutation | novel | c.1213N>A | p.Val405Met | p.V405M | P43353 | protein_coding | deleterious(0) | probably_damaging(0.989) | TCGA-A5-A1OF-01 | Endometrium | uterine corpus endometrioid carcinoma | Female | <65 | I/II | Unknown | Unknown | SD |
| ALDH3B1 | SNV | Missense_Mutation | novel | c.1334C>A | p.Pro445Gln | p.P445Q | P43353 | protein_coding | deleterious(0) | probably_damaging(1) | TCGA-AJ-A2QO-01 | Endometrium | uterine corpus endometrioid carcinoma | Female | >=65 | I/II | Unknown | Unknown | SD |
| Page: 1 2 3 4 |
Top |
Related drugs of malignant transformation related genes |
| Identification of chemicals and drugs interact with genes involved in malignant transfromation |
| (DGIdb 4.0) |
| Entrez ID | Symbol | Category | Interaction Types | Drug Claim Name | Drug Name | PMIDs |
| Page: 1 |

Copyright 2023-Present -The University of Texas Health Science Center at Houston |