
|
|||||
|
 | |
| |
| |
| |
| |
| |
|
Gene: ALDH3A1 |
Gene summary for ALDH3A1 |
| Gene information | Species | Human | Gene symbol | ALDH3A1 | Gene ID | 218 |
| Gene name | aldehyde dehydrogenase 3 family member A1 | |
| Gene Alias | ALDH3 | |
| Cytomap | 17p11.2 | |
| Gene Type | protein-coding | GO ID | GO:0001666 | UniProtAcc | P30838 |
Top |
Malignant transformation analysis |
| Identification of the aberrant gene expression in precancerous and cancerous lesions by comparing the gene expression of stem-like cells in diseased tissues with normal stem cells |
| Entrez ID | Symbol | Replicates | Species | Organ | Tissue | Adj P-value | Log2FC | Malignancy |
| 218 | ALDH3A1 | LZE2T | Human | Esophagus | ESCC | 5.11e-15 | 2.93e+00 | 0.082 |
| 218 | ALDH3A1 | LZE4T | Human | Esophagus | ESCC | 1.88e-16 | 2.08e+00 | 0.0811 |
| 218 | ALDH3A1 | LZE7T | Human | Esophagus | ESCC | 3.14e-09 | 2.08e+00 | 0.0667 |
| 218 | ALDH3A1 | LZE21D1 | Human | Esophagus | HGIN | 6.77e-04 | 2.21e+00 | 0.0632 |
| 218 | ALDH3A1 | LZE22D1 | Human | Esophagus | HGIN | 2.87e-06 | 1.44e+00 | 0.0595 |
| 218 | ALDH3A1 | LZE22T | Human | Esophagus | ESCC | 7.40e-04 | 1.42e+00 | 0.068 |
| 218 | ALDH3A1 | LZE21T | Human | Esophagus | ESCC | 1.19e-09 | 2.10e+00 | 0.0655 |
| 218 | ALDH3A1 | P2T-E | Human | Esophagus | ESCC | 1.91e-16 | -4.95e-01 | 0.1177 |
| 218 | ALDH3A1 | P4T-E | Human | Esophagus | ESCC | 3.85e-26 | 1.88e+00 | 0.1323 |
| 218 | ALDH3A1 | P5T-E | Human | Esophagus | ESCC | 5.87e-16 | -1.97e-01 | 0.1327 |
| 218 | ALDH3A1 | P8T-E | Human | Esophagus | ESCC | 2.77e-04 | 4.60e-01 | 0.0889 |
| 218 | ALDH3A1 | P9T-E | Human | Esophagus | ESCC | 8.04e-49 | 2.67e+00 | 0.1131 |
| 218 | ALDH3A1 | P10T-E | Human | Esophagus | ESCC | 1.16e-13 | -1.49e-01 | 0.116 |
| 218 | ALDH3A1 | P15T-E | Human | Esophagus | ESCC | 3.13e-21 | 1.51e+00 | 0.1149 |
| 218 | ALDH3A1 | P16T-E | Human | Esophagus | ESCC | 1.89e-17 | -4.76e-01 | 0.1153 |
| 218 | ALDH3A1 | P20T-E | Human | Esophagus | ESCC | 6.89e-13 | 1.27e+00 | 0.1124 |
| 218 | ALDH3A1 | P21T-E | Human | Esophagus | ESCC | 4.54e-18 | 2.11e+00 | 0.1617 |
| 218 | ALDH3A1 | P22T-E | Human | Esophagus | ESCC | 5.29e-44 | 1.48e+00 | 0.1236 |
| 218 | ALDH3A1 | P27T-E | Human | Esophagus | ESCC | 4.80e-52 | 2.33e+00 | 0.1055 |
| 218 | ALDH3A1 | P28T-E | Human | Esophagus | ESCC | 3.59e-24 | 1.75e+00 | 0.1149 |
| Page: 1 2 3 4 5 6 |
| Tissue | Expression Dynamics | Abbreviation |
| Esophagus | 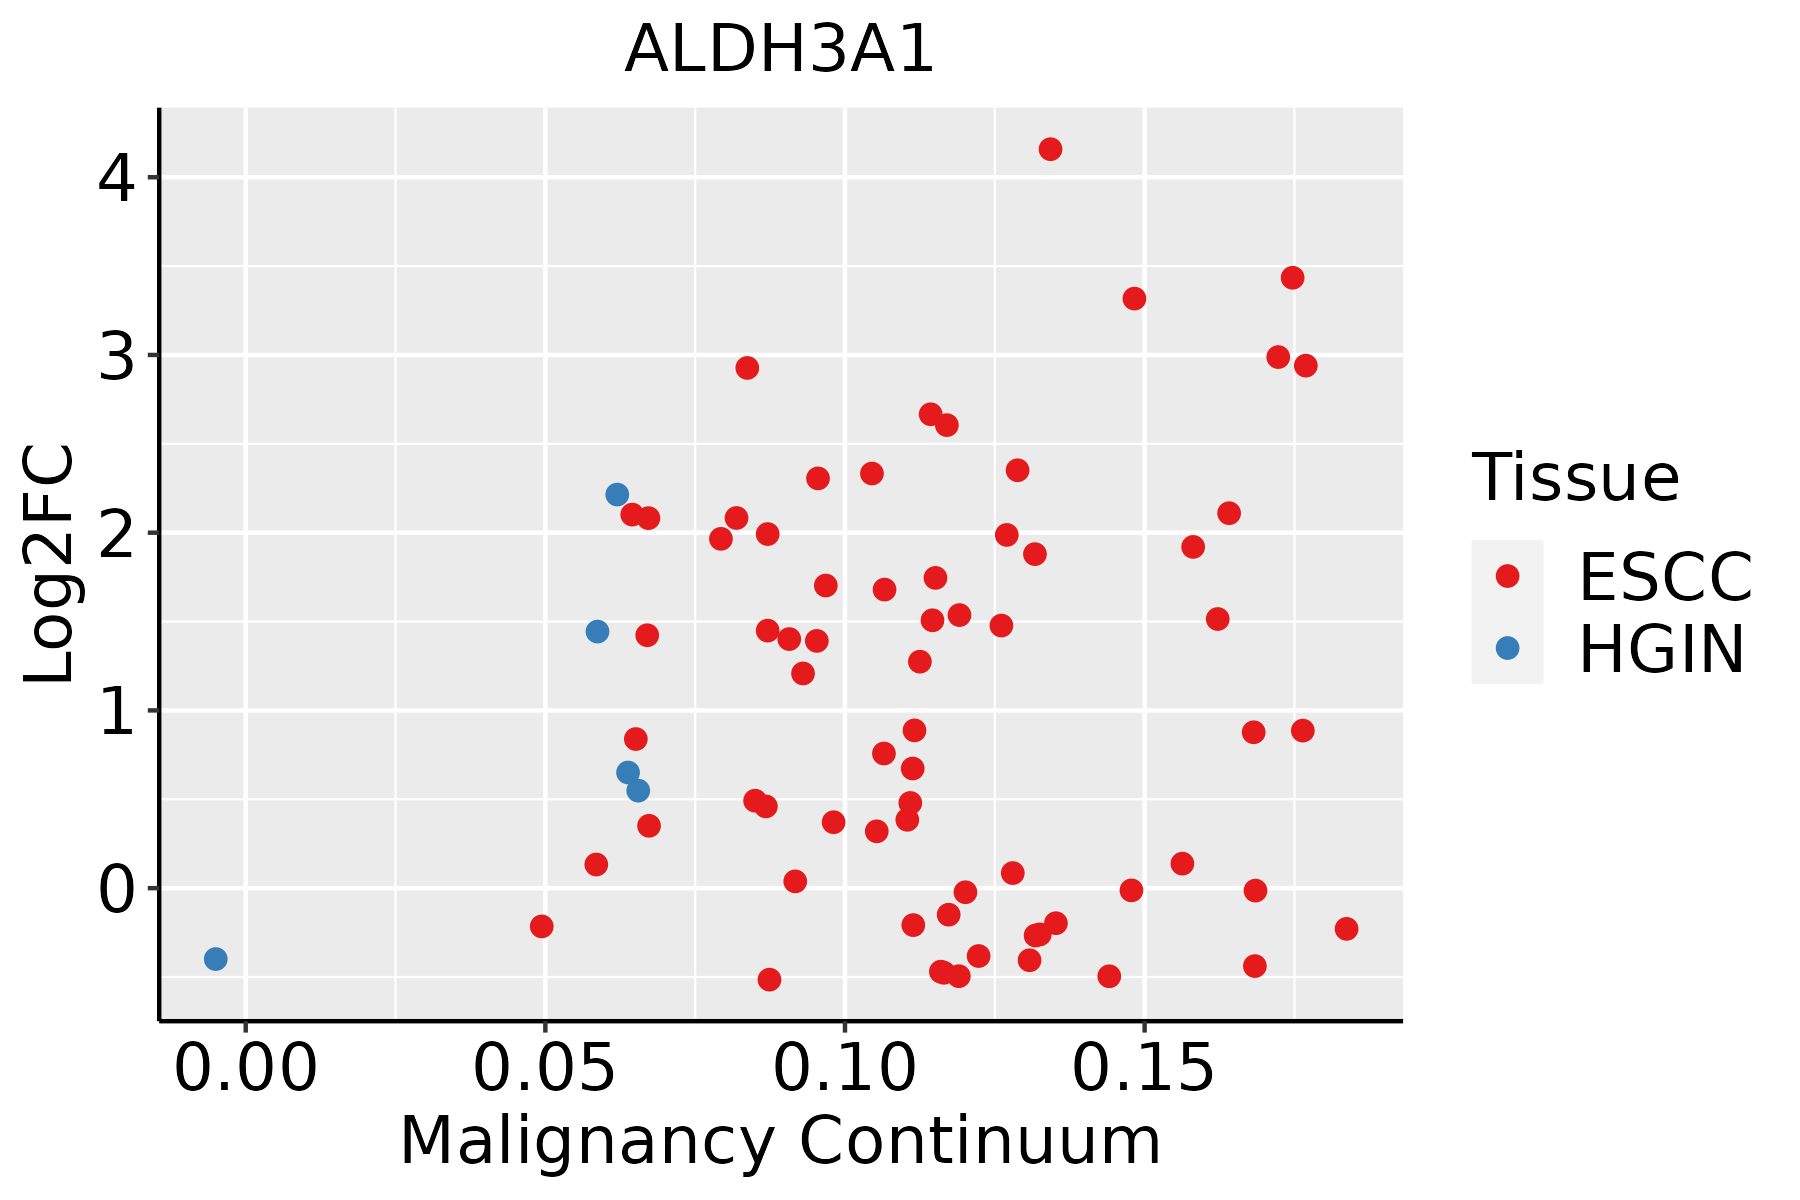 | ESCC: Esophageal squamous cell carcinoma |
| HGIN: High-grade intraepithelial neoplasias | ||
| LGIN: Low-grade intraepithelial neoplasias | ||
| GC | 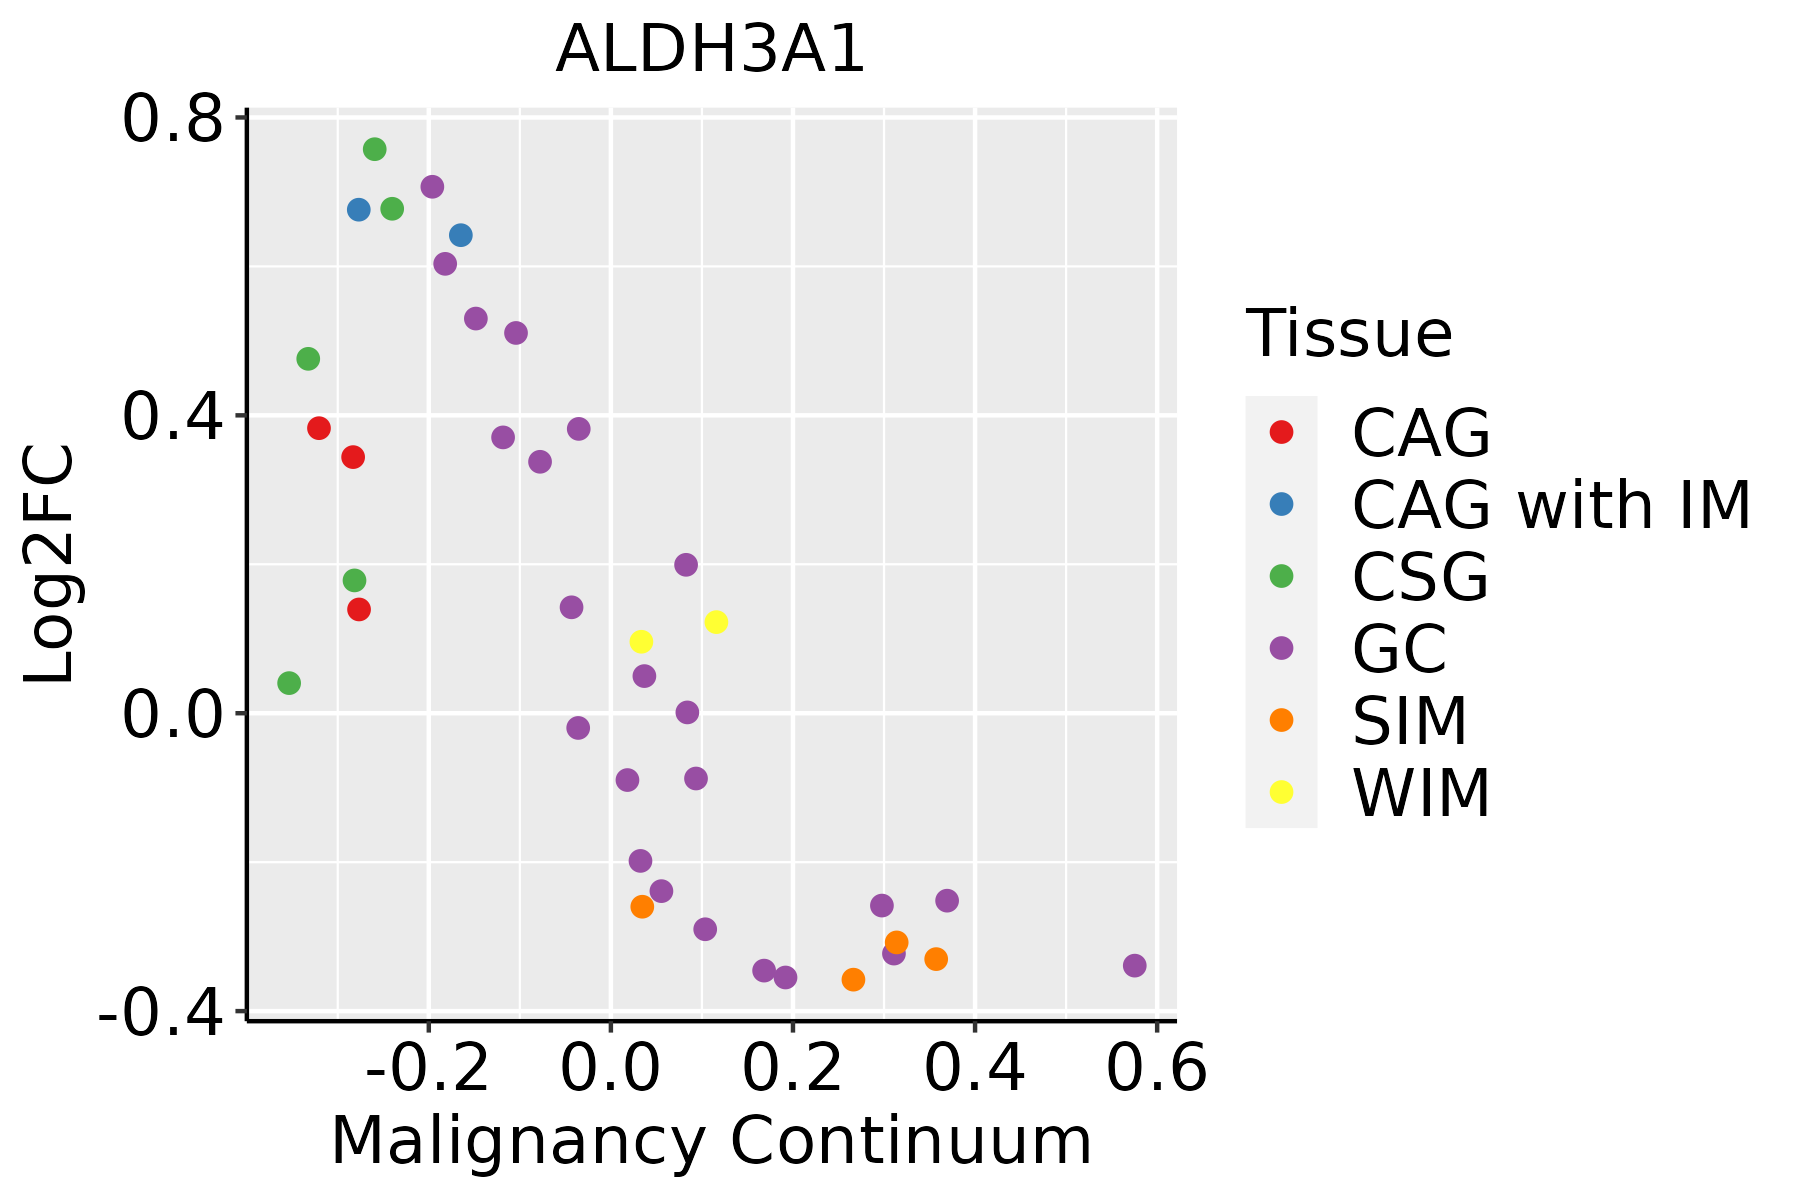 | CAG: Chronic atrophic gastritis |
| CAG with IM: Chronic atrophic gastritis with intestinal metaplasia | ||
| CSG: Chronic superficial gastritis | ||
| GC: Gastric cancer | ||
| SIM: Severe intestinal metaplasia | ||
| WIM: Wild intestinal metaplasia | ||
| Liver | 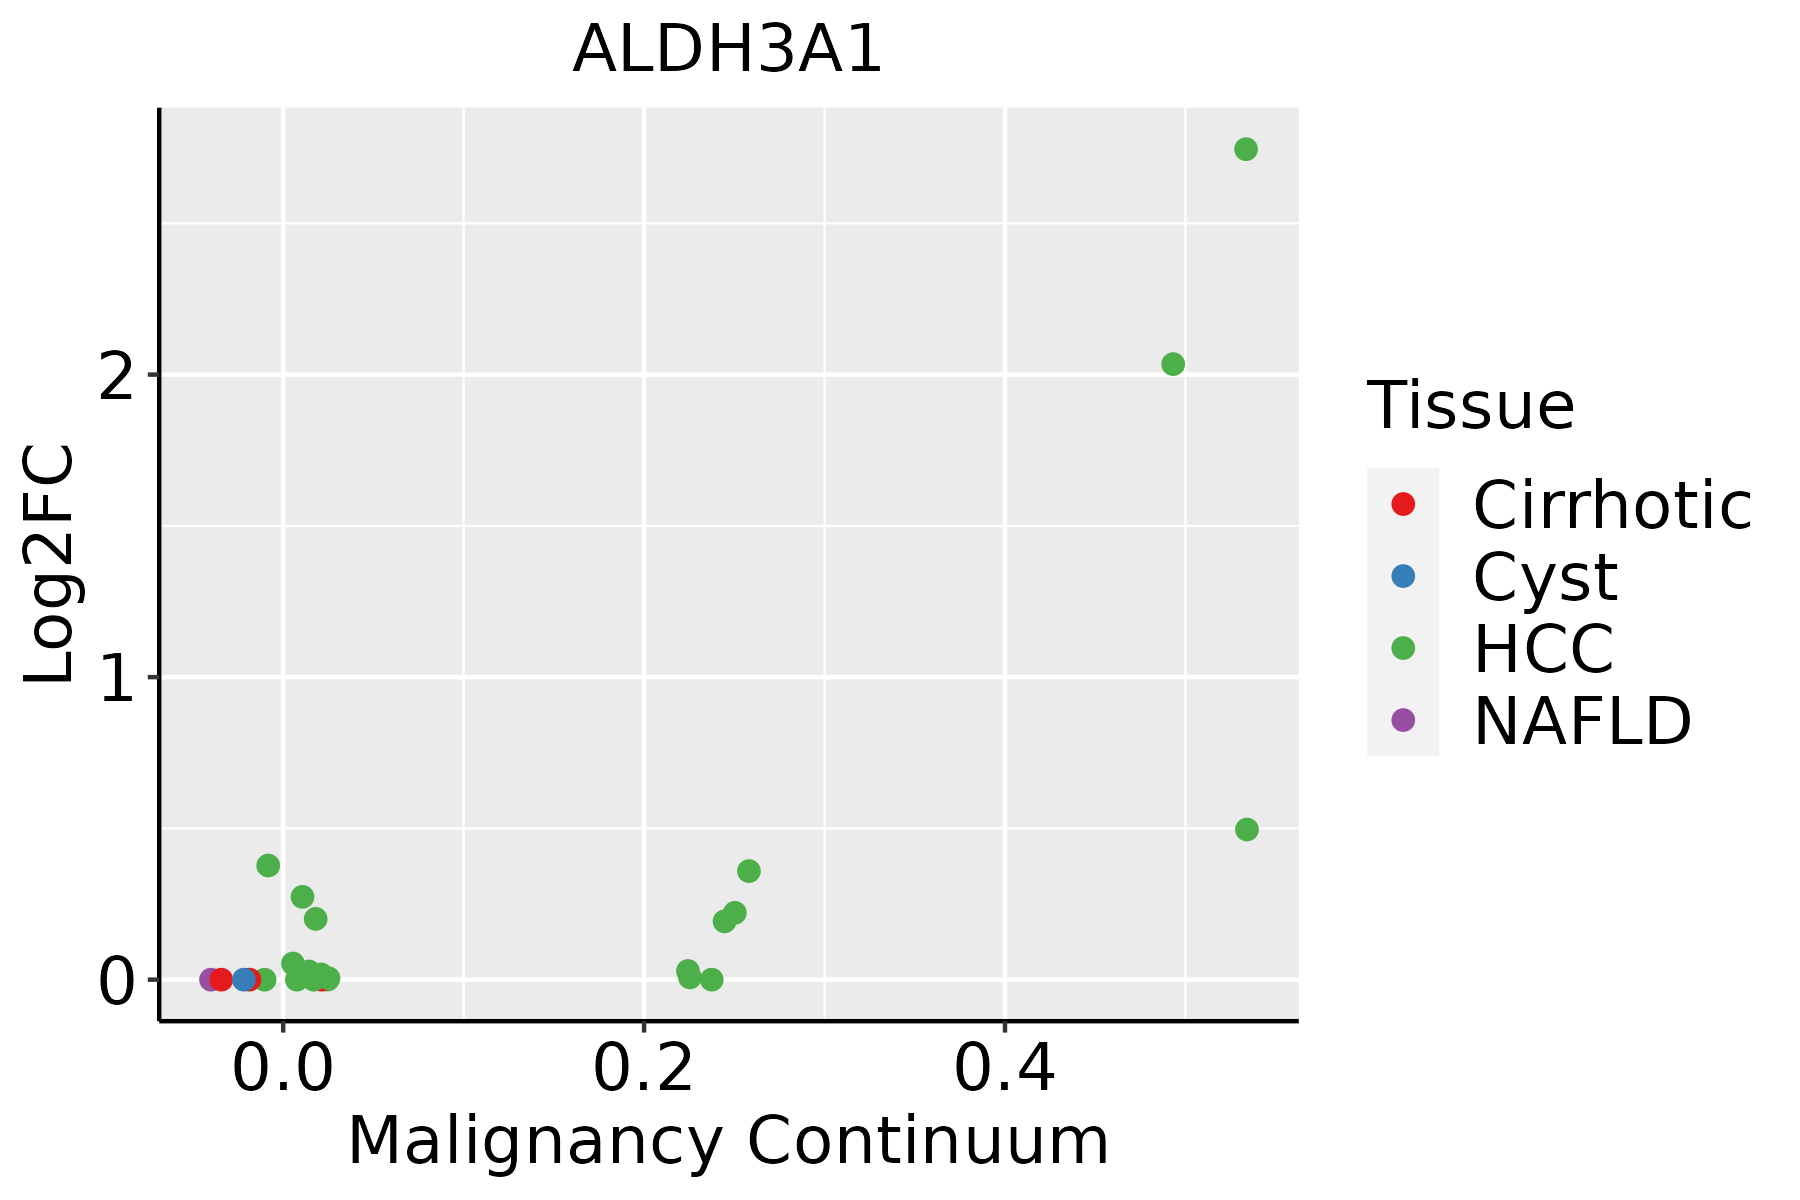 | HCC: Hepatocellular carcinoma |
| NAFLD: Non-alcoholic fatty liver disease | ||
| Oral Cavity |  | EOLP: Erosive Oral lichen planus |
| LP: leukoplakia | ||
| NEOLP: Non-erosive oral lichen planus | ||
| OSCC: Oral squamous cell carcinoma | ||
| Skin |  | AK: Actinic keratosis |
| cSCC: Cutaneous squamous cell carcinoma | ||
| SCCIS:squamous cell carcinoma in situ |
| ∗log2FC in expression of this searched gene in stem-like cells from each diseased tissue sample relative to stem-like cells in normal samples in each tissue plotted against the malignancy continuum. Samples are colored based on if they are from different disease stage. |
Top |
Malignant transformation related pathway analysis |
| Find out the enriched GO biological processes and KEGG pathways involved in transition from healthy to precancer to cancer |
| Tissue | Disease Stage | Enriched GO biological Processes |
| Colorectum | AD |  |
| Colorectum | SER |  |
| Colorectum | MSS |  |
| Colorectum | MSI-H |  |
| Colorectum | FAP |  |
| ∗Top 15 enriched GO BP terms are showed in the bar plot of each disease state in each tissue. Each row represents a significant GO biological process which is colored according to the -log10(p.adjust). |
| Page: 1 2 3 4 5 6 7 8 9 |
| GO ID | Tissue | Disease Stage | Description | Gene Ratio | Bg Ratio | pvalue | p.adjust | Count |
| GO:007048220 | Esophagus | HGIN | response to oxygen levels | 76/2587 | 347/18723 | 2.36e-05 | 6.25e-04 | 76 |
| GO:004854527 | Esophagus | HGIN | response to steroid hormone | 73/2587 | 339/18723 | 6.06e-05 | 1.40e-03 | 73 |
| GO:003629320 | Esophagus | HGIN | response to decreased oxygen levels | 70/2587 | 322/18723 | 6.23e-05 | 1.44e-03 | 70 |
| GO:000166620 | Esophagus | HGIN | response to hypoxia | 67/2587 | 307/18723 | 7.82e-05 | 1.75e-03 | 67 |
| GO:003166726 | Esophagus | HGIN | response to nutrient levels | 89/2587 | 474/18723 | 1.41e-03 | 1.64e-02 | 89 |
| GO:0031667111 | Esophagus | ESCC | response to nutrient levels | 289/8552 | 474/18723 | 9.25e-12 | 3.47e-10 | 289 |
| GO:0070482111 | Esophagus | ESCC | response to oxygen levels | 218/8552 | 347/18723 | 6.91e-11 | 2.17e-09 | 218 |
| GO:0036293111 | Esophagus | ESCC | response to decreased oxygen levels | 201/8552 | 322/18723 | 8.37e-10 | 2.04e-08 | 201 |
| GO:0001666111 | Esophagus | ESCC | response to hypoxia | 192/8552 | 307/18723 | 1.59e-09 | 3.69e-08 | 192 |
| GO:0048545111 | Esophagus | ESCC | response to steroid hormone | 204/8552 | 339/18723 | 4.47e-08 | 8.11e-07 | 204 |
| GO:000758410 | Esophagus | ESCC | response to nutrient | 114/8552 | 174/18723 | 9.43e-08 | 1.56e-06 | 114 |
| GO:000756820 | Esophagus | ESCC | aging | 201/8552 | 339/18723 | 2.64e-07 | 3.94e-06 | 201 |
| GO:000941020 | Esophagus | ESCC | response to xenobiotic stimulus | 253/8552 | 462/18723 | 4.55e-05 | 3.58e-04 | 253 |
| GO:00060818 | Esophagus | ESCC | cellular aldehyde metabolic process | 40/8552 | 60/18723 | 8.30e-04 | 4.28e-03 | 40 |
| GO:003196020 | Esophagus | ESCC | response to corticosteroid | 95/8552 | 167/18723 | 2.27e-03 | 9.99e-03 | 95 |
| GO:005138420 | Esophagus | ESCC | response to glucocorticoid | 85/8552 | 148/18723 | 2.60e-03 | 1.11e-02 | 85 |
| GO:003166722 | Liver | HCC | response to nutrient levels | 276/7958 | 474/18723 | 2.30e-12 | 1.08e-10 | 276 |
| GO:004854522 | Liver | HCC | response to steroid hormone | 206/7958 | 339/18723 | 6.81e-12 | 2.92e-10 | 206 |
| GO:000758421 | Liver | HCC | response to nutrient | 111/7958 | 174/18723 | 1.10e-08 | 2.73e-07 | 111 |
| GO:000941022 | Liver | HCC | response to xenobiotic stimulus | 248/7958 | 462/18723 | 6.47e-07 | 1.02e-05 | 248 |
| Page: 1 2 3 4 5 6 7 8 9 |
| Pathway ID | Tissue | Disease Stage | Description | Gene Ratio | Bg Ratio | pvalue | p.adjust | qvalue | Count |
| hsa0001016 | Esophagus | ESCC | Glycolysis / Gluconeogenesis | 42/4205 | 67/8465 | 2.15e-02 | 4.78e-02 | 2.45e-02 | 42 |
| hsa0001017 | Esophagus | ESCC | Glycolysis / Gluconeogenesis | 42/4205 | 67/8465 | 2.15e-02 | 4.78e-02 | 2.45e-02 | 42 |
| hsa004102 | Liver | HCC | beta-Alanine metabolism | 22/4020 | 31/8465 | 6.93e-03 | 1.92e-02 | 1.07e-02 | 22 |
| hsa004103 | Liver | HCC | beta-Alanine metabolism | 22/4020 | 31/8465 | 6.93e-03 | 1.92e-02 | 1.07e-02 | 22 |
| hsa0001014 | Oral cavity | OSCC | Glycolysis / Gluconeogenesis | 40/3704 | 67/8465 | 6.08e-03 | 1.44e-02 | 7.31e-03 | 40 |
| hsa0001015 | Oral cavity | OSCC | Glycolysis / Gluconeogenesis | 40/3704 | 67/8465 | 6.08e-03 | 1.44e-02 | 7.31e-03 | 40 |
| hsa0001023 | Oral cavity | LP | Glycolysis / Gluconeogenesis | 28/2418 | 67/8465 | 1.36e-02 | 4.44e-02 | 2.86e-02 | 28 |
| hsa0001033 | Oral cavity | LP | Glycolysis / Gluconeogenesis | 28/2418 | 67/8465 | 1.36e-02 | 4.44e-02 | 2.86e-02 | 28 |
| hsa000108 | Stomach | GC | Glycolysis / Gluconeogenesis | 14/708 | 67/8465 | 1.08e-03 | 7.69e-03 | 5.41e-03 | 14 |
| hsa00980 | Stomach | GC | Metabolism of xenobiotics by cytochrome P450 | 15/708 | 78/8465 | 1.77e-03 | 1.16e-02 | 8.15e-03 | 15 |
| hsa0001011 | Stomach | GC | Glycolysis / Gluconeogenesis | 14/708 | 67/8465 | 1.08e-03 | 7.69e-03 | 5.41e-03 | 14 |
| hsa009801 | Stomach | GC | Metabolism of xenobiotics by cytochrome P450 | 15/708 | 78/8465 | 1.77e-03 | 1.16e-02 | 8.15e-03 | 15 |
| hsa0001041 | Stomach | SIM | Glycolysis / Gluconeogenesis | 13/465 | 67/8465 | 5.81e-05 | 6.73e-04 | 5.40e-04 | 13 |
| hsa009802 | Stomach | SIM | Metabolism of xenobiotics by cytochrome P450 | 11/465 | 78/8465 | 3.37e-03 | 2.18e-02 | 1.75e-02 | 11 |
| hsa0001051 | Stomach | SIM | Glycolysis / Gluconeogenesis | 13/465 | 67/8465 | 5.81e-05 | 6.73e-04 | 5.40e-04 | 13 |
| hsa009803 | Stomach | SIM | Metabolism of xenobiotics by cytochrome P450 | 11/465 | 78/8465 | 3.37e-03 | 2.18e-02 | 1.75e-02 | 11 |
| Page: 1 |
Top |
Cell-cell communication analysis |
| Identification of potential cell-cell interactions between two cell types and their ligand-receptor pairs for different disease states |
| Ligand | Receptor | LRpair | Pathway | Tissue | Disease Stage |
| Page: 1 |
Top |
Single-cell gene regulatory network inference analysis |
| Find out the significant the regulons (TFs) and the target genes of each regulon across cell types for different disease states |
| TF | Cell Type | Tissue | Disease Stage | Target Gene | RSS | Regulon Activity |
| ∗The dot plots of a searched regulon are shown for all cell subpopulations in each disease state of each tissue based on the regulon specific score inferred using pySCENIC and by calculating the average expression. |
| Page: 1 |
Top |
Somatic mutation of malignant transformation related genes |
| Annotation of somatic variants for genes involved in malignant transformation |
| Hugo Symbol | Variant Class | Variant Classification | dbSNP RS | HGVSc | HGVSp | HGVSp Short | SWISSPROT | BIOTYPE | SIFT | PolyPhen | Tumor Sample Barcode | Tissue | Histology | Sex | Age | Stage | Therapy Types | Drugs | Outcome |
| ALDH3A1 | insertion | Frame_Shift_Ins | novel | c.1334_1335insC | p.Ser446GlufsTer51 | p.S446Efs*51 | P30838 | protein_coding | TCGA-BH-A18G-01 | Breast | breast invasive carcinoma | Female | >=65 | I/II | Unknown | Unknown | SD | ||
| ALDH3A1 | SNV | Missense_Mutation | c.982T>C | p.Ser328Pro | p.S328P | P30838 | protein_coding | deleterious(0.03) | probably_damaging(0.969) | TCGA-EA-A50E-01 | Cervix | cervical & endocervical cancer | Female | <65 | I/II | Unknown | Unknown | PD | |
| ALDH3A1 | SNV | Missense_Mutation | c.941N>A | p.Arg314His | p.R314H | P30838 | protein_coding | tolerated(0.12) | probably_damaging(0.926) | TCGA-AA-3713-01 | Colorectum | colon adenocarcinoma | Male | >=65 | III/IV | Chemotherapy | 5-fluorouracil | PR | |
| ALDH3A1 | SNV | Missense_Mutation | rs545815877 | c.440N>T | p.Ala147Val | p.A147V | P30838 | protein_coding | deleterious(0.02) | possibly_damaging(0.874) | TCGA-AA-3984-01 | Colorectum | colon adenocarcinoma | Female | <65 | I/II | Unknown | Unknown | SD |
| ALDH3A1 | SNV | Missense_Mutation | rs774092621 | c.655N>A | p.Val219Met | p.V219M | P30838 | protein_coding | deleterious(0) | probably_damaging(0.97) | TCGA-CM-5344-01 | Colorectum | colon adenocarcinoma | Female | <65 | III/IV | Chemotherapy | oxaliplatin | SD |
| ALDH3A1 | SNV | Missense_Mutation | rs780443108 | c.569N>T | p.Thr190Met | p.T190M | P30838 | protein_coding | deleterious(0.02) | benign(0.193) | TCGA-CM-6674-01 | Colorectum | colon adenocarcinoma | Male | <65 | I/II | Unknown | Unknown | SD |
| ALDH3A1 | SNV | Missense_Mutation | c.340N>C | p.Trp114Arg | p.W114R | P30838 | protein_coding | deleterious(0.01) | probably_damaging(0.999) | TCGA-G4-6302-01 | Colorectum | colon adenocarcinoma | Female | >=65 | I/II | Unknown | Unknown | SD | |
| ALDH3A1 | SNV | Missense_Mutation | rs755608749 | c.419N>T | p.Ser140Leu | p.S140L | P30838 | protein_coding | deleterious(0) | probably_damaging(0.999) | TCGA-G4-6309-01 | Colorectum | colon adenocarcinoma | Female | <65 | III/IV | Chemotherapy | xeloda | PD |
| ALDH3A1 | SNV | Missense_Mutation | novel | c.1325N>T | p.Arg442Ile | p.R442I | P30838 | protein_coding | deleterious(0) | probably_damaging(1) | TCGA-A5-A0G2-01 | Endometrium | uterine corpus endometrioid carcinoma | Female | <65 | III/IV | Unknown | Unknown | SD |
| ALDH3A1 | SNV | Missense_Mutation | rs774582773 | c.1168N>A | p.Asp390Asn | p.D390N | P30838 | protein_coding | deleterious(0.04) | possibly_damaging(0.796) | TCGA-A5-A0G2-01 | Endometrium | uterine corpus endometrioid carcinoma | Female | <65 | III/IV | Unknown | Unknown | SD |
| Page: 1 2 3 4 5 |
Top |
Related drugs of malignant transformation related genes |
| Identification of chemicals and drugs interact with genes involved in malignant transfromation |
| (DGIdb 4.0) |
| Entrez ID | Symbol | Category | Interaction Types | Drug Claim Name | Drug Name | PMIDs |
| 218 | ALDH3A1 | DRUGGABLE GENOME, ENZYME | DISULFIRAM | DISULFIRAM | 2185582 | |
| 218 | ALDH3A1 | DRUGGABLE GENOME, ENZYME | cyclophosphamide | CYCLOPHOSPHAMIDE | ||
| 218 | ALDH3A1 | DRUGGABLE GENOME, ENZYME | fluorouracil | FLUOROURACIL | ||
| 218 | ALDH3A1 | DRUGGABLE GENOME, ENZYME | ANTABUSE | ANTABUSE | 7907815 | |
| 218 | ALDH3A1 | DRUGGABLE GENOME, ENZYME | ETHANOL | ALCOHOL | 15909415,12652939,14987799 | |
| 218 | ALDH3A1 | DRUGGABLE GENOME, ENZYME | doxorubicin | DOXORUBICIN |
| Page: 1 |

Copyright 2023-Present -The University of Texas Health Science Center at Houston |