
|
|||||
|
 | |
| |
| |
| |
| |
| |
|
Gene: ALDH2 |
Gene summary for ALDH2 |
| Gene information | Species | Human | Gene symbol | ALDH2 | Gene ID | 217 |
| Gene name | aldehyde dehydrogenase 2 family member | |
| Gene Alias | ALDH-E2 | |
| Cytomap | 12q24.12 | |
| Gene Type | protein-coding | GO ID | GO:0005975 | UniProtAcc | P05091 |
Top |
Malignant transformation analysis |
| Identification of the aberrant gene expression in precancerous and cancerous lesions by comparing the gene expression of stem-like cells in diseased tissues with normal stem cells |
| Entrez ID | Symbol | Replicates | Species | Organ | Tissue | Adj P-value | Log2FC | Malignancy |
| 217 | ALDH2 | CA_HPV_3 | Human | Cervix | CC | 6.07e-07 | 2.02e-01 | 0.0414 |
| 217 | ALDH2 | N_HPV_2 | Human | Cervix | N_HPV | 7.44e-03 | 1.98e-01 | -0.0131 |
| 217 | ALDH2 | CCI_1 | Human | Cervix | CC | 9.68e-08 | -5.53e-01 | 0.528 |
| 217 | ALDH2 | CCII_1 | Human | Cervix | CC | 4.91e-10 | -5.19e-01 | 0.3249 |
| 217 | ALDH2 | sample3 | Human | Cervix | CC | 4.44e-05 | -2.64e-01 | 0.1387 |
| 217 | ALDH2 | L1 | Human | Cervix | CC | 2.24e-05 | -3.60e-01 | 0.0802 |
| 217 | ALDH2 | T1 | Human | Cervix | CC | 9.74e-05 | -3.49e-01 | 0.0918 |
| 217 | ALDH2 | T3 | Human | Cervix | CC | 2.86e-02 | -2.30e-01 | 0.1389 |
| 217 | ALDH2 | HTA11_3410_2000001011 | Human | Colorectum | AD | 2.97e-32 | 9.19e-01 | 0.0155 |
| 217 | ALDH2 | HTA11_2487_2000001011 | Human | Colorectum | SER | 4.89e-15 | 9.41e-01 | -0.1808 |
| 217 | ALDH2 | HTA11_2951_2000001011 | Human | Colorectum | AD | 5.31e-04 | 7.89e-01 | 0.0216 |
| 217 | ALDH2 | HTA11_1938_2000001011 | Human | Colorectum | AD | 1.28e-28 | 1.55e+00 | -0.0811 |
| 217 | ALDH2 | HTA11_78_2000001011 | Human | Colorectum | AD | 8.22e-28 | 1.35e+00 | -0.1088 |
| 217 | ALDH2 | HTA11_347_2000001011 | Human | Colorectum | AD | 2.20e-42 | 1.40e+00 | -0.1954 |
| 217 | ALDH2 | HTA11_411_2000001011 | Human | Colorectum | SER | 7.76e-08 | 1.24e+00 | -0.2602 |
| 217 | ALDH2 | HTA11_2112_2000001011 | Human | Colorectum | SER | 1.70e-05 | 1.30e+00 | -0.2196 |
| 217 | ALDH2 | HTA11_3361_2000001011 | Human | Colorectum | AD | 2.99e-11 | 9.66e-01 | -0.1207 |
| 217 | ALDH2 | HTA11_83_2000001011 | Human | Colorectum | SER | 1.16e-20 | 1.31e+00 | -0.1526 |
| 217 | ALDH2 | HTA11_696_2000001011 | Human | Colorectum | AD | 5.35e-32 | 1.12e+00 | -0.1464 |
| 217 | ALDH2 | HTA11_866_2000001011 | Human | Colorectum | AD | 2.71e-26 | 9.08e-01 | -0.1001 |
| Page: 1 2 3 4 5 6 7 8 9 10 |
| Tissue | Expression Dynamics | Abbreviation |
| Cervix |  | CC: Cervix cancer |
| HSIL_HPV: HPV-infected high-grade squamous intraepithelial lesions | ||
| N_HPV: HPV-infected normal cervix | ||
| Colorectum (GSE201348) |  | FAP: Familial adenomatous polyposis |
| CRC: Colorectal cancer | ||
| Colorectum (HTA11) | 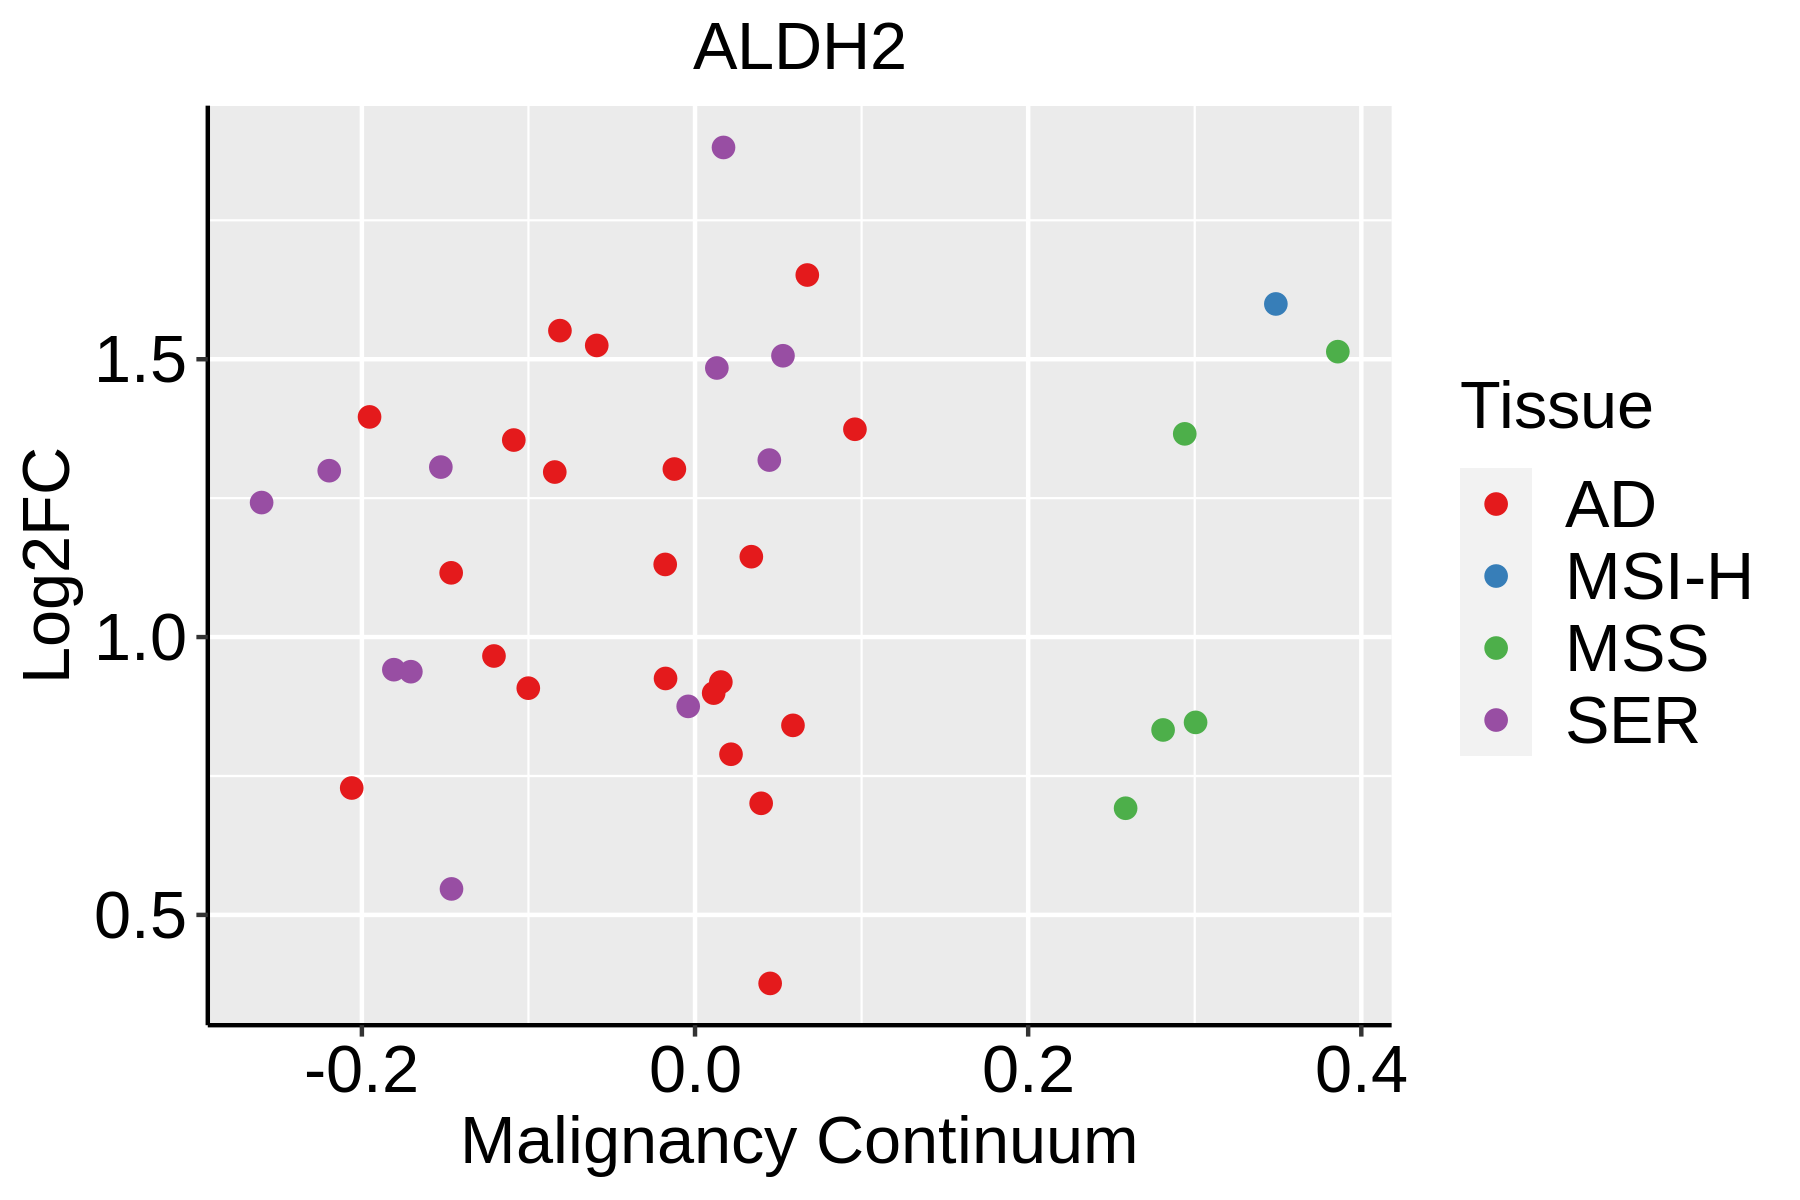 | AD: Adenomas |
| SER: Sessile serrated lesions | ||
| MSI-H: Microsatellite-high colorectal cancer | ||
| MSS: Microsatellite stable colorectal cancer | ||
| Esophagus | 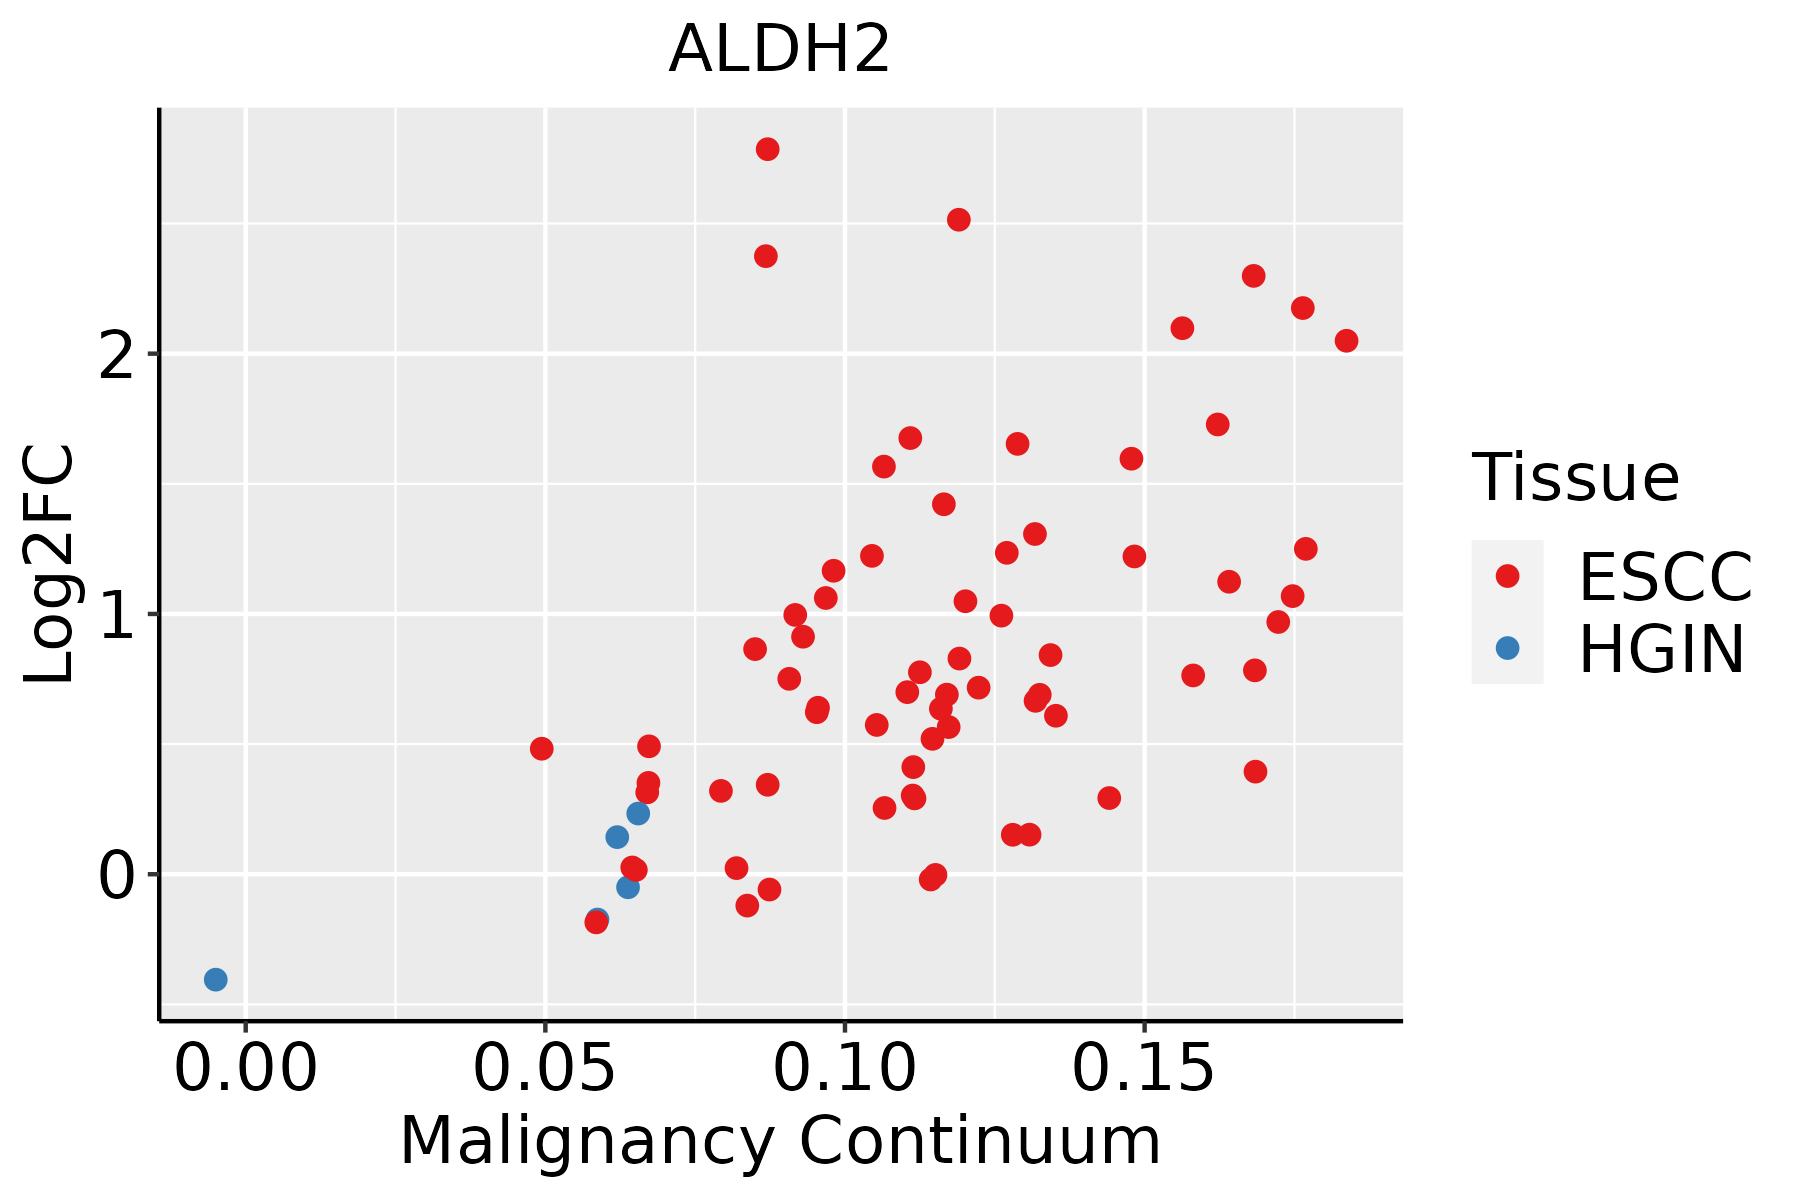 | ESCC: Esophageal squamous cell carcinoma |
| HGIN: High-grade intraepithelial neoplasias | ||
| LGIN: Low-grade intraepithelial neoplasias | ||
| Liver |  | HCC: Hepatocellular carcinoma |
| NAFLD: Non-alcoholic fatty liver disease | ||
| Lung | 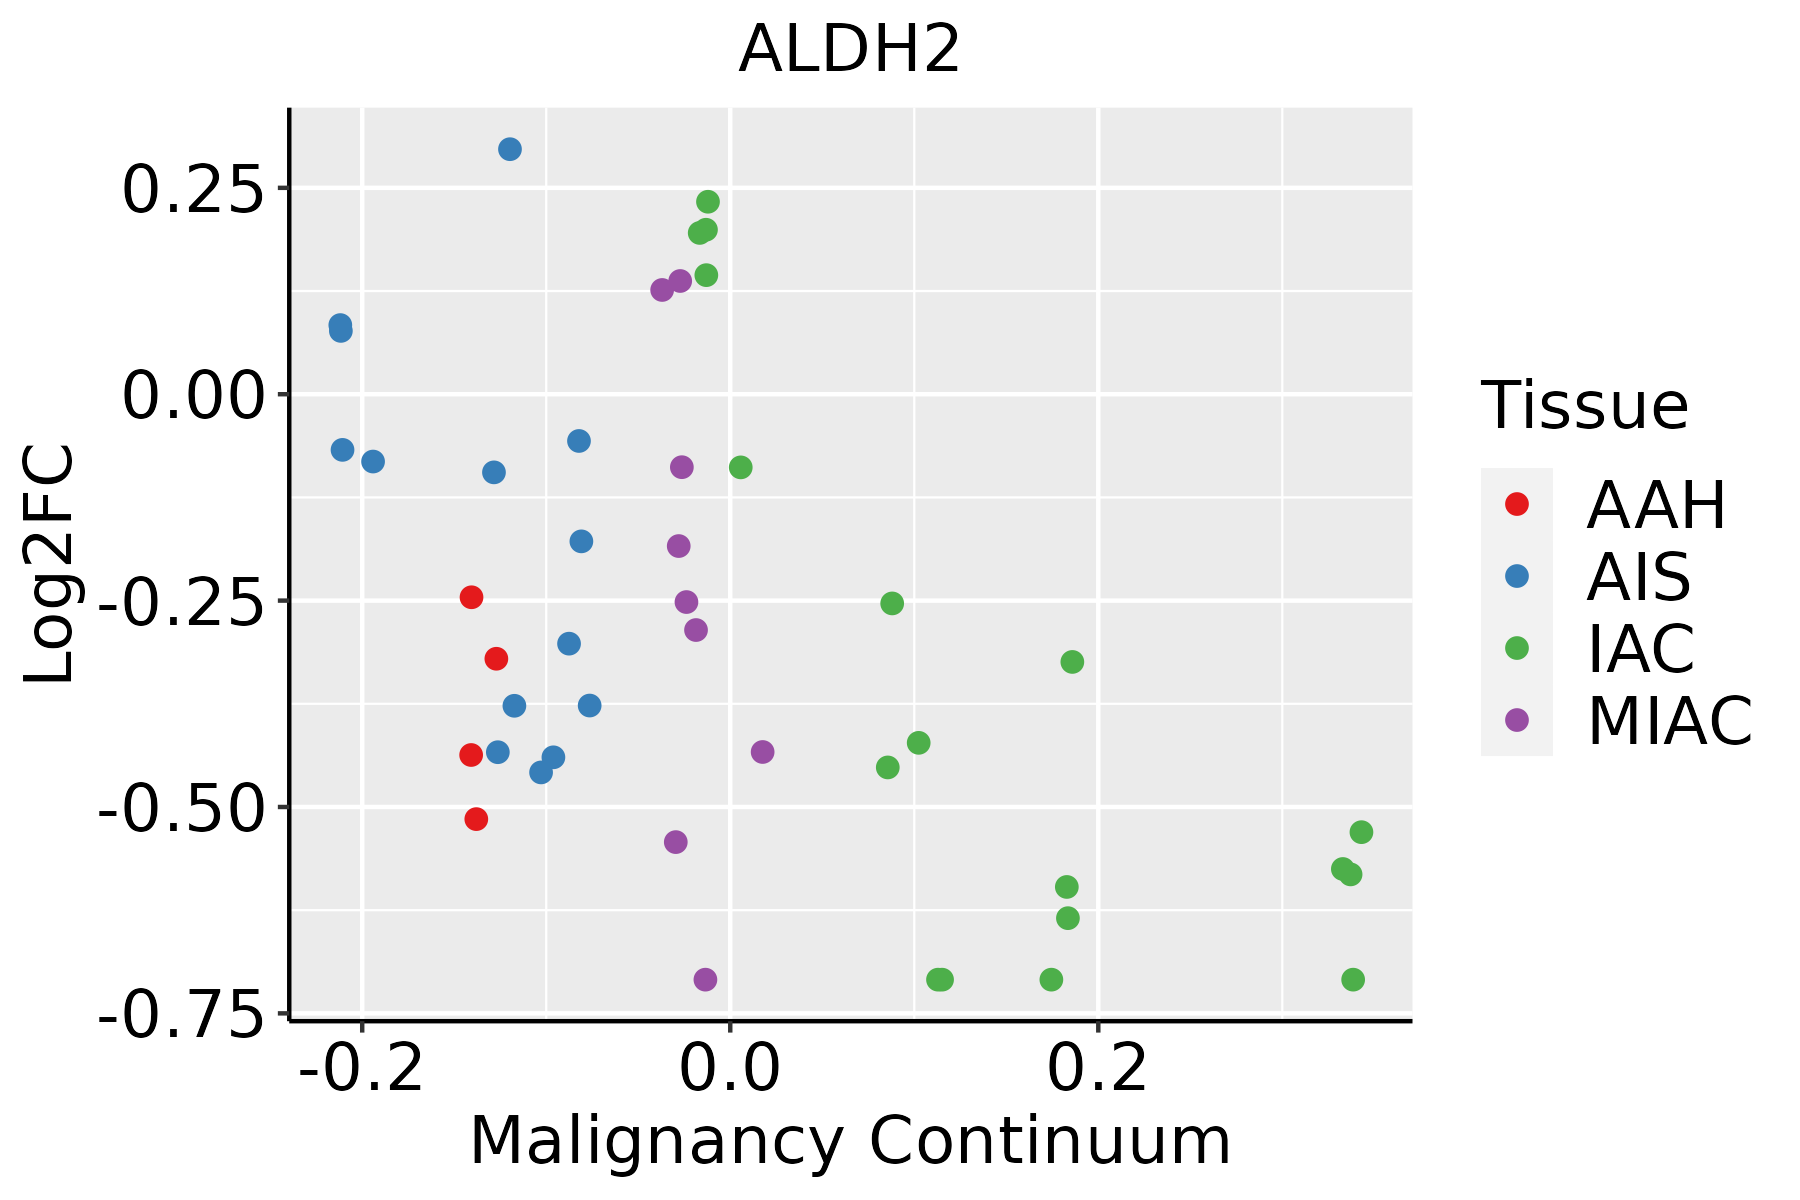 | AAH: Atypical adenomatous hyperplasia |
| AIS: Adenocarcinoma in situ | ||
| IAC: Invasive lung adenocarcinoma | ||
| MIA: Minimally invasive adenocarcinoma | ||
| Oral Cavity | 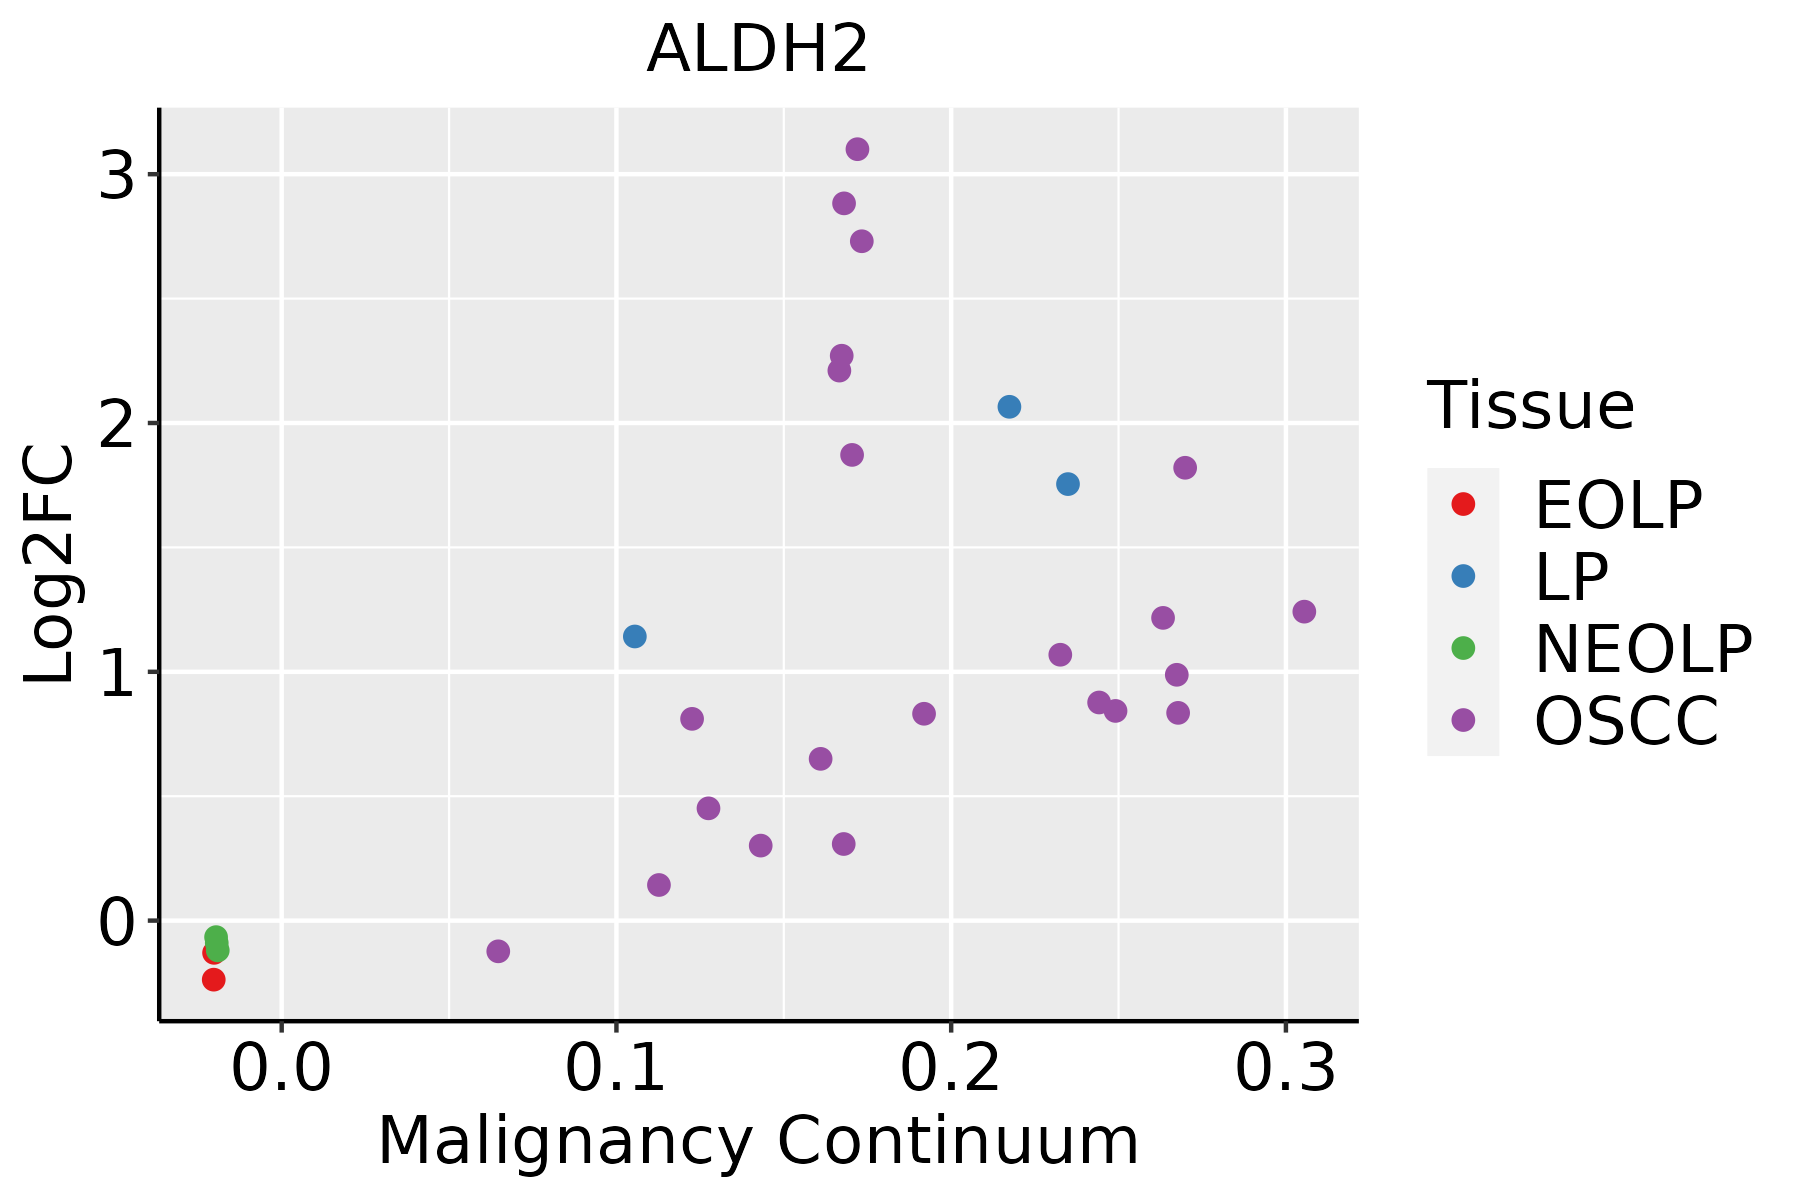 | EOLP: Erosive Oral lichen planus |
| LP: leukoplakia | ||
| NEOLP: Non-erosive oral lichen planus | ||
| OSCC: Oral squamous cell carcinoma | ||
| Prostate |  | BPH: Benign Prostatic Hyperplasia |
| Skin | 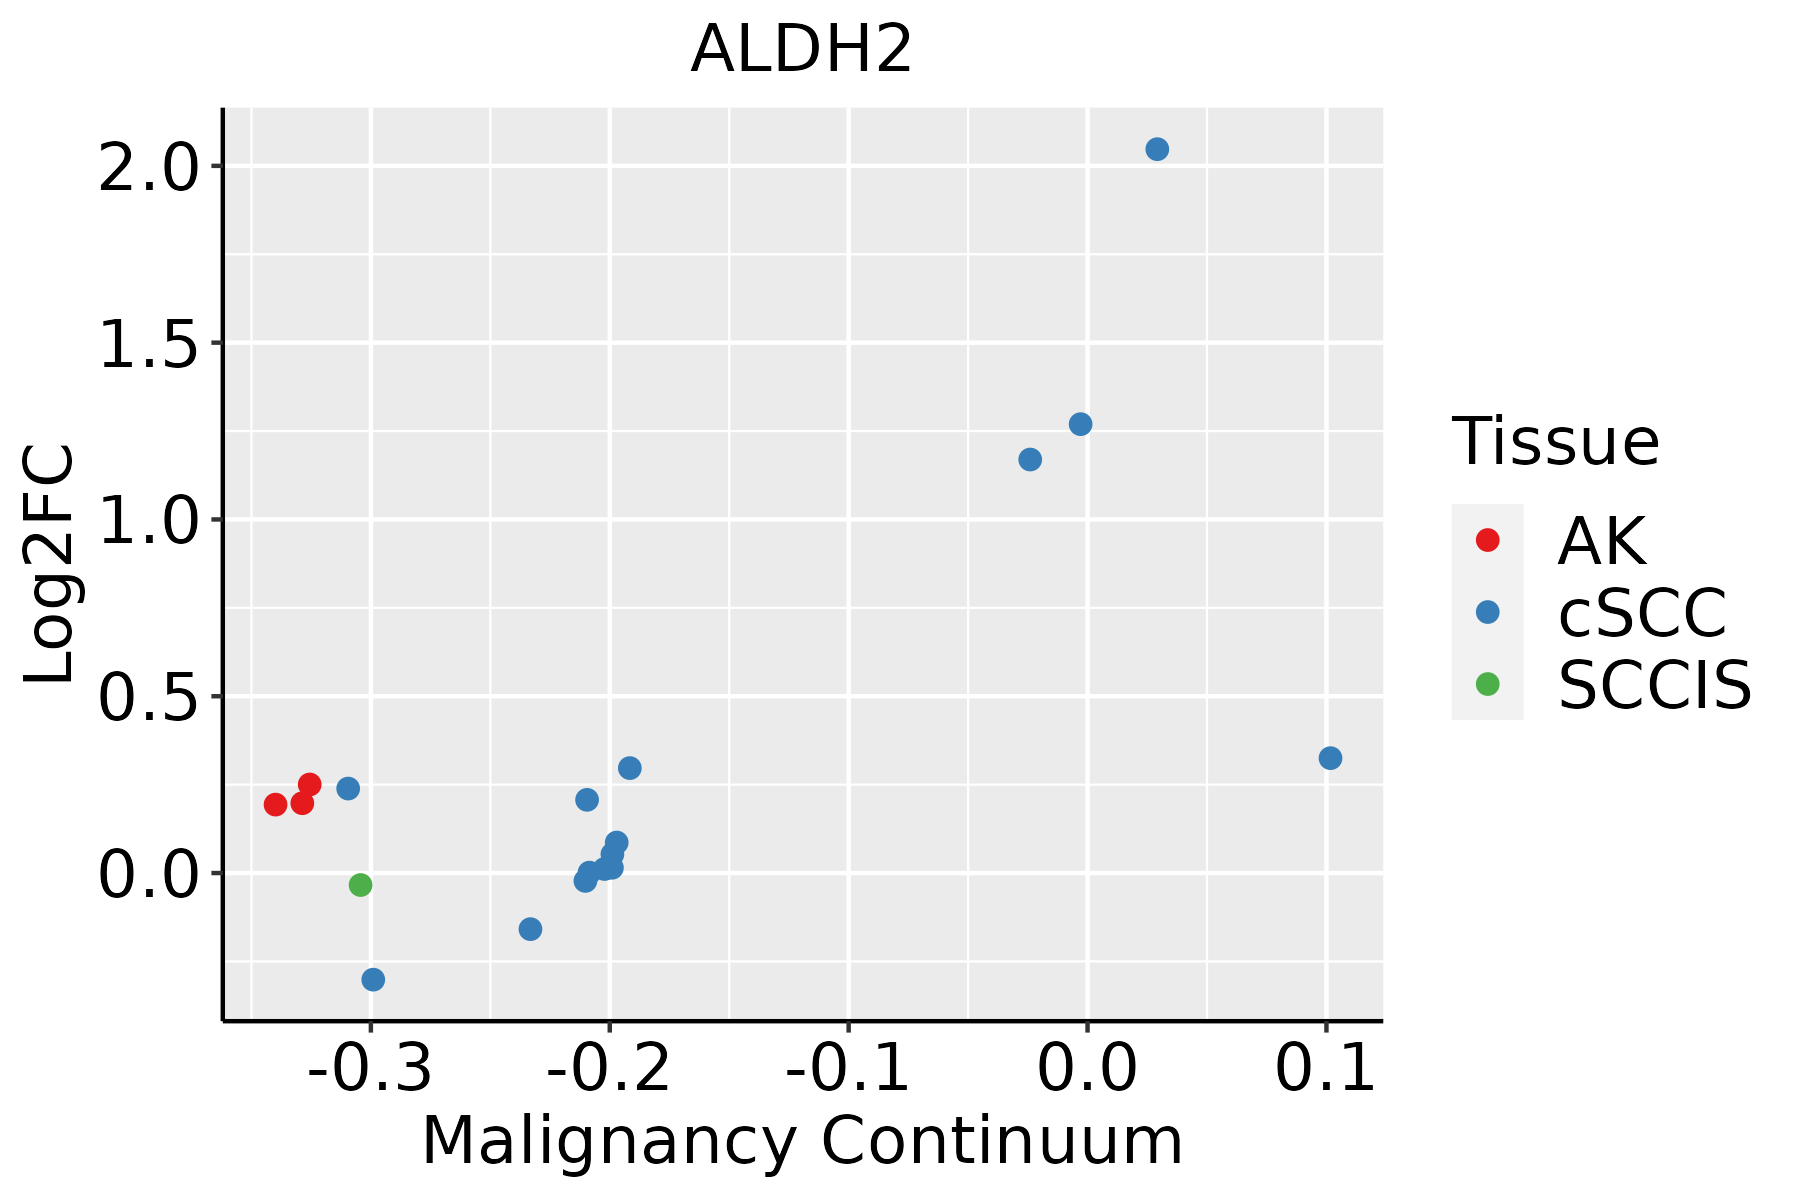 | AK: Actinic keratosis |
| cSCC: Cutaneous squamous cell carcinoma | ||
| SCCIS:squamous cell carcinoma in situ | ||
| Thyroid | 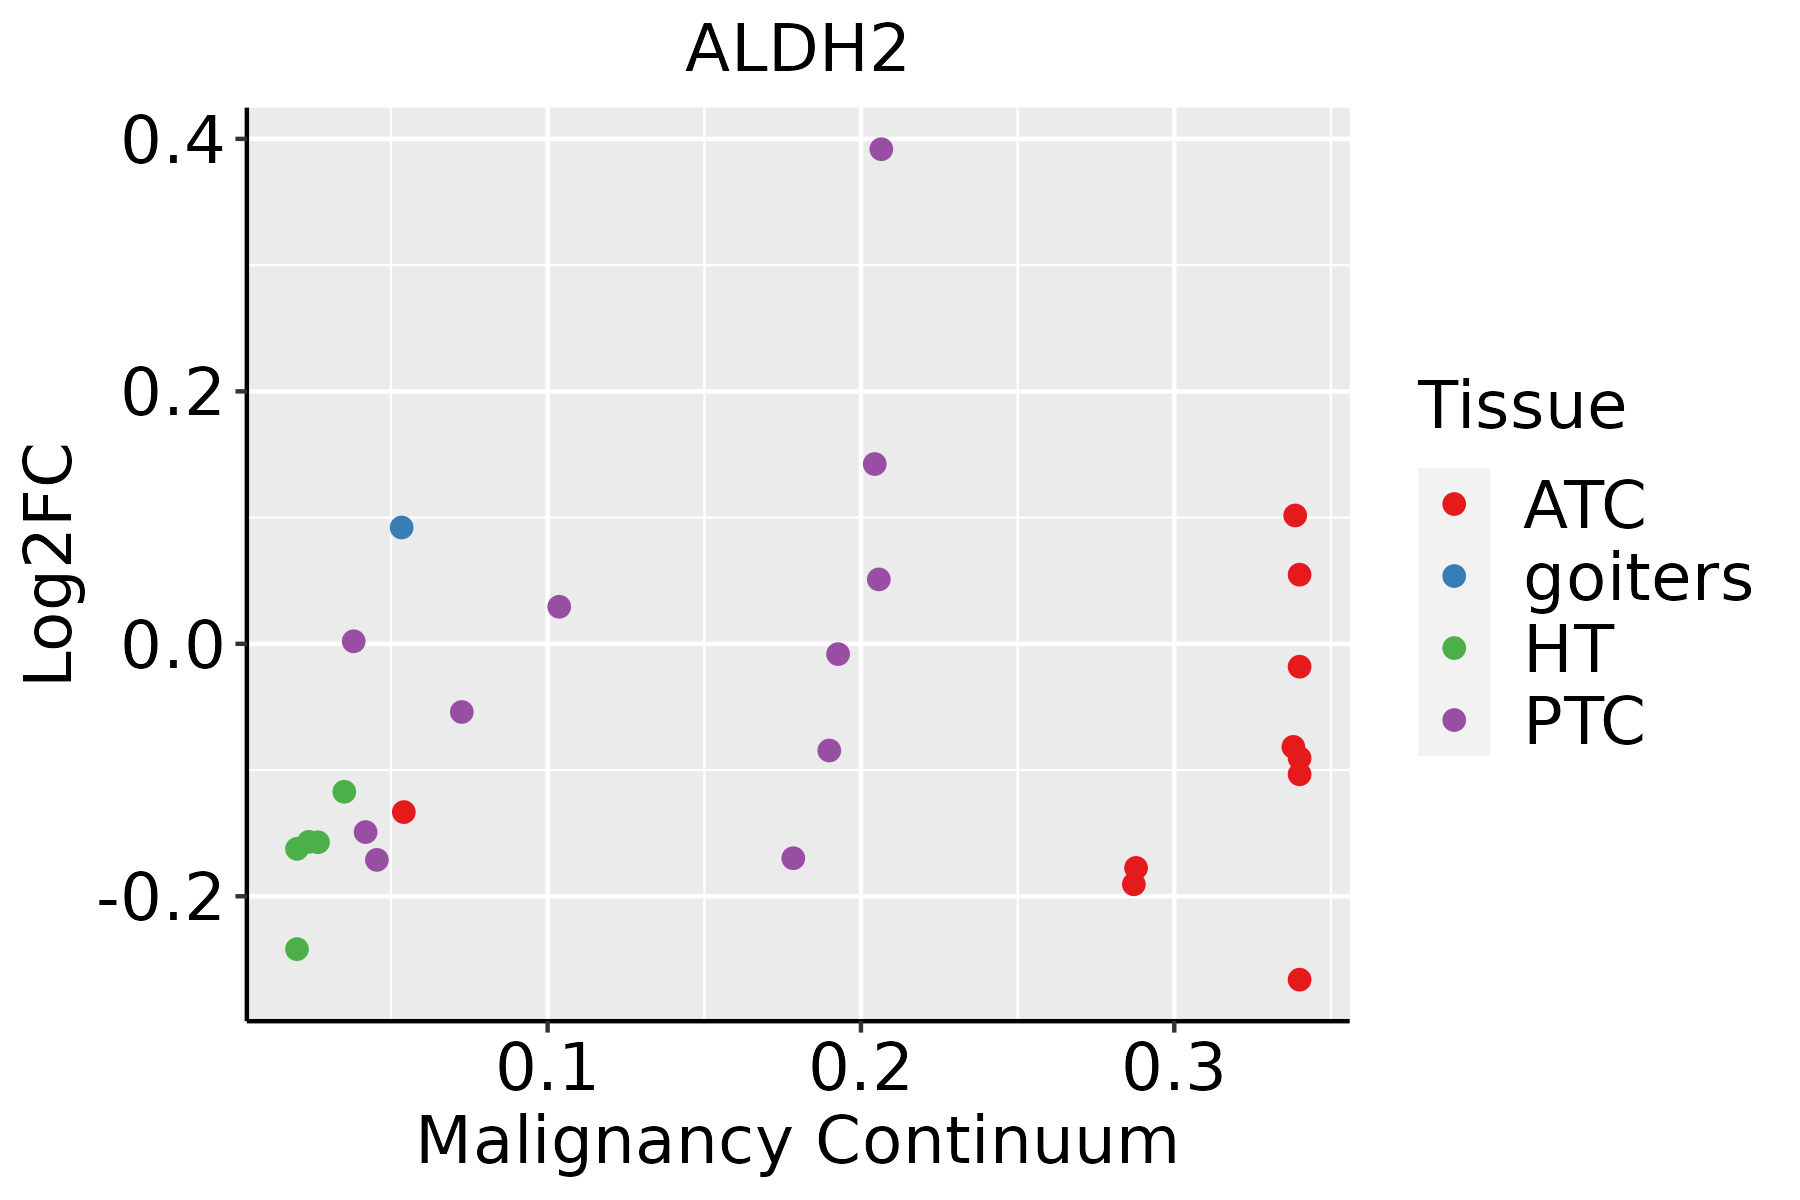 | ATC: Anaplastic thyroid cancer |
| HT: Hashimoto's thyroiditis | ||
| PTC: Papillary thyroid cancer |
| ∗log2FC in expression of this searched gene in stem-like cells from each diseased tissue sample relative to stem-like cells in normal samples in each tissue plotted against the malignancy continuum. Samples are colored based on if they are from different disease stage. |
Top |
Malignant transformation related pathway analysis |
| Find out the enriched GO biological processes and KEGG pathways involved in transition from healthy to precancer to cancer |
| Tissue | Disease Stage | Enriched GO biological Processes |
| Colorectum | AD |  |
| Colorectum | SER |  |
| Colorectum | MSS |  |
| Colorectum | MSI-H |  |
| Colorectum | FAP |  |
| ∗Top 15 enriched GO BP terms are showed in the bar plot of each disease state in each tissue. Each row represents a significant GO biological process which is colored according to the -log10(p.adjust). |
| Page: 1 2 3 4 5 6 7 8 9 |
| GO ID | Tissue | Disease Stage | Description | Gene Ratio | Bg Ratio | pvalue | p.adjust | Count |
| GO:00229009 | Cervix | CC | electron transport chain | 53/2311 | 175/18723 | 2.23e-10 | 3.43e-08 | 53 |
| GO:00060919 | Cervix | CC | generation of precursor metabolites and energy | 105/2311 | 490/18723 | 7.40e-09 | 6.61e-07 | 105 |
| GO:000609124 | Cervix | N_HPV | generation of precursor metabolites and energy | 40/534 | 490/18723 | 2.59e-09 | 7.88e-07 | 40 |
| GO:002290024 | Cervix | N_HPV | electron transport chain | 21/534 | 175/18723 | 2.95e-08 | 3.63e-06 | 21 |
| GO:0006091 | Colorectum | AD | generation of precursor metabolites and energy | 209/3918 | 490/18723 | 3.17e-28 | 6.61e-25 | 209 |
| GO:0022900 | Colorectum | AD | electron transport chain | 89/3918 | 175/18723 | 1.42e-18 | 8.91e-16 | 89 |
| GO:0044282 | Colorectum | AD | small molecule catabolic process | 118/3918 | 376/18723 | 1.05e-06 | 3.55e-05 | 118 |
| GO:0006066 | Colorectum | AD | alcohol metabolic process | 106/3918 | 353/18723 | 3.02e-05 | 5.57e-04 | 106 |
| GO:0034310 | Colorectum | AD | primary alcohol catabolic process | 9/3918 | 15/18723 | 1.11e-03 | 1.01e-02 | 9 |
| GO:0034308 | Colorectum | AD | primary alcohol metabolic process | 35/3918 | 102/18723 | 1.16e-03 | 1.05e-02 | 35 |
| GO:0006067 | Colorectum | AD | ethanol metabolic process | 11/3918 | 21/18723 | 1.43e-03 | 1.22e-02 | 11 |
| GO:0006068 | Colorectum | AD | ethanol catabolic process | 7/3918 | 12/18723 | 5.09e-03 | 3.38e-02 | 7 |
| GO:0046164 | Colorectum | AD | alcohol catabolic process | 20/3918 | 55/18723 | 6.03e-03 | 3.78e-02 | 20 |
| GO:00060911 | Colorectum | SER | generation of precursor metabolites and energy | 168/2897 | 490/18723 | 1.39e-25 | 1.70e-22 | 168 |
| GO:00229001 | Colorectum | SER | electron transport chain | 77/2897 | 175/18723 | 1.77e-19 | 1.36e-16 | 77 |
| GO:00442821 | Colorectum | SER | small molecule catabolic process | 87/2897 | 376/18723 | 5.31e-05 | 1.27e-03 | 87 |
| GO:00060661 | Colorectum | SER | alcohol metabolic process | 79/2897 | 353/18723 | 3.50e-04 | 5.50e-03 | 79 |
| GO:00343101 | Colorectum | SER | primary alcohol catabolic process | 8/2897 | 15/18723 | 7.51e-04 | 9.68e-03 | 8 |
| GO:00461641 | Colorectum | SER | alcohol catabolic process | 17/2897 | 55/18723 | 3.00e-03 | 2.65e-02 | 17 |
| GO:00060681 | Colorectum | SER | ethanol catabolic process | 6/2897 | 12/18723 | 5.42e-03 | 4.03e-02 | 6 |
| Page: 1 2 3 4 |
| Pathway ID | Tissue | Disease Stage | Description | Gene Ratio | Bg Ratio | pvalue | p.adjust | qvalue | Count |
| hsa00620 | Colorectum | AD | Pyruvate metabolism | 28/2092 | 47/8465 | 3.71e-07 | 5.41e-06 | 3.45e-06 | 28 |
| hsa00010 | Colorectum | AD | Glycolysis / Gluconeogenesis | 34/2092 | 67/8465 | 3.63e-06 | 4.34e-05 | 2.77e-05 | 34 |
| hsa00280 | Colorectum | AD | Valine, leucine and isoleucine degradation | 25/2092 | 48/8465 | 3.97e-05 | 3.41e-04 | 2.18e-04 | 25 |
| hsa00330 | Colorectum | AD | Arginine and proline metabolism | 23/2092 | 50/8465 | 8.27e-04 | 5.90e-03 | 3.76e-03 | 23 |
| hsa00310 | Colorectum | AD | Lysine degradation | 27/2092 | 63/8465 | 1.17e-03 | 7.75e-03 | 4.94e-03 | 27 |
| hsa00071 | Colorectum | AD | Fatty acid degradation | 20/2092 | 43/8465 | 1.50e-03 | 8.69e-03 | 5.54e-03 | 20 |
| hsa00561 | Colorectum | AD | Glycerolipid metabolism | 24/2092 | 63/8465 | 1.25e-02 | 4.54e-02 | 2.90e-02 | 24 |
| hsa006201 | Colorectum | AD | Pyruvate metabolism | 28/2092 | 47/8465 | 3.71e-07 | 5.41e-06 | 3.45e-06 | 28 |
| hsa000101 | Colorectum | AD | Glycolysis / Gluconeogenesis | 34/2092 | 67/8465 | 3.63e-06 | 4.34e-05 | 2.77e-05 | 34 |
| hsa002801 | Colorectum | AD | Valine, leucine and isoleucine degradation | 25/2092 | 48/8465 | 3.97e-05 | 3.41e-04 | 2.18e-04 | 25 |
| hsa003301 | Colorectum | AD | Arginine and proline metabolism | 23/2092 | 50/8465 | 8.27e-04 | 5.90e-03 | 3.76e-03 | 23 |
| hsa003101 | Colorectum | AD | Lysine degradation | 27/2092 | 63/8465 | 1.17e-03 | 7.75e-03 | 4.94e-03 | 27 |
| hsa000711 | Colorectum | AD | Fatty acid degradation | 20/2092 | 43/8465 | 1.50e-03 | 8.69e-03 | 5.54e-03 | 20 |
| hsa005611 | Colorectum | AD | Glycerolipid metabolism | 24/2092 | 63/8465 | 1.25e-02 | 4.54e-02 | 2.90e-02 | 24 |
| hsa006202 | Colorectum | SER | Pyruvate metabolism | 22/1580 | 47/8465 | 9.62e-06 | 1.33e-04 | 9.67e-05 | 22 |
| hsa000102 | Colorectum | SER | Glycolysis / Gluconeogenesis | 24/1580 | 67/8465 | 6.62e-04 | 5.36e-03 | 3.89e-03 | 24 |
| hsa003302 | Colorectum | SER | Arginine and proline metabolism | 17/1580 | 50/8465 | 7.12e-03 | 3.77e-02 | 2.74e-02 | 17 |
| hsa000712 | Colorectum | SER | Fatty acid degradation | 15/1580 | 43/8465 | 8.60e-03 | 4.26e-02 | 3.09e-02 | 15 |
| hsa006203 | Colorectum | SER | Pyruvate metabolism | 22/1580 | 47/8465 | 9.62e-06 | 1.33e-04 | 9.67e-05 | 22 |
| hsa000103 | Colorectum | SER | Glycolysis / Gluconeogenesis | 24/1580 | 67/8465 | 6.62e-04 | 5.36e-03 | 3.89e-03 | 24 |
| Page: 1 2 3 4 5 6 7 |
Top |
Cell-cell communication analysis |
| Identification of potential cell-cell interactions between two cell types and their ligand-receptor pairs for different disease states |
| Ligand | Receptor | LRpair | Pathway | Tissue | Disease Stage |
| Page: 1 |
Top |
Single-cell gene regulatory network inference analysis |
| Find out the significant the regulons (TFs) and the target genes of each regulon across cell types for different disease states |
| TF | Cell Type | Tissue | Disease Stage | Target Gene | RSS | Regulon Activity |
| ∗The dot plots of a searched regulon are shown for all cell subpopulations in each disease state of each tissue based on the regulon specific score inferred using pySCENIC and by calculating the average expression. |
| Page: 1 |
Top |
Somatic mutation of malignant transformation related genes |
| Annotation of somatic variants for genes involved in malignant transformation |
| Hugo Symbol | Variant Class | Variant Classification | dbSNP RS | HGVSc | HGVSp | HGVSp Short | SWISSPROT | BIOTYPE | SIFT | PolyPhen | Tumor Sample Barcode | Tissue | Histology | Sex | Age | Stage | Therapy Types | Drugs | Outcome |
| ALDH2 | SNV | Missense_Mutation | rs757893333 | c.1394N>T | p.Ala465Val | p.A465V | P05091 | protein_coding | tolerated(0.09) | benign(0.312) | TCGA-5L-AAT0-01 | Breast | breast invasive carcinoma | Female | <65 | I/II | Hormone Therapy | tamoxiphen | SD |
| ALDH2 | insertion | In_Frame_Ins | novel | c.773_774insCCC | p.Val258_Ala259insPro | p.V258_A259insP | P05091 | protein_coding | TCGA-A8-A07U-01 | Breast | breast invasive carcinoma | Female | >=65 | III/IV | Chemotherapy | 5-fluorouracil | SD | ||
| ALDH2 | insertion | Frame_Shift_Ins | novel | c.845_846insTCTGAGAAGG | p.Thr283LeufsTer54 | p.T283Lfs*54 | P05091 | protein_coding | TCGA-AR-A0TY-01 | Breast | breast invasive carcinoma | Female | <65 | I/II | Unspecific | Paclitaxel | PD | ||
| ALDH2 | SNV | Missense_Mutation | novel | c.238N>T | p.Val80Leu | p.V80L | P05091 | protein_coding | deleterious(0) | possibly_damaging(0.797) | TCGA-2W-A8YY-01 | Cervix | cervical & endocervical cancer | Female | <65 | I/II | Chemotherapy | cisplatin | CR |
| ALDH2 | SNV | Missense_Mutation | novel | c.127N>G | p.Asn43Asp | p.N43D | P05091 | protein_coding | deleterious(0.01) | possibly_damaging(0.894) | TCGA-EA-A410-01 | Cervix | cervical & endocervical cancer | Female | <65 | I/II | Unknown | Unknown | SD |
| ALDH2 | SNV | Missense_Mutation | c.988N>A | p.Asp330Asn | p.D330N | P05091 | protein_coding | tolerated(0.23) | benign(0.001) | TCGA-EK-A2R8-01 | Cervix | cervical & endocervical cancer | Female | <65 | I/II | Unknown | Unknown | SD | |
| ALDH2 | SNV | Missense_Mutation | c.571A>G | p.Met191Val | p.M191V | P05091 | protein_coding | deleterious(0) | probably_damaging(0.951) | TCGA-AA-3663-01 | Colorectum | colon adenocarcinoma | Male | <65 | I/II | Unknown | Unknown | SD | |
| ALDH2 | SNV | Missense_Mutation | c.740N>T | p.Ala247Val | p.A247V | P05091 | protein_coding | deleterious(0.02) | possibly_damaging(0.453) | TCGA-AA-3864-01 | Colorectum | colon adenocarcinoma | Male | >=65 | I/II | Unknown | Unknown | SD | |
| ALDH2 | SNV | Missense_Mutation | c.414N>G | p.Asp138Glu | p.D138E | P05091 | protein_coding | tolerated(0.17) | possibly_damaging(0.632) | TCGA-AA-A022-01 | Colorectum | colon adenocarcinoma | Female | >=65 | I/II | Unknown | Unknown | SD | |
| ALDH2 | SNV | Missense_Mutation | rs372769067 | c.1145C>T | p.Ala382Val | p.A382V | P05091 | protein_coding | deleterious(0.01) | probably_damaging(0.982) | TCGA-AM-5821-01 | Colorectum | colon adenocarcinoma | Female | >=65 | I/II | Unknown | Unknown | SD |
| Page: 1 2 3 4 5 |
Top |
Related drugs of malignant transformation related genes |
| Identification of chemicals and drugs interact with genes involved in malignant transfromation |
| (DGIdb 4.0) |
| Entrez ID | Symbol | Category | Interaction Types | Drug Claim Name | Drug Name | PMIDs |
| 217 | ALDH2 | ENZYME, CLINICALLY ACTIONABLE, DRUGGABLE GENOME | ANS-6637 | |||
| 217 | ALDH2 | ENZYME, CLINICALLY ACTIONABLE, DRUGGABLE GENOME | inhibitor | CHEMBL964 | DISULFIRAM | |
| 217 | ALDH2 | ENZYME, CLINICALLY ACTIONABLE, DRUGGABLE GENOME | DISULFIRAM | DISULFIRAM | ||
| 217 | ALDH2 | ENZYME, CLINICALLY ACTIONABLE, DRUGGABLE GENOME | inhibitor | 178103501 | PRUNETIN | |
| 217 | ALDH2 | ENZYME, CLINICALLY ACTIONABLE, DRUGGABLE GENOME | acetaldehyde | ACETALDEHYDE | 31002879 | |
| 217 | ALDH2 | ENZYME, CLINICALLY ACTIONABLE, DRUGGABLE GENOME | heroin | DIACETYLMORPHINE | 21723677 | |
| 217 | ALDH2 | ENZYME, CLINICALLY ACTIONABLE, DRUGGABLE GENOME | ALD-401 | |||
| 217 | ALDH2 | ENZYME, CLINICALLY ACTIONABLE, DRUGGABLE GENOME | DISULFIRAM | DISULFIRAM | ||
| 217 | ALDH2 | ENZYME, CLINICALLY ACTIONABLE, DRUGGABLE GENOME | FP-045 | |||
| 217 | ALDH2 | ENZYME, CLINICALLY ACTIONABLE, DRUGGABLE GENOME | ETHANOL | ALCOHOL | 8986223 |
| Page: 1 2 |

Copyright 2023-Present -The University of Texas Health Science Center at Houston |