
|
|||||
|
 | |
| |
| |
| |
| |
| |
|
Gene: ALDH1L1 |
Gene summary for ALDH1L1 |
| Gene information | Species | Human | Gene symbol | ALDH1L1 | Gene ID | 10840 |
| Gene name | aldehyde dehydrogenase 1 family member L1 | |
| Gene Alias | 10-FTHFDH | |
| Cytomap | 3q21.3 | |
| Gene Type | protein-coding | GO ID | GO:0006082 | UniProtAcc | O75891 |
Top |
Malignant transformation analysis |
| Identification of the aberrant gene expression in precancerous and cancerous lesions by comparing the gene expression of stem-like cells in diseased tissues with normal stem cells |
| Entrez ID | Symbol | Replicates | Species | Organ | Tissue | Adj P-value | Log2FC | Malignancy |
| 10840 | ALDH1L1 | HTA11_2487_2000001011 | Human | Colorectum | SER | 2.68e-16 | 6.51e-01 | -0.1808 |
| 10840 | ALDH1L1 | HTA11_1938_2000001011 | Human | Colorectum | AD | 2.50e-13 | 4.91e-01 | -0.0811 |
| 10840 | ALDH1L1 | HTA11_78_2000001011 | Human | Colorectum | AD | 1.64e-07 | 3.25e-01 | -0.1088 |
| 10840 | ALDH1L1 | HTA11_83_2000001011 | Human | Colorectum | SER | 2.59e-10 | 5.00e-01 | -0.1526 |
| 10840 | ALDH1L1 | HTA11_866_2000001011 | Human | Colorectum | AD | 1.66e-06 | 3.37e-01 | -0.1001 |
| 10840 | ALDH1L1 | HTA11_1391_2000001011 | Human | Colorectum | AD | 4.70e-11 | 4.70e-01 | -0.059 |
| 10840 | ALDH1L1 | HTA11_10711_2000001011 | Human | Colorectum | AD | 1.65e-04 | 2.40e-01 | 0.0338 |
| 10840 | ALDH1L1 | HTA11_7696_3000711011 | Human | Colorectum | AD | 6.76e-03 | 2.11e-01 | 0.0674 |
| 10840 | ALDH1L1 | NAFLD1 | Human | Liver | NAFLD | 2.36e-10 | 6.79e-01 | -0.04 |
| 10840 | ALDH1L1 | S43 | Human | Liver | Cirrhotic | 6.60e-10 | -2.78e-01 | -0.0187 |
| 10840 | ALDH1L1 | HCC1_Meng | Human | Liver | HCC | 5.43e-65 | -2.88e-02 | 0.0246 |
| 10840 | ALDH1L1 | HCC2_Meng | Human | Liver | HCC | 1.51e-08 | -3.00e-01 | 0.0107 |
| 10840 | ALDH1L1 | cirrhotic1 | Human | Liver | Cirrhotic | 1.10e-04 | -2.49e-01 | 0.0202 |
| 10840 | ALDH1L1 | cirrhotic2 | Human | Liver | Cirrhotic | 1.20e-06 | -2.68e-01 | 0.0201 |
| 10840 | ALDH1L1 | HCC1 | Human | Liver | HCC | 1.15e-41 | 6.33e+00 | 0.5336 |
| 10840 | ALDH1L1 | HCC2 | Human | Liver | HCC | 7.94e-46 | 5.35e+00 | 0.5341 |
| 10840 | ALDH1L1 | HCC5 | Human | Liver | HCC | 1.11e-04 | 3.49e+00 | 0.4932 |
| 10840 | ALDH1L1 | Pt13.b | Human | Liver | HCC | 2.93e-09 | -4.58e-02 | 0.0251 |
| 10840 | ALDH1L1 | Pt14.a | Human | Liver | HCC | 3.63e-02 | 1.95e-01 | 0.0169 |
| 10840 | ALDH1L1 | Pt14.b | Human | Liver | HCC | 1.62e-10 | 5.15e-01 | 0.018 |
| Page: 1 2 |
| Tissue | Expression Dynamics | Abbreviation |
| Colorectum (GSE201348) |  | FAP: Familial adenomatous polyposis |
| CRC: Colorectal cancer | ||
| Colorectum (HTA11) |  | AD: Adenomas |
| SER: Sessile serrated lesions | ||
| MSI-H: Microsatellite-high colorectal cancer | ||
| MSS: Microsatellite stable colorectal cancer | ||
| Liver | 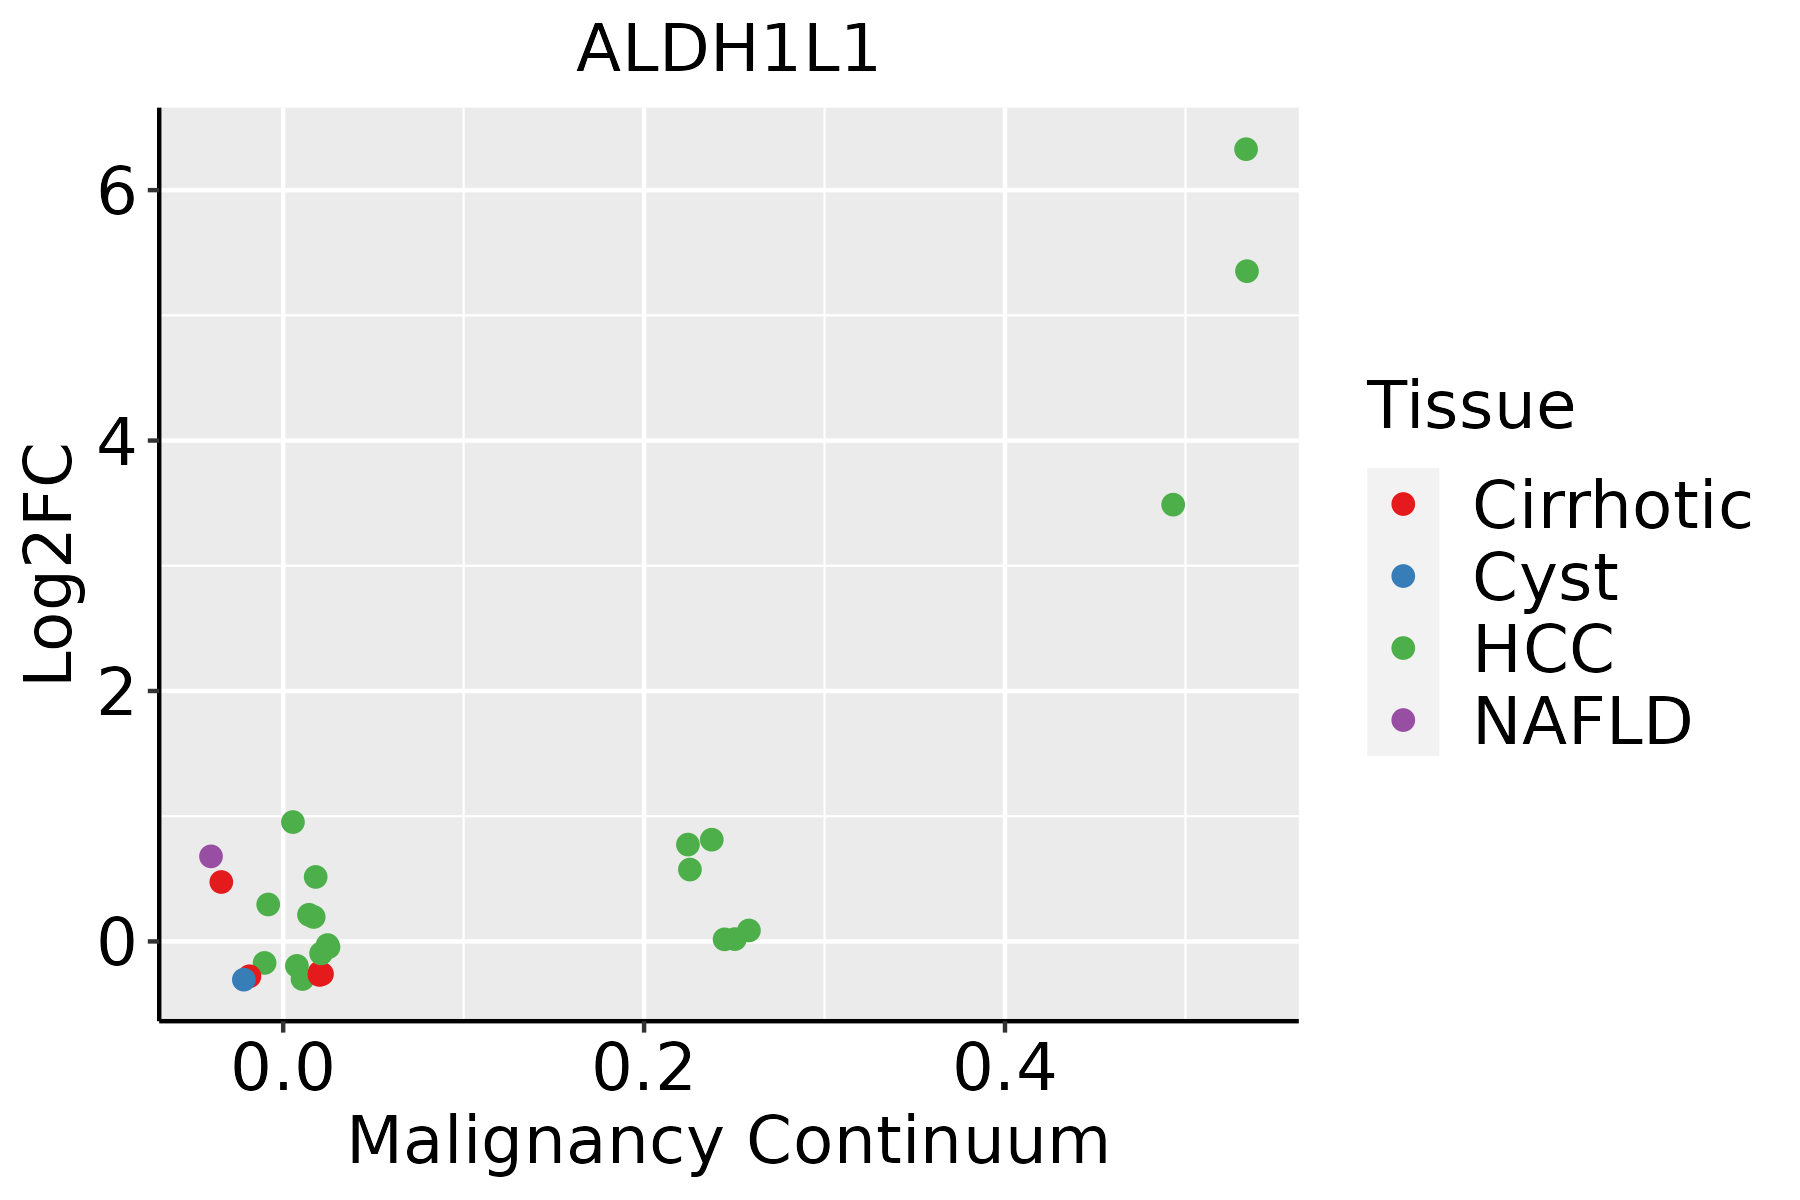 | HCC: Hepatocellular carcinoma |
| NAFLD: Non-alcoholic fatty liver disease |
| ∗log2FC in expression of this searched gene in stem-like cells from each diseased tissue sample relative to stem-like cells in normal samples in each tissue plotted against the malignancy continuum. Samples are colored based on if they are from different disease stage. |
Top |
Malignant transformation related pathway analysis |
| Find out the enriched GO biological processes and KEGG pathways involved in transition from healthy to precancer to cancer |
| Tissue | Disease Stage | Enriched GO biological Processes |
| Colorectum | AD |  |
| Colorectum | SER |  |
| Colorectum | MSS |  |
| Colorectum | MSI-H |  |
| Colorectum | FAP |  |
| ∗Top 15 enriched GO BP terms are showed in the bar plot of each disease state in each tissue. Each row represents a significant GO biological process which is colored according to the -log10(p.adjust). |
| Page: 1 2 3 4 5 6 7 8 9 |
| GO ID | Tissue | Disease Stage | Description | Gene Ratio | Bg Ratio | pvalue | p.adjust | Count |
| GO:0044270 | Colorectum | AD | cellular nitrogen compound catabolic process | 147/3918 | 451/18723 | 3.35e-09 | 2.23e-07 | 147 |
| GO:0046700 | Colorectum | AD | heterocycle catabolic process | 145/3918 | 445/18723 | 4.37e-09 | 2.84e-07 | 145 |
| GO:0019439 | Colorectum | AD | aromatic compound catabolic process | 146/3918 | 467/18723 | 7.48e-08 | 3.84e-06 | 146 |
| GO:1901361 | Colorectum | AD | organic cyclic compound catabolic process | 153/3918 | 495/18723 | 8.23e-08 | 4.18e-06 | 153 |
| GO:0044282 | Colorectum | AD | small molecule catabolic process | 118/3918 | 376/18723 | 1.05e-06 | 3.55e-05 | 118 |
| GO:0016054 | Colorectum | AD | organic acid catabolic process | 73/3918 | 240/18723 | 3.20e-04 | 3.81e-03 | 73 |
| GO:0006575 | Colorectum | AD | cellular modified amino acid metabolic process | 59/3918 | 188/18723 | 4.80e-04 | 5.27e-03 | 59 |
| GO:0006730 | Colorectum | AD | one-carbon metabolic process | 18/3918 | 40/18723 | 5.36e-04 | 5.74e-03 | 18 |
| GO:0043648 | Colorectum | AD | dicarboxylic acid metabolic process | 34/3918 | 96/18723 | 7.22e-04 | 7.28e-03 | 34 |
| GO:0046395 | Colorectum | AD | carboxylic acid catabolic process | 70/3918 | 236/18723 | 9.06e-04 | 8.71e-03 | 70 |
| GO:00442821 | Colorectum | SER | small molecule catabolic process | 87/2897 | 376/18723 | 5.31e-05 | 1.27e-03 | 87 |
| GO:00442701 | Colorectum | SER | cellular nitrogen compound catabolic process | 99/2897 | 451/18723 | 1.46e-04 | 2.86e-03 | 99 |
| GO:00467001 | Colorectum | SER | heterocycle catabolic process | 97/2897 | 445/18723 | 2.20e-04 | 3.89e-03 | 97 |
| GO:19013611 | Colorectum | SER | organic cyclic compound catabolic process | 104/2897 | 495/18723 | 5.46e-04 | 7.63e-03 | 104 |
| GO:00067301 | Colorectum | SER | one-carbon metabolic process | 15/2897 | 40/18723 | 5.71e-04 | 7.86e-03 | 15 |
| GO:00194391 | Colorectum | SER | aromatic compound catabolic process | 98/2897 | 467/18723 | 8.09e-04 | 1.01e-02 | 98 |
| GO:00160541 | Colorectum | SER | organic acid catabolic process | 53/2897 | 240/18723 | 4.04e-03 | 3.30e-02 | 53 |
| GO:00463953 | Liver | NAFLD | carboxylic acid catabolic process | 73/1882 | 236/18723 | 4.16e-19 | 1.22e-15 | 73 |
| GO:00160544 | Liver | NAFLD | organic acid catabolic process | 73/1882 | 240/18723 | 1.20e-18 | 2.34e-15 | 73 |
| GO:00442825 | Liver | NAFLD | small molecule catabolic process | 91/1882 | 376/18723 | 8.96e-16 | 1.31e-12 | 91 |
| Page: 1 2 3 |
| Pathway ID | Tissue | Disease Stage | Description | Gene Ratio | Bg Ratio | pvalue | p.adjust | qvalue | Count |
| Page: 1 |
Top |
Cell-cell communication analysis |
| Identification of potential cell-cell interactions between two cell types and their ligand-receptor pairs for different disease states |
| Ligand | Receptor | LRpair | Pathway | Tissue | Disease Stage |
| Page: 1 |
Top |
Single-cell gene regulatory network inference analysis |
| Find out the significant the regulons (TFs) and the target genes of each regulon across cell types for different disease states |
| TF | Cell Type | Tissue | Disease Stage | Target Gene | RSS | Regulon Activity |
| ∗The dot plots of a searched regulon are shown for all cell subpopulations in each disease state of each tissue based on the regulon specific score inferred using pySCENIC and by calculating the average expression. |
| Page: 1 |
Top |
Somatic mutation of malignant transformation related genes |
| Annotation of somatic variants for genes involved in malignant transformation |
| Hugo Symbol | Variant Class | Variant Classification | dbSNP RS | HGVSc | HGVSp | HGVSp Short | SWISSPROT | BIOTYPE | SIFT | PolyPhen | Tumor Sample Barcode | Tissue | Histology | Sex | Age | Stage | Therapy Types | Drugs | Outcome |
| ALDH1L1 | SNV | Missense_Mutation | rs752044328 | c.103N>A | p.Glu35Lys | p.E35K | O75891 | protein_coding | tolerated_low_confidence(0.41) | benign(0.012) | TCGA-A8-A07U-01 | Breast | breast invasive carcinoma | Female | >=65 | III/IV | Chemotherapy | 5-fluorouracil | SD |
| ALDH1L1 | SNV | Missense_Mutation | novel | c.2215N>A | p.Glu739Lys | p.E739K | O75891 | protein_coding | tolerated(0.15) | benign(0.018) | TCGA-AC-A5EH-01 | Breast | breast invasive carcinoma | Female | >=65 | I/II | Unknown | Unknown | SD |
| ALDH1L1 | SNV | Missense_Mutation | novel | c.1492C>G | p.Leu498Val | p.L498V | O75891 | protein_coding | deleterious(0.02) | benign(0.013) | TCGA-AR-A251-01 | Breast | breast invasive carcinoma | Female | <65 | III/IV | Chemotherapy | doxorubicin | SD |
| ALDH1L1 | SNV | Missense_Mutation | c.228N>C | p.Leu76Phe | p.L76F | O75891 | protein_coding | deleterious_low_confidence(0) | probably_damaging(0.949) | TCGA-B6-A0RE-01 | Breast | breast invasive carcinoma | Female | <65 | I/II | Unknown | Unknown | SD | |
| ALDH1L1 | SNV | Missense_Mutation | c.2296G>T | p.Val766Leu | p.V766L | O75891 | protein_coding | deleterious(0.03) | benign(0) | TCGA-E2-A14T-01 | Breast | breast invasive carcinoma | Female | <65 | I/II | Chemotherapy | doxorubicin | SD | |
| ALDH1L1 | insertion | Frame_Shift_Ins | novel | c.1350_1351insTTTGG | p.Thr451PhefsTer50 | p.T451Ffs*50 | O75891 | protein_coding | TCGA-A8-A07U-01 | Breast | breast invasive carcinoma | Female | >=65 | III/IV | Chemotherapy | 5-fluorouracil | SD | ||
| ALDH1L1 | insertion | Nonsense_Mutation | novel | c.1348_1349insGGAAAATTTG | p.Glu450GlyfsTer4 | p.E450Gfs*4 | O75891 | protein_coding | TCGA-A8-A07U-01 | Breast | breast invasive carcinoma | Female | >=65 | III/IV | Chemotherapy | 5-fluorouracil | SD | ||
| ALDH1L1 | deletion | Frame_Shift_Del | novel | c.2344delN | p.Leu782TrpfsTer29 | p.L782Wfs*29 | O75891 | protein_coding | TCGA-D8-A27V-01 | Breast | breast invasive carcinoma | Female | <65 | I/II | Hormone Therapy | tamoxiphen | SD | ||
| ALDH1L1 | SNV | Missense_Mutation | rs758569749 | c.1483C>T | p.Arg495Trp | p.R495W | O75891 | protein_coding | deleterious(0) | probably_damaging(0.974) | TCGA-2W-A8YY-01 | Cervix | cervical & endocervical cancer | Female | <65 | I/II | Chemotherapy | cisplatin | CR |
| ALDH1L1 | SNV | Missense_Mutation | c.335N>A | p.Ser112Tyr | p.S112Y | O75891 | protein_coding | deleterious_low_confidence(0) | probably_damaging(0.996) | TCGA-EA-A3QE-01 | Cervix | cervical & endocervical cancer | Female | <65 | I/II | Unknown | Unknown | SD |
| Page: 1 2 3 4 5 6 7 8 9 10 11 12 |
Top |
Related drugs of malignant transformation related genes |
| Identification of chemicals and drugs interact with genes involved in malignant transfromation |
| (DGIdb 4.0) |
| Entrez ID | Symbol | Category | Interaction Types | Drug Claim Name | Drug Name | PMIDs |
| 10840 | ALDH1L1 | DRUGGABLE GENOME | l-methionine | METHIONINE | 24651765 | |
| 10840 | ALDH1L1 | DRUGGABLE GENOME | methylphenidate | METHYLPHENIDATE |
| Page: 1 |

Copyright 2023-Present -The University of Texas Health Science Center at Houston |