
|
|||||
|
 | |
| |
| |
| |
| |
| |
|
Gene: ALDH1A3 |
Gene summary for ALDH1A3 |
| Gene information | Species | Human | Gene symbol | ALDH1A3 | Gene ID | 220 |
| Gene name | aldehyde dehydrogenase 1 family member A3 | |
| Gene Alias | ALDH1A6 | |
| Cytomap | 15q26.3 | |
| Gene Type | protein-coding | GO ID | GO:0001523 | UniProtAcc | A0A024RC95 |
Top |
Malignant transformation analysis |
| Identification of the aberrant gene expression in precancerous and cancerous lesions by comparing the gene expression of stem-like cells in diseased tissues with normal stem cells |
| Entrez ID | Symbol | Replicates | Species | Organ | Tissue | Adj P-value | Log2FC | Malignancy |
| 220 | ALDH1A3 | LZE4T | Human | Esophagus | ESCC | 6.66e-04 | -2.59e-01 | 0.0811 |
| 220 | ALDH1A3 | LZE8T | Human | Esophagus | ESCC | 1.87e-04 | -1.92e-01 | 0.067 |
| 220 | ALDH1A3 | LZE20T | Human | Esophagus | ESCC | 1.47e-03 | -2.17e-01 | 0.0662 |
| 220 | ALDH1A3 | P8T-E | Human | Esophagus | ESCC | 7.11e-42 | 1.58e+00 | 0.0889 |
| 220 | ALDH1A3 | P10T-E | Human | Esophagus | ESCC | 7.93e-03 | -3.08e-01 | 0.116 |
| 220 | ALDH1A3 | P11T-E | Human | Esophagus | ESCC | 1.70e-02 | 1.42e-03 | 0.1426 |
| 220 | ALDH1A3 | P12T-E | Human | Esophagus | ESCC | 8.43e-05 | -2.60e-01 | 0.1122 |
| 220 | ALDH1A3 | P15T-E | Human | Esophagus | ESCC | 1.08e-06 | -2.43e-01 | 0.1149 |
| 220 | ALDH1A3 | P16T-E | Human | Esophagus | ESCC | 1.71e-16 | 1.20e+00 | 0.1153 |
| 220 | ALDH1A3 | P19T-E | Human | Esophagus | ESCC | 1.76e-02 | -3.36e-02 | 0.1662 |
| 220 | ALDH1A3 | P22T-E | Human | Esophagus | ESCC | 2.24e-07 | -2.80e-01 | 0.1236 |
| 220 | ALDH1A3 | P23T-E | Human | Esophagus | ESCC | 1.17e-04 | 6.77e-01 | 0.108 |
| 220 | ALDH1A3 | P26T-E | Human | Esophagus | ESCC | 1.89e-04 | -2.55e-01 | 0.1276 |
| 220 | ALDH1A3 | P32T-E | Human | Esophagus | ESCC | 2.44e-06 | -2.52e-01 | 0.1666 |
| 220 | ALDH1A3 | P37T-E | Human | Esophagus | ESCC | 1.66e-06 | 6.45e-02 | 0.1371 |
| 220 | ALDH1A3 | P38T-E | Human | Esophagus | ESCC | 1.00e-04 | -7.06e-02 | 0.127 |
| 220 | ALDH1A3 | P42T-E | Human | Esophagus | ESCC | 1.20e-03 | -1.87e-01 | 0.1175 |
| 220 | ALDH1A3 | P61T-E | Human | Esophagus | ESCC | 4.53e-05 | -2.15e-01 | 0.099 |
| 220 | ALDH1A3 | P75T-E | Human | Esophagus | ESCC | 5.37e-17 | 8.26e-01 | 0.1125 |
| 220 | ALDH1A3 | P76T-E | Human | Esophagus | ESCC | 1.32e-07 | 4.59e-01 | 0.1207 |
| Page: 1 2 |
| Tissue | Expression Dynamics | Abbreviation |
| Esophagus | 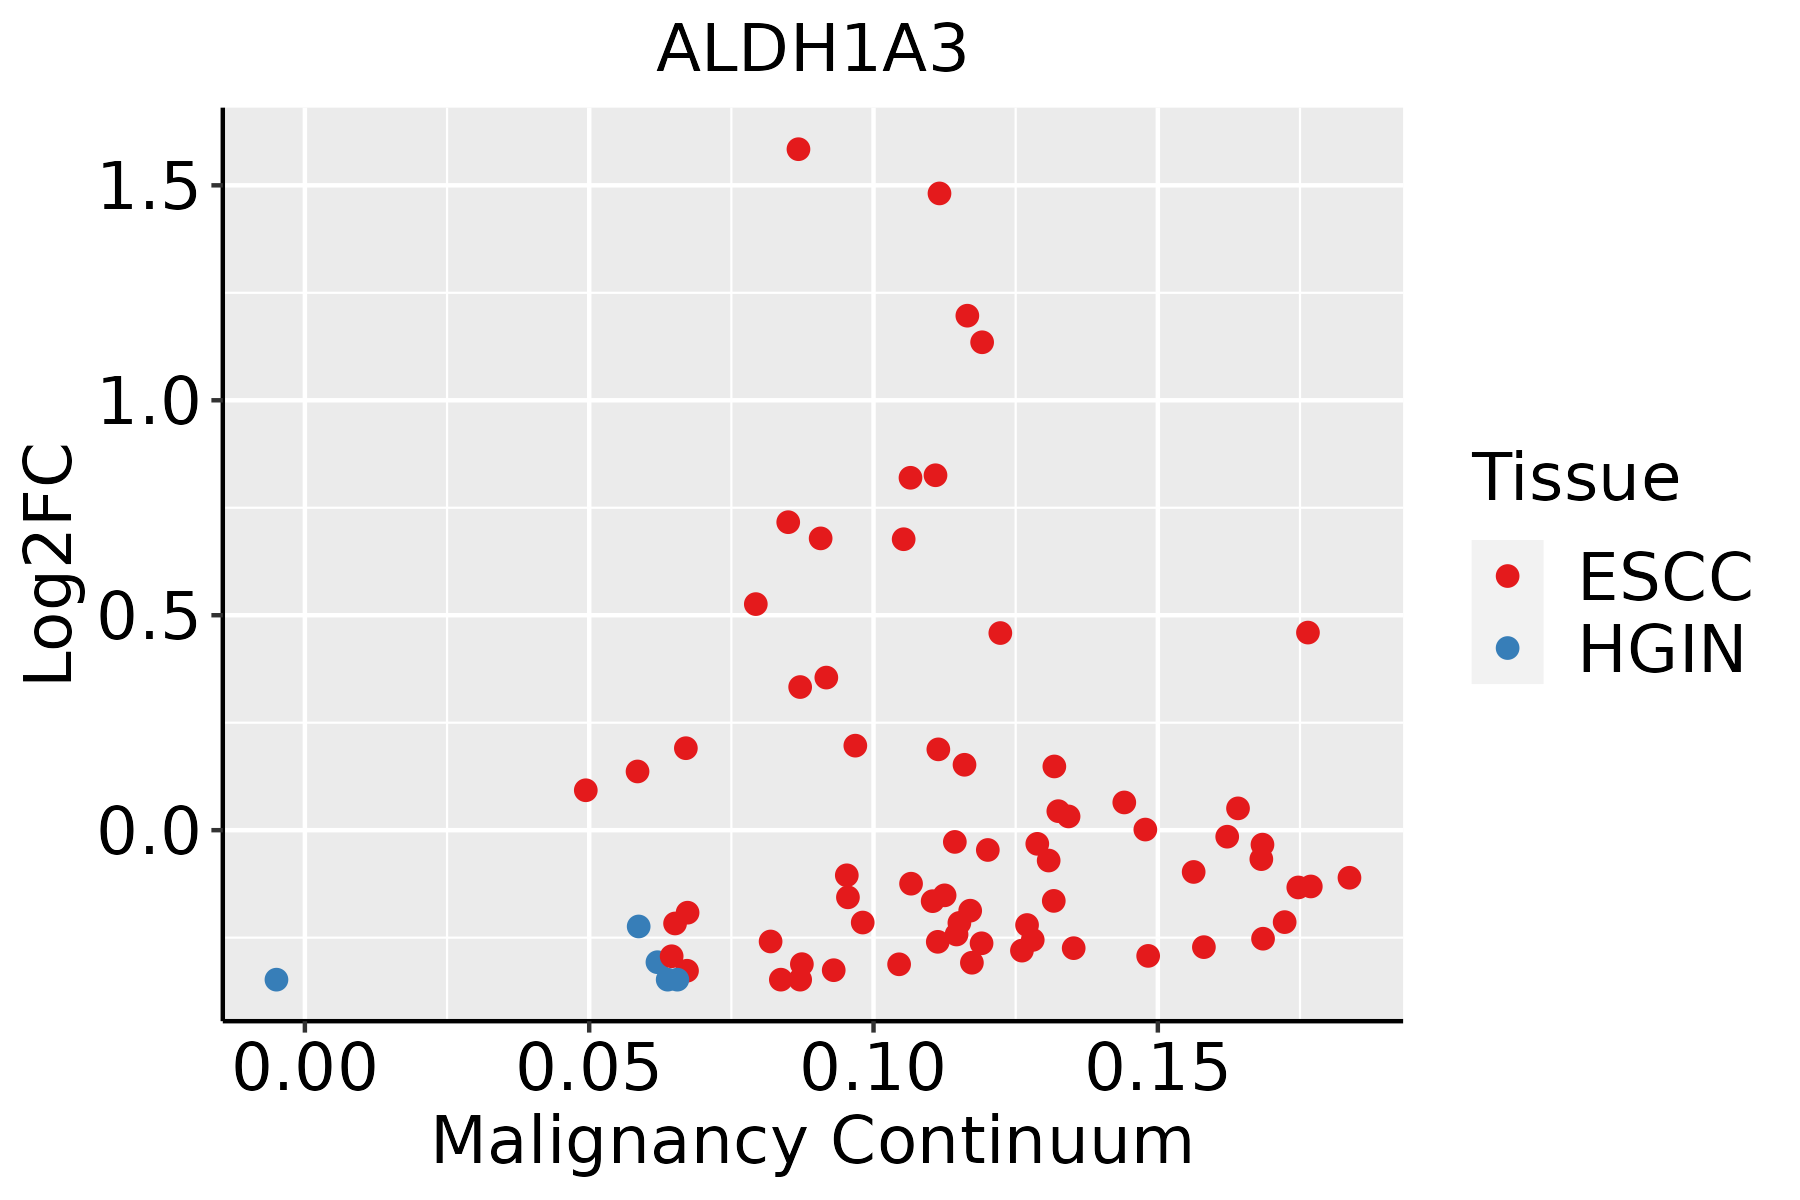 | ESCC: Esophageal squamous cell carcinoma |
| HGIN: High-grade intraepithelial neoplasias | ||
| LGIN: Low-grade intraepithelial neoplasias | ||
| Prostate |  | BPH: Benign Prostatic Hyperplasia |
| ∗log2FC in expression of this searched gene in stem-like cells from each diseased tissue sample relative to stem-like cells in normal samples in each tissue plotted against the malignancy continuum. Samples are colored based on if they are from different disease stage. |
Top |
Malignant transformation related pathway analysis |
| Find out the enriched GO biological processes and KEGG pathways involved in transition from healthy to precancer to cancer |
| Tissue | Disease Stage | Enriched GO biological Processes |
| Colorectum | AD |  |
| Colorectum | SER |  |
| Colorectum | MSS |  |
| Colorectum | MSI-H |  |
| Colorectum | FAP |  |
| ∗Top 15 enriched GO BP terms are showed in the bar plot of each disease state in each tissue. Each row represents a significant GO biological process which is colored according to the -log10(p.adjust). |
| Page: 1 2 3 4 5 6 7 8 9 |
| GO ID | Tissue | Disease Stage | Description | Gene Ratio | Bg Ratio | pvalue | p.adjust | Count |
| GO:0048732111 | Esophagus | ESCC | gland development | 269/8552 | 436/18723 | 7.81e-12 | 2.95e-10 | 269 |
| GO:00163316 | Esophagus | ESCC | morphogenesis of embryonic epithelium | 98/8552 | 147/18723 | 2.12e-07 | 3.27e-06 | 98 |
| GO:00060668 | Esophagus | ESCC | alcohol metabolic process | 202/8552 | 353/18723 | 7.32e-06 | 7.26e-05 | 202 |
| GO:00605417 | Esophagus | ESCC | respiratory system development | 123/8552 | 203/18723 | 1.26e-05 | 1.15e-04 | 123 |
| GO:00603242 | Esophagus | ESCC | face development | 34/8552 | 44/18723 | 1.90e-05 | 1.67e-04 | 34 |
| GO:004885718 | Esophagus | ESCC | neural nucleus development | 44/8552 | 64/18723 | 1.59e-04 | 1.05e-03 | 44 |
| GO:00463948 | Esophagus | ESCC | carboxylic acid biosynthetic process | 175/8552 | 314/18723 | 1.98e-04 | 1.26e-03 | 175 |
| GO:00160538 | Esophagus | ESCC | organic acid biosynthetic process | 175/8552 | 316/18723 | 3.04e-04 | 1.82e-03 | 175 |
| GO:00485687 | Esophagus | ESCC | embryonic organ development | 228/8552 | 427/18723 | 7.28e-04 | 3.79e-03 | 228 |
| GO:00060818 | Esophagus | ESCC | cellular aldehyde metabolic process | 40/8552 | 60/18723 | 8.30e-04 | 4.28e-03 | 40 |
| GO:00512623 | Esophagus | ESCC | protein tetramerization | 54/8552 | 87/18723 | 1.50e-03 | 7.06e-03 | 54 |
| GO:00082991 | Esophagus | ESCC | isoprenoid biosynthetic process | 21/8552 | 28/18723 | 1.57e-03 | 7.33e-03 | 21 |
| GO:00512592 | Esophagus | ESCC | protein complex oligomerization | 130/8552 | 238/18723 | 3.29e-03 | 1.36e-02 | 130 |
| GO:004873218 | Prostate | BPH | gland development | 122/3107 | 436/18723 | 1.13e-09 | 5.01e-08 | 122 |
| GO:004885715 | Prostate | BPH | neural nucleus development | 28/3107 | 64/18723 | 2.93e-07 | 6.23e-06 | 28 |
| GO:00163314 | Prostate | BPH | morphogenesis of embryonic epithelium | 41/3107 | 147/18723 | 3.86e-04 | 2.83e-03 | 41 |
| GO:00060816 | Prostate | BPH | cellular aldehyde metabolic process | 20/3107 | 60/18723 | 1.14e-03 | 7.10e-03 | 20 |
| GO:00605415 | Prostate | BPH | respiratory system development | 50/3107 | 203/18723 | 2.09e-03 | 1.17e-02 | 50 |
| GO:00309004 | Prostate | BPH | forebrain development | 80/3107 | 379/18723 | 1.19e-02 | 4.82e-02 | 80 |
| GO:004873219 | Prostate | Tumor | gland development | 132/3246 | 436/18723 | 1.40e-11 | 1.04e-09 | 132 |
| Page: 1 2 |
| Pathway ID | Tissue | Disease Stage | Description | Gene Ratio | Bg Ratio | pvalue | p.adjust | qvalue | Count |
| Page: 1 |
Top |
Cell-cell communication analysis |
| Identification of potential cell-cell interactions between two cell types and their ligand-receptor pairs for different disease states |
| Ligand | Receptor | LRpair | Pathway | Tissue | Disease Stage |
| Page: 1 |
Top |
Single-cell gene regulatory network inference analysis |
| Find out the significant the regulons (TFs) and the target genes of each regulon across cell types for different disease states |
| TF | Cell Type | Tissue | Disease Stage | Target Gene | RSS | Regulon Activity |
| ∗The dot plots of a searched regulon are shown for all cell subpopulations in each disease state of each tissue based on the regulon specific score inferred using pySCENIC and by calculating the average expression. |
| Page: 1 |
Top |
Somatic mutation of malignant transformation related genes |
| Annotation of somatic variants for genes involved in malignant transformation |
| Hugo Symbol | Variant Class | Variant Classification | dbSNP RS | HGVSc | HGVSp | HGVSp Short | SWISSPROT | BIOTYPE | SIFT | PolyPhen | Tumor Sample Barcode | Tissue | Histology | Sex | Age | Stage | Therapy Types | Drugs | Outcome |
| ALDH1A3 | SNV | Missense_Mutation | c.1266N>G | p.Phe422Leu | p.F422L | P47895 | protein_coding | deleterious(0.02) | benign(0.009) | TCGA-A8-A08L-01 | Breast | breast invasive carcinoma | Female | >=65 | III/IV | Unknown | Unknown | SD | |
| ALDH1A3 | SNV | Missense_Mutation | novel | c.132N>T | p.Lys44Asn | p.K44N | P47895 | protein_coding | deleterious(0.04) | benign(0.082) | TCGA-AC-A6IW-01 | Breast | breast invasive carcinoma | Female | >=65 | I/II | Unknown | Unknown | SD |
| ALDH1A3 | SNV | Missense_Mutation | rs747991447 | c.1276N>A | p.Glu426Lys | p.E426K | P47895 | protein_coding | tolerated(0.06) | benign(0.011) | TCGA-BH-A0B6-01 | Breast | breast invasive carcinoma | Female | <65 | I/II | Unknown | Unknown | SD |
| ALDH1A3 | SNV | Missense_Mutation | c.876C>G | p.Asp292Glu | p.D292E | P47895 | protein_coding | deleterious(0) | probably_damaging(0.994) | TCGA-C8-A12Q-01 | Breast | breast invasive carcinoma | Female | >=65 | III/IV | Unknown | Unknown | PD | |
| ALDH1A3 | SNV | Missense_Mutation | c.1477N>T | p.Ala493Ser | p.A493S | P47895 | protein_coding | tolerated(0.16) | probably_damaging(0.999) | TCGA-D8-A3Z6-01 | Breast | breast invasive carcinoma | Female | <65 | III/IV | Chemotherapy | cyclophosphane | SD | |
| ALDH1A3 | SNV | Missense_Mutation | c.1322N>T | p.Ala441Val | p.A441V | P47895 | protein_coding | deleterious(0) | possibly_damaging(0.49) | TCGA-E2-A1BC-01 | Breast | breast invasive carcinoma | Female | <65 | I/II | Hormone Therapy | arimidex | SD | |
| ALDH1A3 | insertion | In_Frame_Ins | novel | c.993_994insAGGCGGAGCGTG | p.Arg332_Val335dup | p.R332_V335dup | P47895 | protein_coding | TCGA-D8-A27M-01 | Breast | breast invasive carcinoma | Female | <65 | I/II | Chemotherapy | methotrexate+5 | SD | ||
| ALDH1A3 | SNV | Missense_Mutation | c.1289N>C | p.Lys430Thr | p.K430T | P47895 | protein_coding | deleterious(0.04) | benign(0.136) | TCGA-FU-A3HZ-01 | Cervix | cervical & endocervical cancer | Female | <65 | I/II | Chemotherapy | cisplatin | CR | |
| ALDH1A3 | SNV | Missense_Mutation | c.257N>T | p.Ser86Leu | p.S86L | P47895 | protein_coding | deleterious(0) | probably_damaging(1) | TCGA-A6-6654-01 | Colorectum | colon adenocarcinoma | Female | >=65 | III/IV | Chemotherapy | oxaliplatin | SD | |
| ALDH1A3 | SNV | Missense_Mutation | rs567004839 | c.833C>T | p.Thr278Met | p.T278M | P47895 | protein_coding | deleterious(0) | probably_damaging(1) | TCGA-A6-A565-01 | Colorectum | colon adenocarcinoma | Female | <65 | III/IV | Unspecific | 5FU | PD |
| Page: 1 2 3 4 5 6 7 |
Top |
Related drugs of malignant transformation related genes |
| Identification of chemicals and drugs interact with genes involved in malignant transfromation |
| (DGIdb 4.0) |
| Entrez ID | Symbol | Category | Interaction Types | Drug Claim Name | Drug Name | PMIDs |
| Page: 1 |

Copyright 2023-Present -The University of Texas Health Science Center at Houston |