
|
|||||
|
 | |
| |
| |
| |
| |
| |
|
Gene: ALCAM |
Gene summary for ALCAM |
| Gene information | Species | Human | Gene symbol | ALCAM | Gene ID | 214 |
| Gene name | activated leukocyte cell adhesion molecule | |
| Gene Alias | CD166 | |
| Cytomap | 3q13.11 | |
| Gene Type | protein-coding | GO ID | GO:0000902 | UniProtAcc | Q13740 |
Top |
Malignant transformation analysis |
| Identification of the aberrant gene expression in precancerous and cancerous lesions by comparing the gene expression of stem-like cells in diseased tissues with normal stem cells |
| Entrez ID | Symbol | Replicates | Species | Organ | Tissue | Adj P-value | Log2FC | Malignancy |
| 214 | ALCAM | AEH-subject1 | Human | Endometrium | AEH | 6.35e-34 | 7.64e-01 | -0.3059 |
| 214 | ALCAM | AEH-subject2 | Human | Endometrium | AEH | 1.38e-19 | 6.16e-01 | -0.2525 |
| 214 | ALCAM | AEH-subject3 | Human | Endometrium | AEH | 1.87e-10 | 4.38e-01 | -0.2576 |
| 214 | ALCAM | AEH-subject4 | Human | Endometrium | AEH | 2.83e-26 | 7.77e-01 | -0.2657 |
| 214 | ALCAM | AEH-subject5 | Human | Endometrium | AEH | 1.36e-77 | 1.38e+00 | -0.2953 |
| 214 | ALCAM | EEC-subject1 | Human | Endometrium | EEC | 5.50e-26 | 6.75e-01 | -0.2682 |
| 214 | ALCAM | EEC-subject3 | Human | Endometrium | EEC | 3.63e-21 | 3.96e-01 | -0.2525 |
| 214 | ALCAM | EEC-subject4 | Human | Endometrium | EEC | 5.37e-21 | 6.32e-01 | -0.2571 |
| 214 | ALCAM | GSM6177620_NYU_UCEC1_lib1_lib1 | Human | Endometrium | EEC | 2.45e-12 | 1.70e-02 | -0.1869 |
| 214 | ALCAM | GSM6177620_NYU_UCEC1_lib2_lib2 | Human | Endometrium | EEC | 2.69e-05 | -1.78e-01 | -0.1875 |
| 214 | ALCAM | GSM6177620_NYU_UCEC1_lib3_lib3 | Human | Endometrium | EEC | 3.22e-13 | -8.44e-02 | -0.1883 |
| 214 | ALCAM | GSM6177621_NYU_UCEC2_lib1_lib1 | Human | Endometrium | EEC | 9.52e-10 | 2.03e-01 | -0.1934 |
| 214 | ALCAM | GSM6177622_NYU_UCEC3_lib1_lib1 | Human | Endometrium | EEC | 1.31e-16 | -1.67e-01 | -0.1917 |
| 214 | ALCAM | GSM6177622_NYU_UCEC3_lib2_lib2 | Human | Endometrium | EEC | 5.73e-13 | -1.70e-01 | -0.1916 |
| 214 | ALCAM | LZE2T | Human | Esophagus | ESCC | 2.31e-08 | 1.28e+00 | 0.082 |
| 214 | ALCAM | LZE4T | Human | Esophagus | ESCC | 5.22e-10 | 4.98e-01 | 0.0811 |
| 214 | ALCAM | LZE5T | Human | Esophagus | ESCC | 5.87e-05 | 6.15e-01 | 0.0514 |
| 214 | ALCAM | LZE7T | Human | Esophagus | ESCC | 9.32e-12 | 8.79e-01 | 0.0667 |
| 214 | ALCAM | LZE8T | Human | Esophagus | ESCC | 1.70e-10 | 5.00e-01 | 0.067 |
| 214 | ALCAM | LZE22D1 | Human | Esophagus | HGIN | 3.46e-04 | 2.90e-01 | 0.0595 |
| Page: 1 2 3 4 5 6 7 8 |
| Tissue | Expression Dynamics | Abbreviation |
| Endometrium | 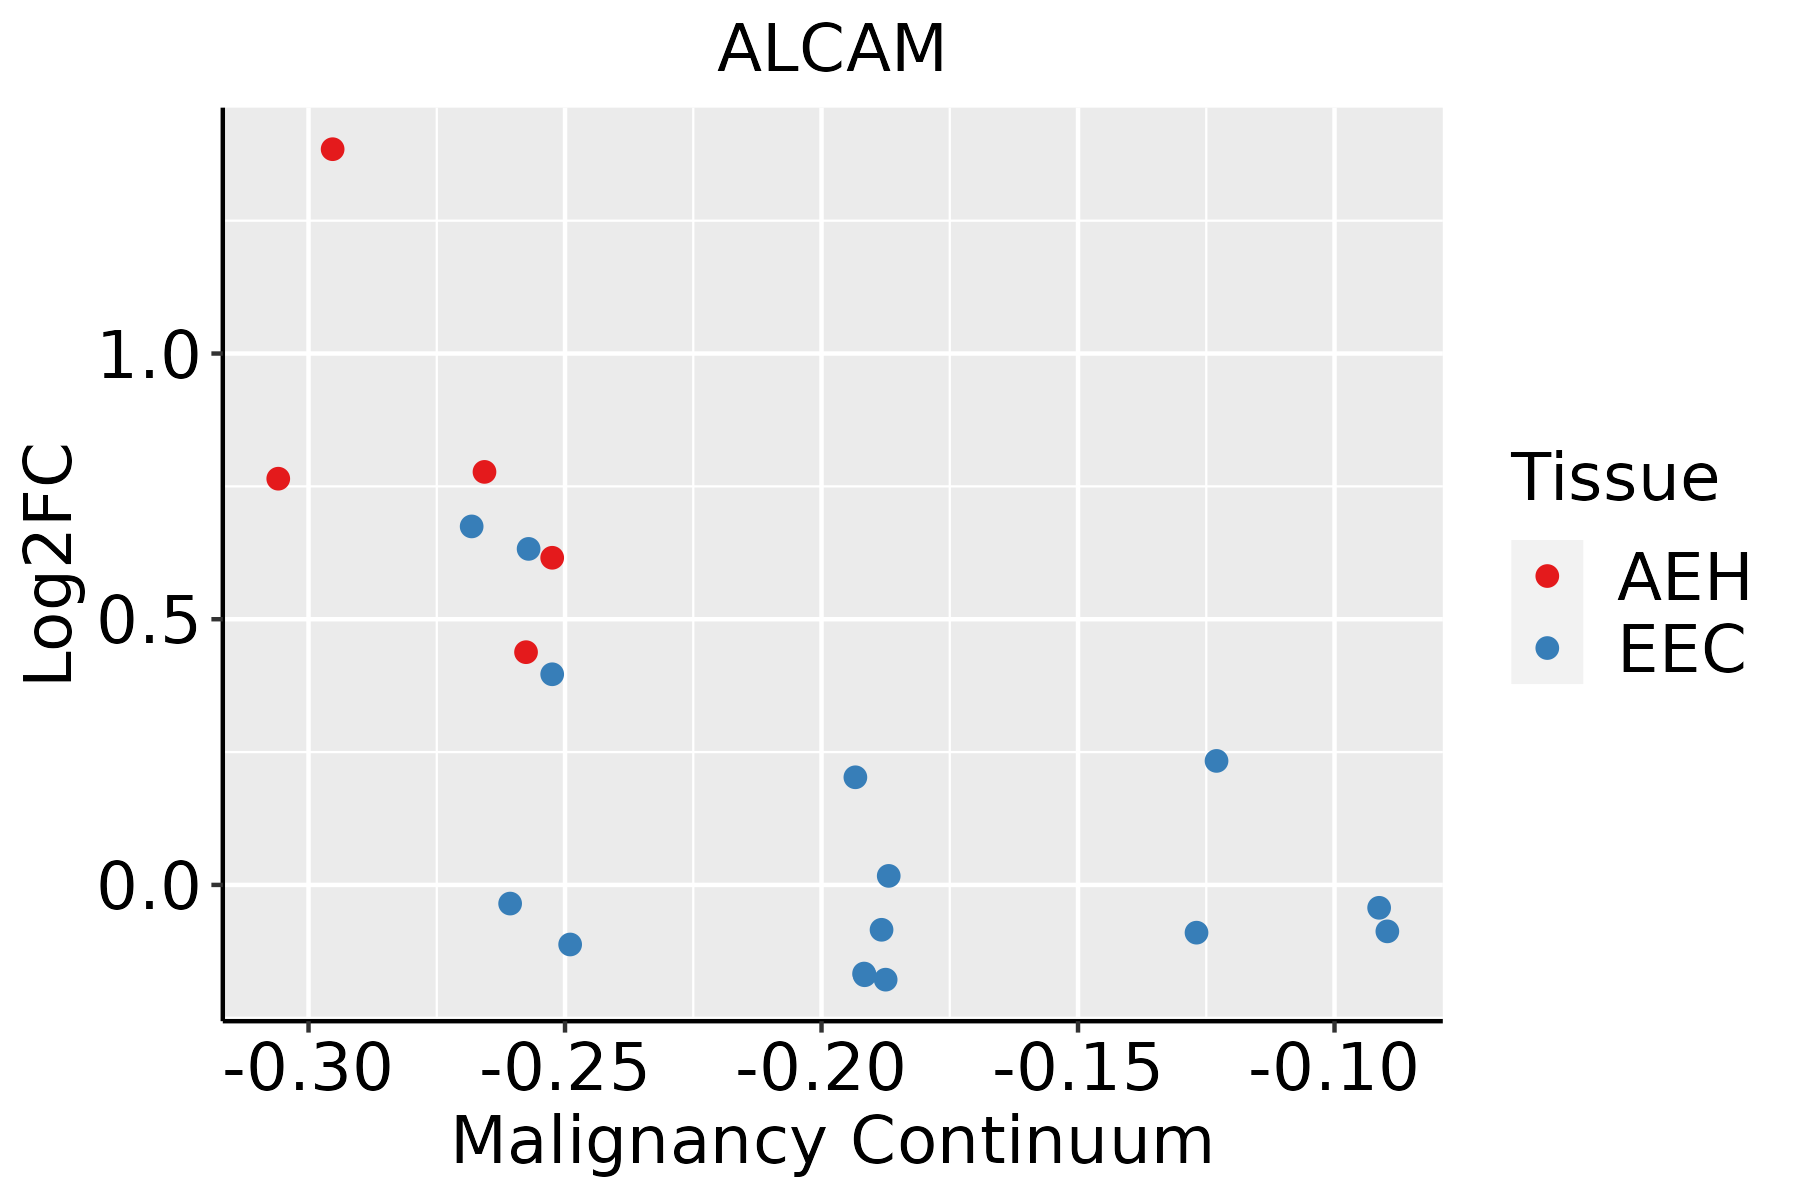 | AEH: Atypical endometrial hyperplasia |
| EEC: Endometrioid Cancer | ||
| Esophagus | 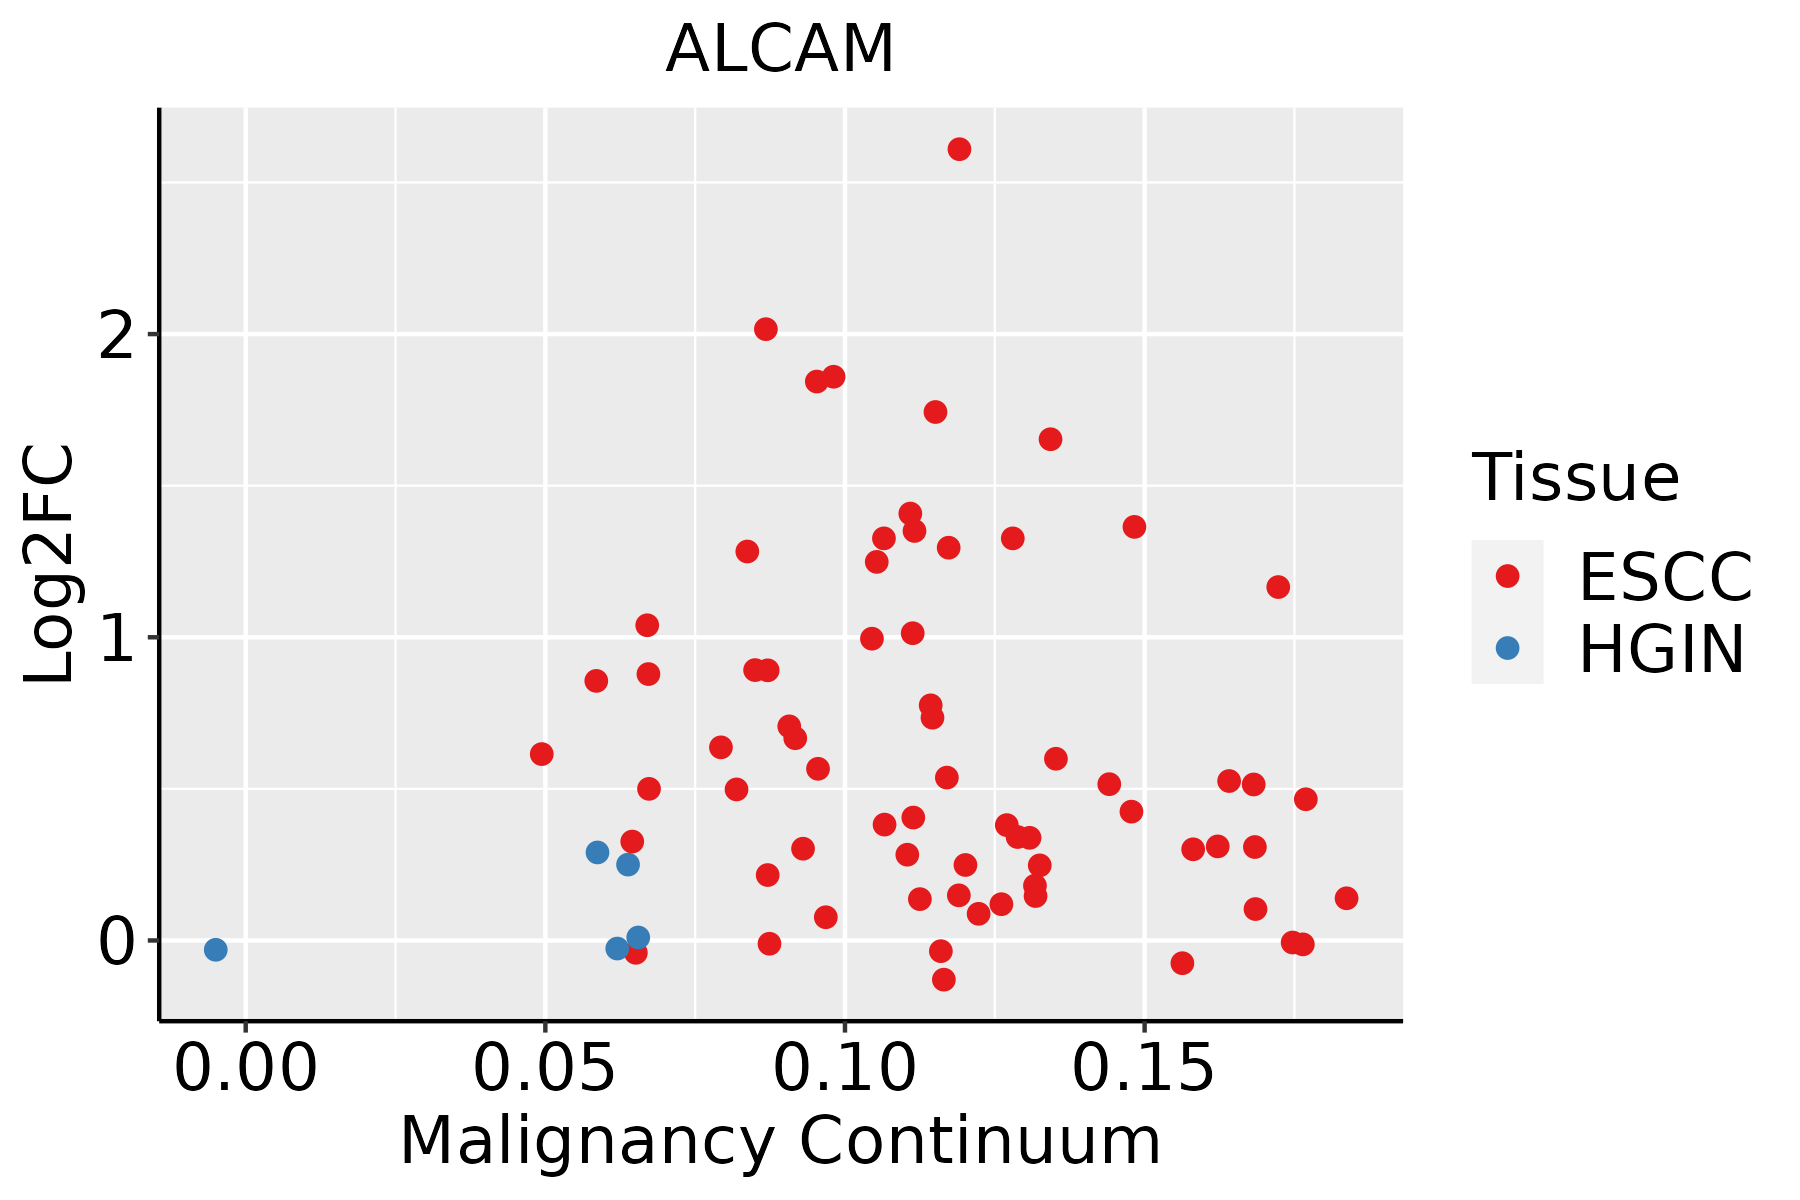 | ESCC: Esophageal squamous cell carcinoma |
| HGIN: High-grade intraepithelial neoplasias | ||
| LGIN: Low-grade intraepithelial neoplasias | ||
| Liver |  | HCC: Hepatocellular carcinoma |
| NAFLD: Non-alcoholic fatty liver disease | ||
| Lung | 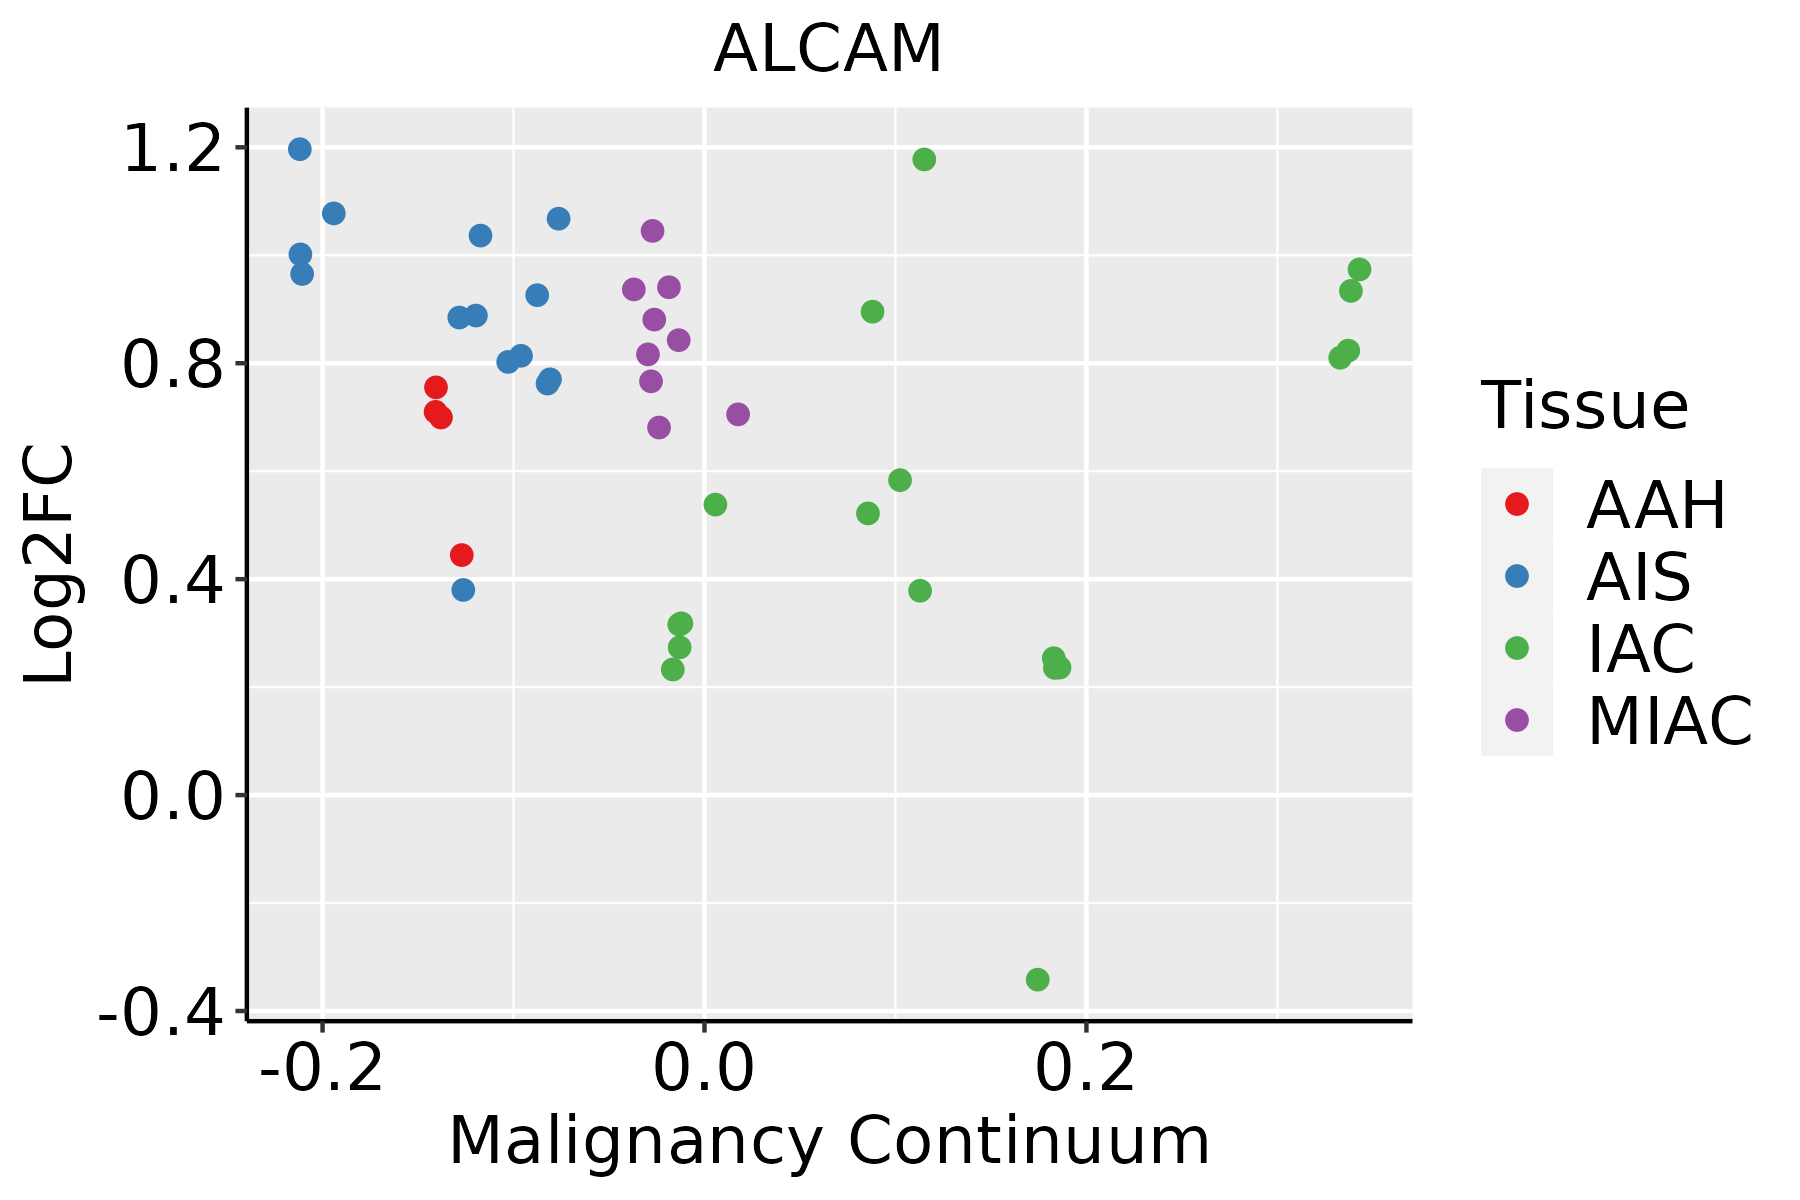 | AAH: Atypical adenomatous hyperplasia |
| AIS: Adenocarcinoma in situ | ||
| IAC: Invasive lung adenocarcinoma | ||
| MIA: Minimally invasive adenocarcinoma | ||
| Oral Cavity |  | EOLP: Erosive Oral lichen planus |
| LP: leukoplakia | ||
| NEOLP: Non-erosive oral lichen planus | ||
| OSCC: Oral squamous cell carcinoma | ||
| Prostate |  | BPH: Benign Prostatic Hyperplasia |
| Skin | 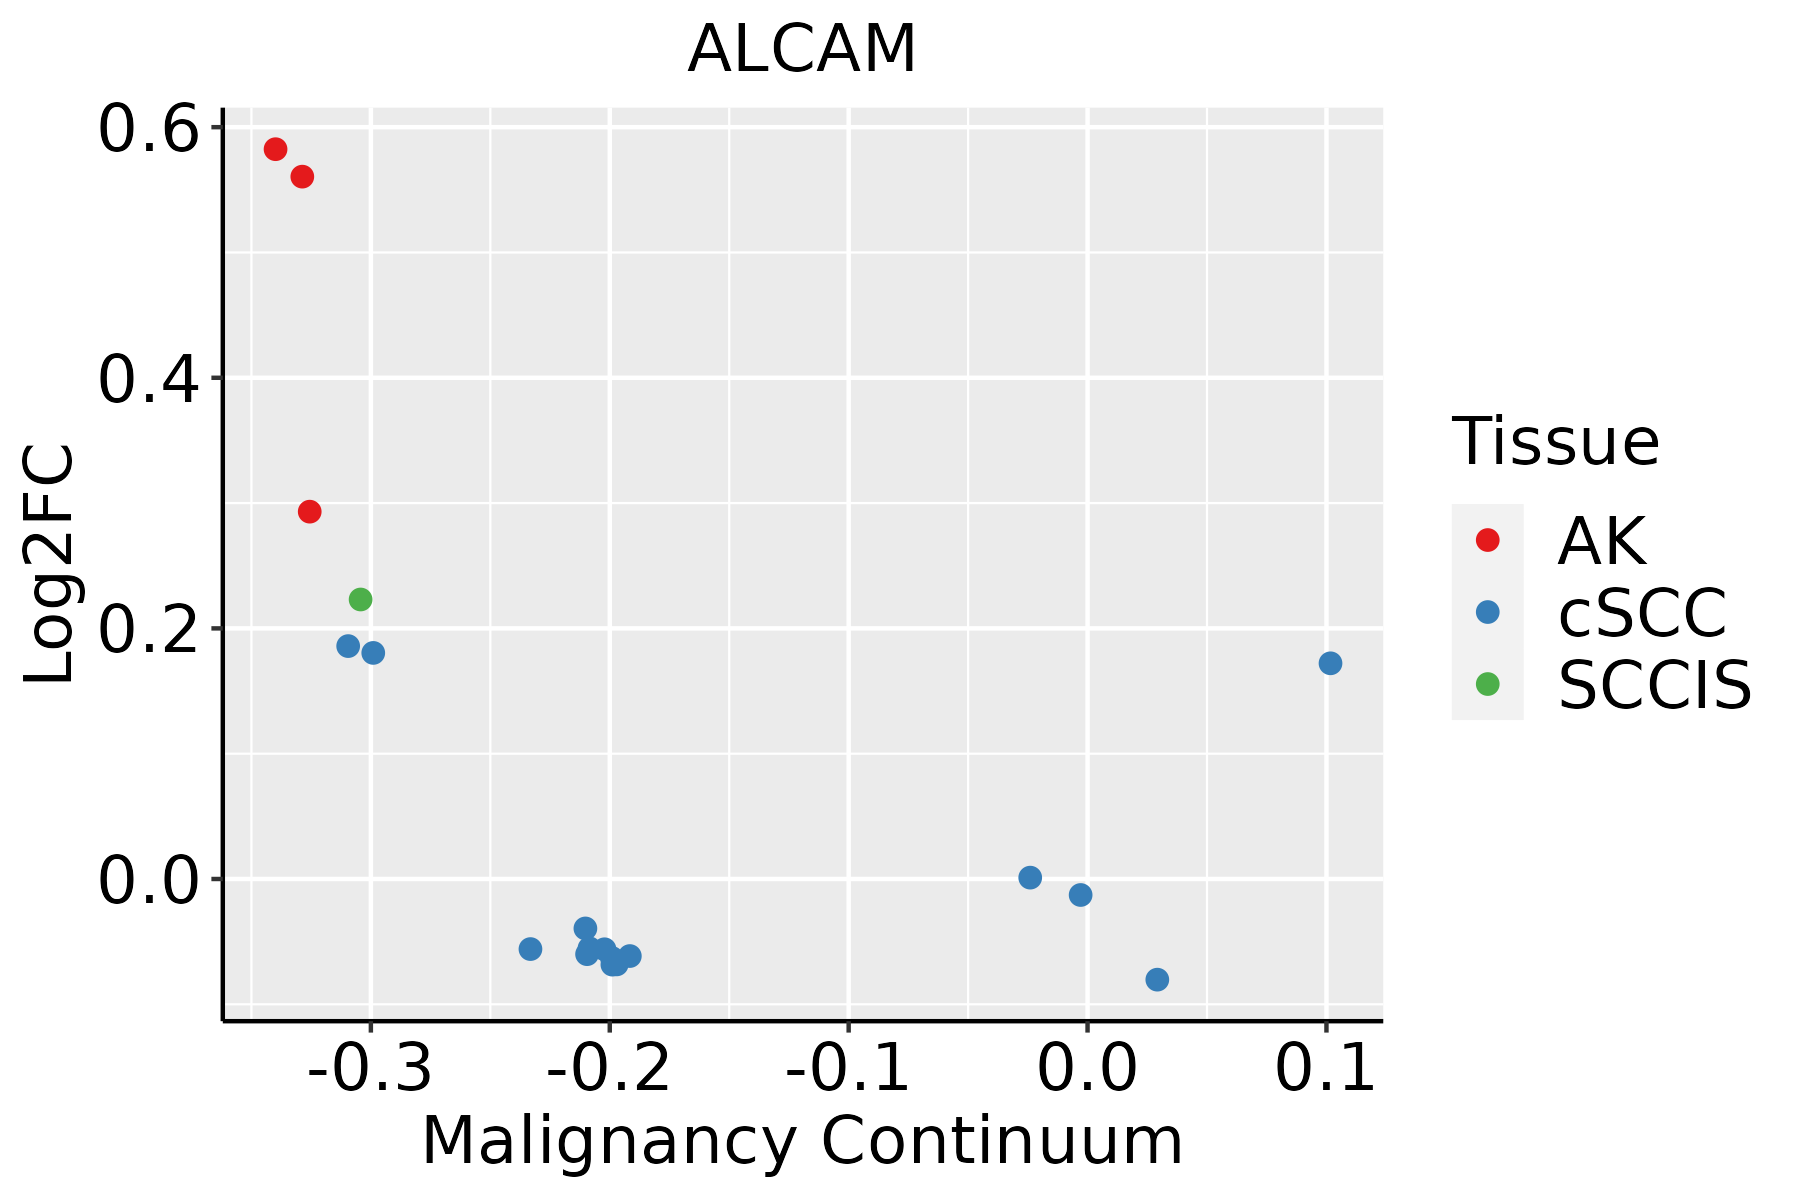 | AK: Actinic keratosis |
| cSCC: Cutaneous squamous cell carcinoma | ||
| SCCIS:squamous cell carcinoma in situ | ||
| Thyroid | 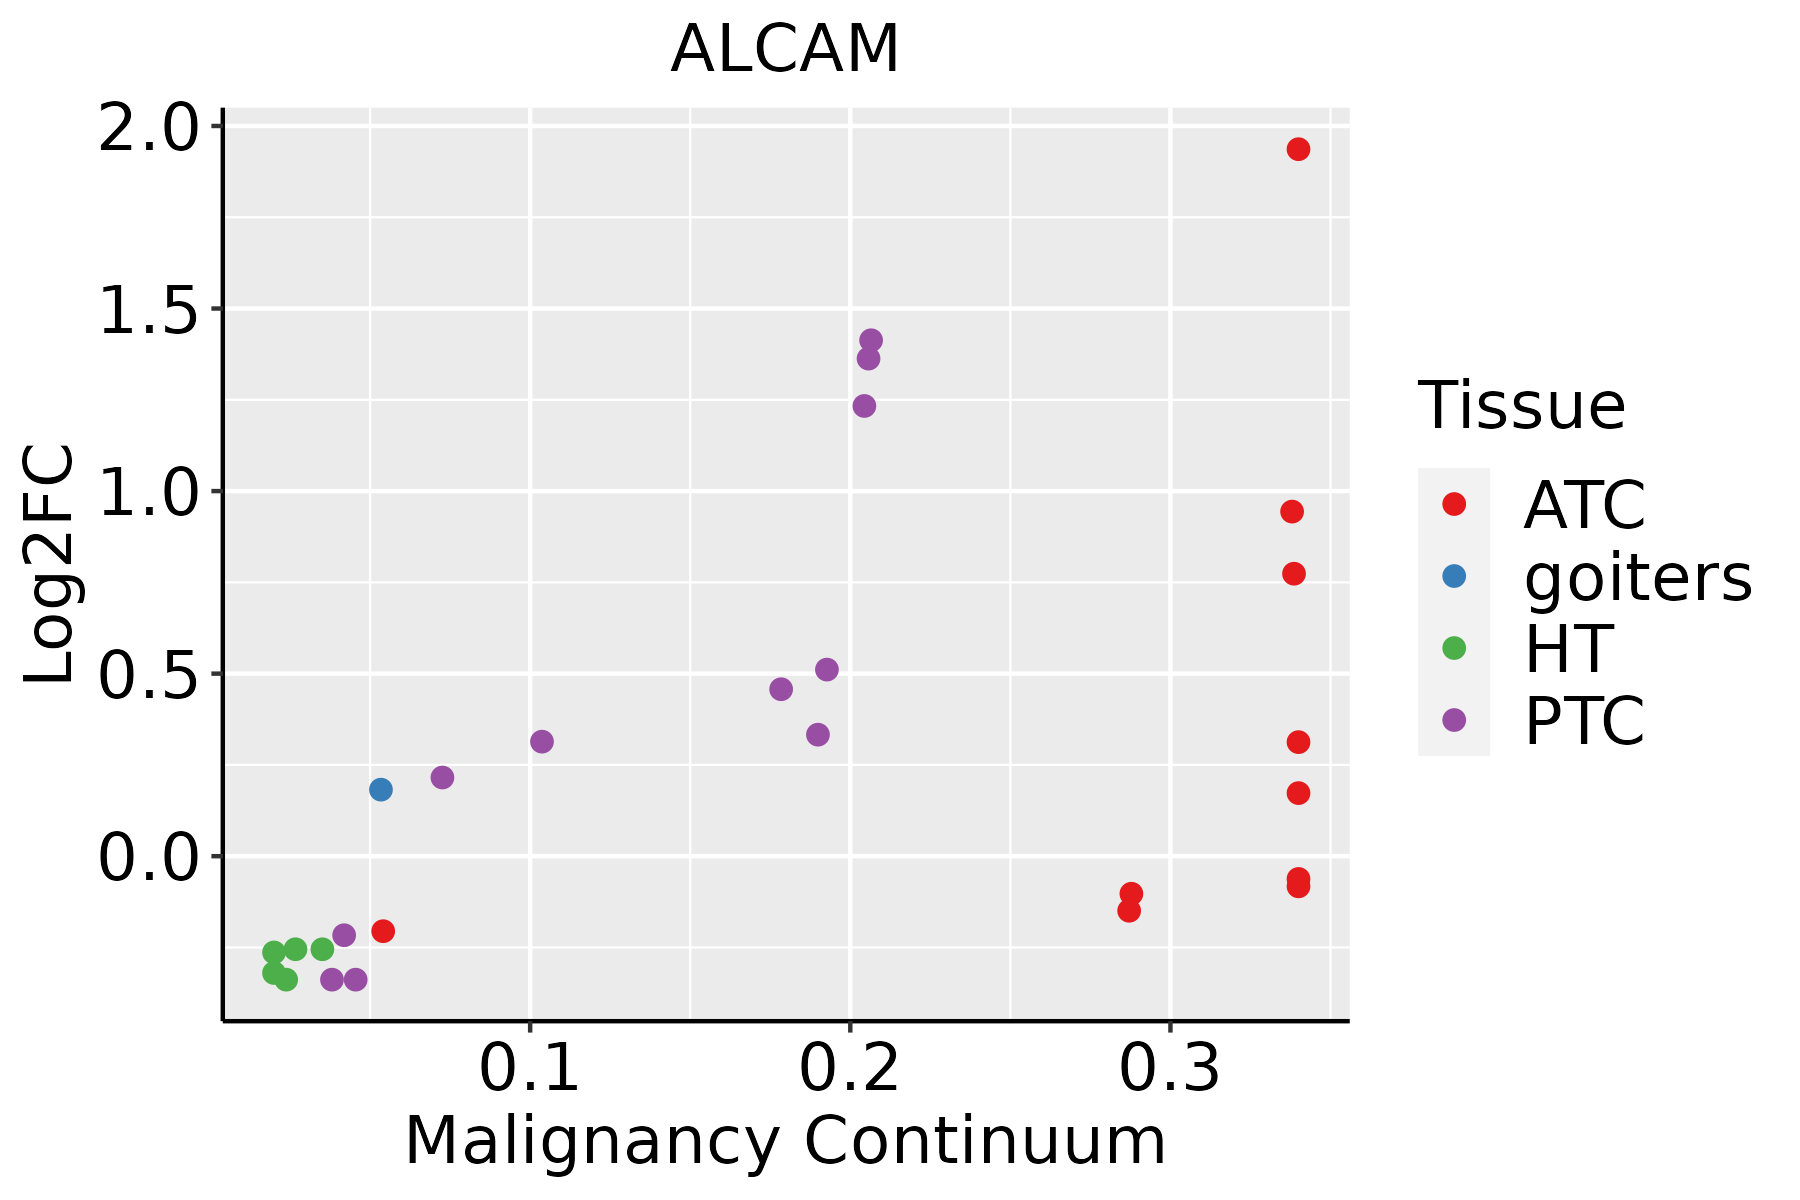 | ATC: Anaplastic thyroid cancer |
| HT: Hashimoto's thyroiditis | ||
| PTC: Papillary thyroid cancer |
| ∗log2FC in expression of this searched gene in stem-like cells from each diseased tissue sample relative to stem-like cells in normal samples in each tissue plotted against the malignancy continuum. Samples are colored based on if they are from different disease stage. |
Top |
Malignant transformation related pathway analysis |
| Find out the enriched GO biological processes and KEGG pathways involved in transition from healthy to precancer to cancer |
| Tissue | Disease Stage | Enriched GO biological Processes |
| Colorectum | AD |  |
| Colorectum | SER |  |
| Colorectum | MSS |  |
| Colorectum | MSI-H |  |
| Colorectum | FAP |  |
| ∗Top 15 enriched GO BP terms are showed in the bar plot of each disease state in each tissue. Each row represents a significant GO biological process which is colored according to the -log10(p.adjust). |
| Page: 1 2 3 4 5 6 7 8 9 |
| GO ID | Tissue | Disease Stage | Description | Gene Ratio | Bg Ratio | pvalue | p.adjust | Count |
| GO:00160499 | Endometrium | AEH | cell growth | 93/2100 | 482/18723 | 1.00e-07 | 4.99e-06 | 93 |
| GO:00605607 | Endometrium | AEH | developmental growth involved in morphogenesis | 53/2100 | 234/18723 | 4.02e-07 | 1.67e-05 | 53 |
| GO:00074098 | Endometrium | AEH | axonogenesis | 81/2100 | 418/18723 | 5.54e-07 | 2.12e-05 | 81 |
| GO:00615648 | Endometrium | AEH | axon development | 88/2100 | 467/18723 | 6.39e-07 | 2.38e-05 | 88 |
| GO:00486757 | Endometrium | AEH | axon extension | 31/2100 | 120/18723 | 6.13e-06 | 1.50e-04 | 31 |
| GO:00485887 | Endometrium | AEH | developmental cell growth | 48/2100 | 234/18723 | 2.39e-05 | 4.53e-04 | 48 |
| GO:19901386 | Endometrium | AEH | neuron projection extension | 38/2100 | 172/18723 | 3.03e-05 | 5.56e-04 | 38 |
| GO:00312902 | Endometrium | AEH | retinal ganglion cell axon guidance | 7/2100 | 19/18723 | 3.28e-03 | 2.30e-02 | 7 |
| GO:006156412 | Endometrium | EEC | axon development | 93/2168 | 467/18723 | 9.60e-08 | 4.69e-06 | 93 |
| GO:001604915 | Endometrium | EEC | cell growth | 95/2168 | 482/18723 | 1.16e-07 | 5.54e-06 | 95 |
| GO:006056013 | Endometrium | EEC | developmental growth involved in morphogenesis | 54/2168 | 234/18723 | 4.60e-07 | 1.78e-05 | 54 |
| GO:000740912 | Endometrium | EEC | axonogenesis | 82/2168 | 418/18723 | 1.03e-06 | 3.49e-05 | 82 |
| GO:004867513 | Endometrium | EEC | axon extension | 31/2168 | 120/18723 | 1.17e-05 | 2.43e-04 | 31 |
| GO:004858813 | Endometrium | EEC | developmental cell growth | 49/2168 | 234/18723 | 2.59e-05 | 4.56e-04 | 49 |
| GO:199013813 | Endometrium | EEC | neuron projection extension | 38/2168 | 172/18723 | 6.08e-05 | 9.21e-04 | 38 |
| GO:00312901 | Endometrium | EEC | retinal ganglion cell axon guidance | 7/2168 | 19/18723 | 3.94e-03 | 2.61e-02 | 7 |
| GO:001604919 | Esophagus | HGIN | cell growth | 93/2587 | 482/18723 | 4.49e-04 | 6.62e-03 | 93 |
| GO:0016049110 | Esophagus | ESCC | cell growth | 289/8552 | 482/18723 | 1.29e-10 | 3.77e-09 | 289 |
| GO:006156415 | Esophagus | ESCC | axon development | 251/8552 | 467/18723 | 2.41e-04 | 1.49e-03 | 251 |
| GO:006056010 | Esophagus | ESCC | developmental growth involved in morphogenesis | 131/8552 | 234/18723 | 9.28e-04 | 4.73e-03 | 131 |
| Page: 1 2 3 4 5 6 7 |
| Pathway ID | Tissue | Disease Stage | Description | Gene Ratio | Bg Ratio | pvalue | p.adjust | qvalue | Count |
| hsa045146 | Lung | IAC | Cell adhesion molecules | 30/1053 | 157/8465 | 1.03e-02 | 3.83e-02 | 2.54e-02 | 30 |
| hsa0451411 | Lung | IAC | Cell adhesion molecules | 30/1053 | 157/8465 | 1.03e-02 | 3.83e-02 | 2.54e-02 | 30 |
| Page: 1 |
Top |
Cell-cell communication analysis |
| Identification of potential cell-cell interactions between two cell types and their ligand-receptor pairs for different disease states |
| Ligand | Receptor | LRpair | Pathway | Tissue | Disease Stage |
| ALCAM | CD6 | ALCAM_CD6 | ALCAM | Breast | DCIS |
| CD6 | ALCAM | CD6_ALCAM | CD6 | Breast | DCIS |
| ALCAM | CD6 | ALCAM_CD6 | ALCAM | Breast | Healthy |
| CD6 | ALCAM | CD6_ALCAM | CD6 | Breast | Healthy |
| ALCAM | CD6 | ALCAM_CD6 | ALCAM | Breast | IDC |
| CD6 | ALCAM | CD6_ALCAM | CD6 | Breast | IDC |
| ALCAM | CD6 | ALCAM_CD6 | ALCAM | Cervix | ADJ |
| CD6 | ALCAM | CD6_ALCAM | CD6 | Cervix | ADJ |
| ALCAM | CD6 | ALCAM_CD6 | ALCAM | Cervix | CC |
| CD6 | ALCAM | CD6_ALCAM | CD6 | Cervix | CC |
| ALCAM | CD6 | ALCAM_CD6 | ALCAM | Cervix | Precancer |
| CD6 | ALCAM | CD6_ALCAM | CD6 | Cervix | Precancer |
| ALCAM | CD6 | ALCAM_CD6 | ALCAM | CRC | AD |
| CD6 | ALCAM | CD6_ALCAM | CD6 | CRC | AD |
| ALCAM | CD6 | ALCAM_CD6 | ALCAM | CRC | ADJ |
| CD6 | ALCAM | CD6_ALCAM | CD6 | CRC | ADJ |
| ALCAM | CD6 | ALCAM_CD6 | ALCAM | CRC | CRC |
| CD6 | ALCAM | CD6_ALCAM | CD6 | CRC | CRC |
| ALCAM | CD6 | ALCAM_CD6 | ALCAM | CRC | FAP |
| CD6 | ALCAM | CD6_ALCAM | CD6 | CRC | FAP |
| Page: 1 2 |
Top |
Single-cell gene regulatory network inference analysis |
| Find out the significant the regulons (TFs) and the target genes of each regulon across cell types for different disease states |
| TF | Cell Type | Tissue | Disease Stage | Target Gene | RSS | Regulon Activity |
| ∗The dot plots of a searched regulon are shown for all cell subpopulations in each disease state of each tissue based on the regulon specific score inferred using pySCENIC and by calculating the average expression. |
| Page: 1 |
Top |
Somatic mutation of malignant transformation related genes |
| Annotation of somatic variants for genes involved in malignant transformation |
| Hugo Symbol | Variant Class | Variant Classification | dbSNP RS | HGVSc | HGVSp | HGVSp Short | SWISSPROT | BIOTYPE | SIFT | PolyPhen | Tumor Sample Barcode | Tissue | Histology | Sex | Age | Stage | Therapy Types | Drugs | Outcome |
| ALCAM | SNV | Missense_Mutation | c.839N>G | p.Glu280Gly | p.E280G | Q13740 | protein_coding | tolerated(0.13) | probably_damaging(0.911) | TCGA-A2-A0EO-01 | Breast | breast invasive carcinoma | Female | <65 | I/II | Hormone Therapy | tamoxiphen | SD | |
| ALCAM | SNV | Missense_Mutation | c.1528G>A | p.Glu510Lys | p.E510K | Q13740 | protein_coding | tolerated(0.29) | benign(0.307) | TCGA-AR-A0TX-01 | Breast | breast invasive carcinoma | Female | <65 | I/II | Unknown | Unknown | SD | |
| ALCAM | SNV | Missense_Mutation | c.959N>C | p.Ser320Thr | p.S320T | Q13740 | protein_coding | tolerated(0.28) | benign(0.003) | TCGA-BH-A18V-01 | Breast | breast invasive carcinoma | Female | <65 | I/II | Unknown | Unknown | SD | |
| ALCAM | SNV | Missense_Mutation | novel | c.107G>A | p.Gly36Glu | p.G36E | Q13740 | protein_coding | deleterious(0) | probably_damaging(1) | TCGA-C8-A27A-01 | Breast | breast invasive carcinoma | Female | <65 | I/II | Chemotherapy | 5-fluorouracil | CR |
| ALCAM | deletion | Frame_Shift_Del | c.453delN | p.Lys153SerfsTer34 | p.K153Sfs*34 | Q13740 | protein_coding | TCGA-D8-A1J8-01 | Breast | breast invasive carcinoma | Female | >=65 | I/II | Hormone Therapy | nolvadex | SD | |||
| ALCAM | deletion | Frame_Shift_Del | c.1211_1214delNNNN | p.Arg405SerfsTer3 | p.R405Sfs*3 | Q13740 | protein_coding | TCGA-D8-A1JK-01 | Breast | breast invasive carcinoma | Female | >=65 | I/II | Unknown | Unknown | SD | |||
| ALCAM | SNV | Missense_Mutation | c.1714N>C | p.Lys572Gln | p.K572Q | Q13740 | protein_coding | deleterious(0.01) | probably_damaging(0.987) | TCGA-C5-A1MQ-01 | Cervix | cervical & endocervical cancer | Female | <65 | I/II | Chemotherapy | cisplatin | SD | |
| ALCAM | SNV | Missense_Mutation | novel | c.1549G>A | p.Glu517Lys | p.E517K | Q13740 | protein_coding | tolerated(0.09) | benign(0.257) | TCGA-DG-A2KK-01 | Cervix | cervical & endocervical cancer | Female | <65 | III/IV | Chemotherapy | cisplatin | SD |
| ALCAM | SNV | Missense_Mutation | c.1209N>C | p.Lys403Asn | p.K403N | Q13740 | protein_coding | tolerated(0.12) | possibly_damaging(0.673) | TCGA-FU-A23L-01 | Cervix | cervical & endocervical cancer | Female | <65 | I/II | Chemotherapy | cisplatin | CR | |
| ALCAM | SNV | Missense_Mutation | c.329N>C | p.Arg110Thr | p.R110T | Q13740 | protein_coding | tolerated(0.72) | possibly_damaging(0.864) | TCGA-VS-A94W-01 | Cervix | cervical & endocervical cancer | Female | <65 | I/II | Chemotherapy | cisplatin | CR |
| Page: 1 2 3 4 5 6 7 8 9 |
Top |
Related drugs of malignant transformation related genes |
| Identification of chemicals and drugs interact with genes involved in malignant transfromation |
| (DGIdb 4.0) |
| Entrez ID | Symbol | Category | Interaction Types | Drug Claim Name | Drug Name | PMIDs |
| 214 | ALCAM | DRUG RESISTANCE, DRUGGABLE GENOME, EXTERNAL SIDE OF PLASMA MEMBRANE | FLUOROURACIL | FLUOROURACIL | 24708484 |
| Page: 1 |

Copyright 2023-Present -The University of Texas Health Science Center at Houston |