
|
|||||
|
 | |
| |
| |
| |
| |
| |
|
Gene: ALAD |
Gene summary for ALAD |
| Gene information | Species | Human | Gene symbol | ALAD | Gene ID | 210 |
| Gene name | aminolevulinate dehydratase | |
| Gene Alias | ALADH | |
| Cytomap | 9q32 | |
| Gene Type | protein-coding | GO ID | GO:0001101 | UniProtAcc | A0A140VJL9 |
Top |
Malignant transformation analysis |
| Identification of the aberrant gene expression in precancerous and cancerous lesions by comparing the gene expression of stem-like cells in diseased tissues with normal stem cells |
| Entrez ID | Symbol | Replicates | Species | Organ | Tissue | Adj P-value | Log2FC | Malignancy |
| 210 | ALAD | HTA11_78_2000001011 | Human | Colorectum | AD | 1.55e-02 | 2.71e-01 | -0.1088 |
| 210 | ALAD | HTA11_347_2000001011 | Human | Colorectum | AD | 3.15e-11 | 4.08e-01 | -0.1954 |
| 210 | ALAD | HTA11_7469_2000001011 | Human | Colorectum | AD | 2.44e-02 | 3.79e-01 | -0.0124 |
| 210 | ALAD | LZE4T | Human | Esophagus | ESCC | 6.64e-06 | 2.02e-01 | 0.0811 |
| 210 | ALAD | LZE20T | Human | Esophagus | ESCC | 4.32e-05 | 1.82e-01 | 0.0662 |
| 210 | ALAD | LZE24T | Human | Esophagus | ESCC | 3.98e-08 | 7.81e-02 | 0.0596 |
| 210 | ALAD | P1T-E | Human | Esophagus | ESCC | 3.31e-03 | 1.25e-01 | 0.0875 |
| 210 | ALAD | P2T-E | Human | Esophagus | ESCC | 1.08e-17 | 2.77e-01 | 0.1177 |
| 210 | ALAD | P4T-E | Human | Esophagus | ESCC | 8.09e-11 | 2.49e-01 | 0.1323 |
| 210 | ALAD | P5T-E | Human | Esophagus | ESCC | 3.69e-14 | 1.71e-01 | 0.1327 |
| 210 | ALAD | P8T-E | Human | Esophagus | ESCC | 2.65e-05 | 4.78e-02 | 0.0889 |
| 210 | ALAD | P9T-E | Human | Esophagus | ESCC | 2.43e-13 | 1.23e-01 | 0.1131 |
| 210 | ALAD | P10T-E | Human | Esophagus | ESCC | 5.84e-14 | 3.23e-01 | 0.116 |
| 210 | ALAD | P11T-E | Human | Esophagus | ESCC | 1.85e-07 | 3.10e-01 | 0.1426 |
| 210 | ALAD | P12T-E | Human | Esophagus | ESCC | 9.88e-12 | 1.69e-01 | 0.1122 |
| 210 | ALAD | P15T-E | Human | Esophagus | ESCC | 1.83e-15 | 3.65e-01 | 0.1149 |
| 210 | ALAD | P16T-E | Human | Esophagus | ESCC | 9.31e-05 | 1.14e-01 | 0.1153 |
| 210 | ALAD | P20T-E | Human | Esophagus | ESCC | 3.92e-04 | 1.05e-01 | 0.1124 |
| 210 | ALAD | P21T-E | Human | Esophagus | ESCC | 7.77e-16 | 2.97e-01 | 0.1617 |
| 210 | ALAD | P22T-E | Human | Esophagus | ESCC | 3.65e-17 | 1.23e-01 | 0.1236 |
| Page: 1 2 3 4 |
| Tissue | Expression Dynamics | Abbreviation |
| Colorectum (GSE201348) |  | FAP: Familial adenomatous polyposis |
| CRC: Colorectal cancer | ||
| Colorectum (HTA11) |  | AD: Adenomas |
| SER: Sessile serrated lesions | ||
| MSI-H: Microsatellite-high colorectal cancer | ||
| MSS: Microsatellite stable colorectal cancer | ||
| Esophagus | 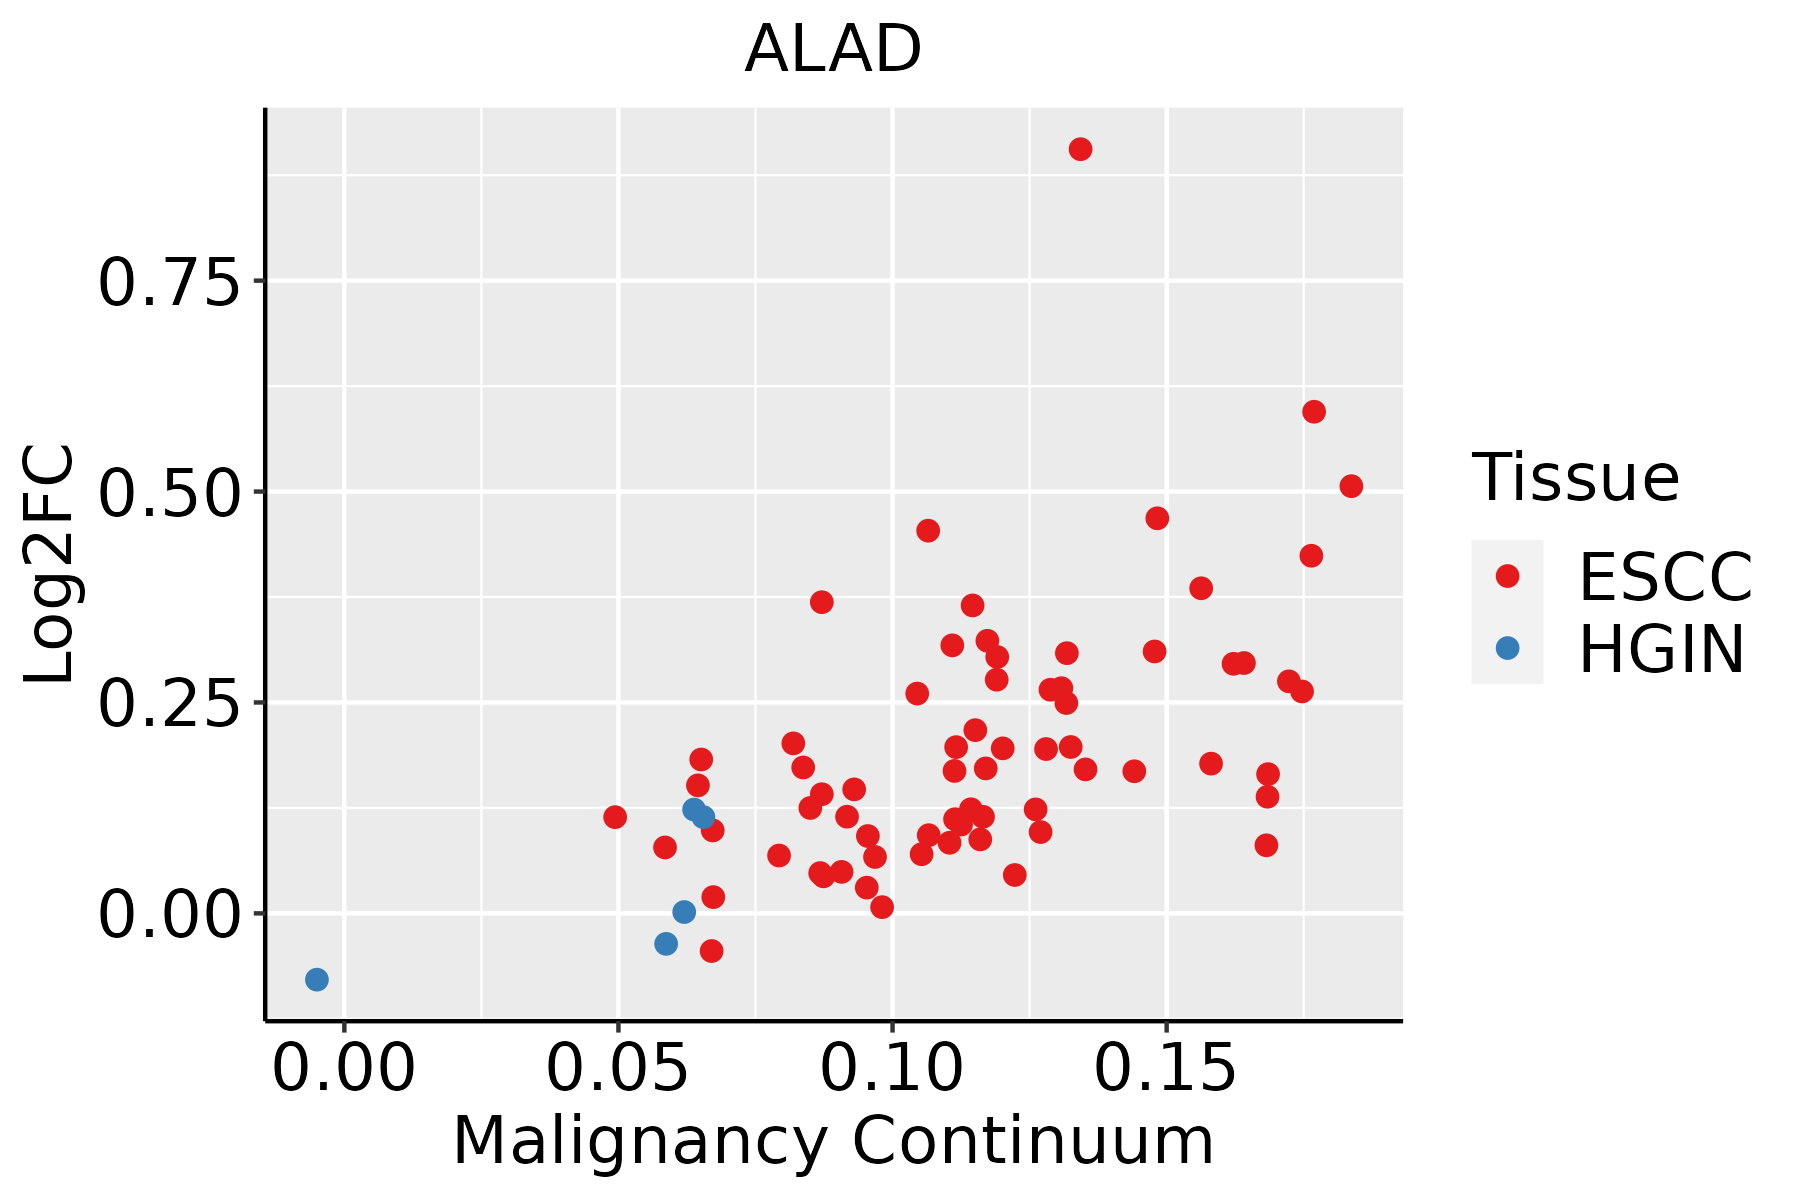 | ESCC: Esophageal squamous cell carcinoma |
| HGIN: High-grade intraepithelial neoplasias | ||
| LGIN: Low-grade intraepithelial neoplasias | ||
| Oral Cavity | 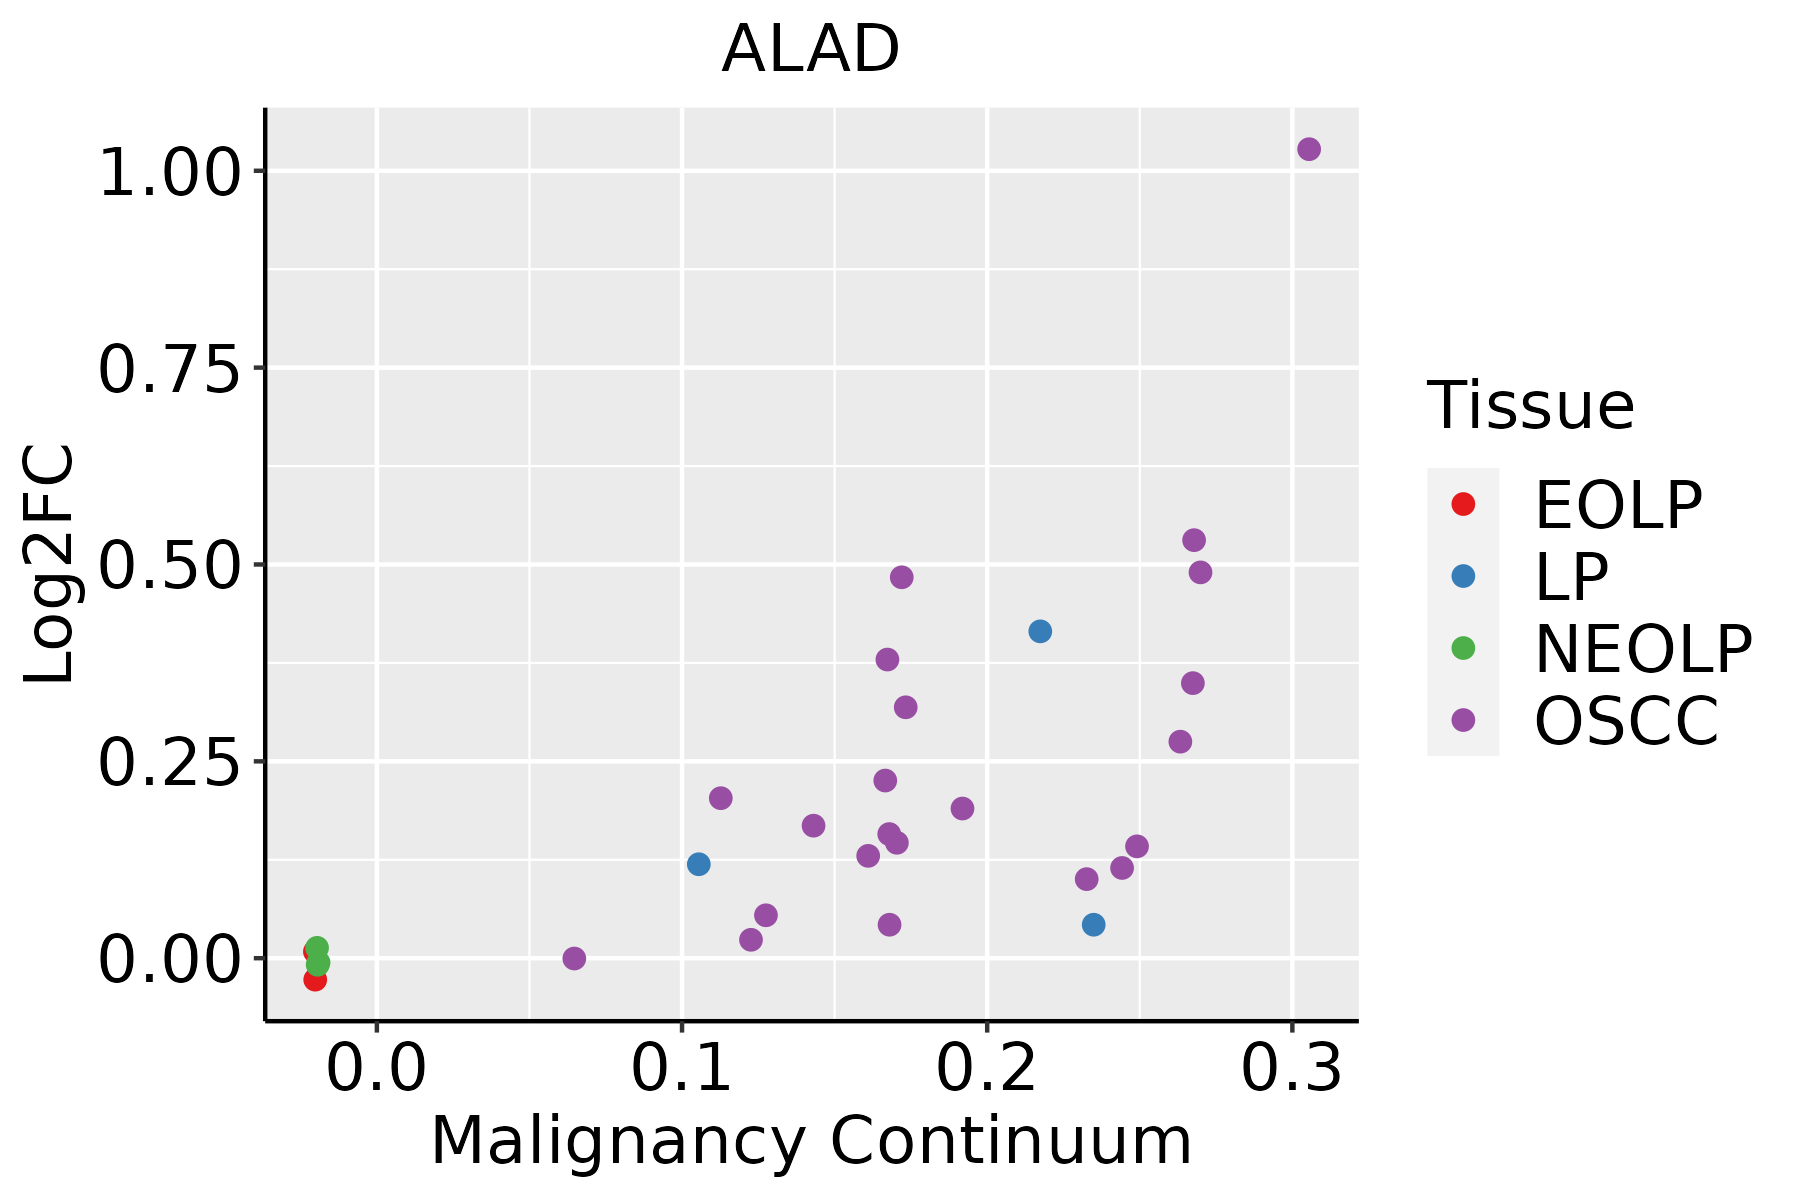 | EOLP: Erosive Oral lichen planus |
| LP: leukoplakia | ||
| NEOLP: Non-erosive oral lichen planus | ||
| OSCC: Oral squamous cell carcinoma | ||
| Prostate | 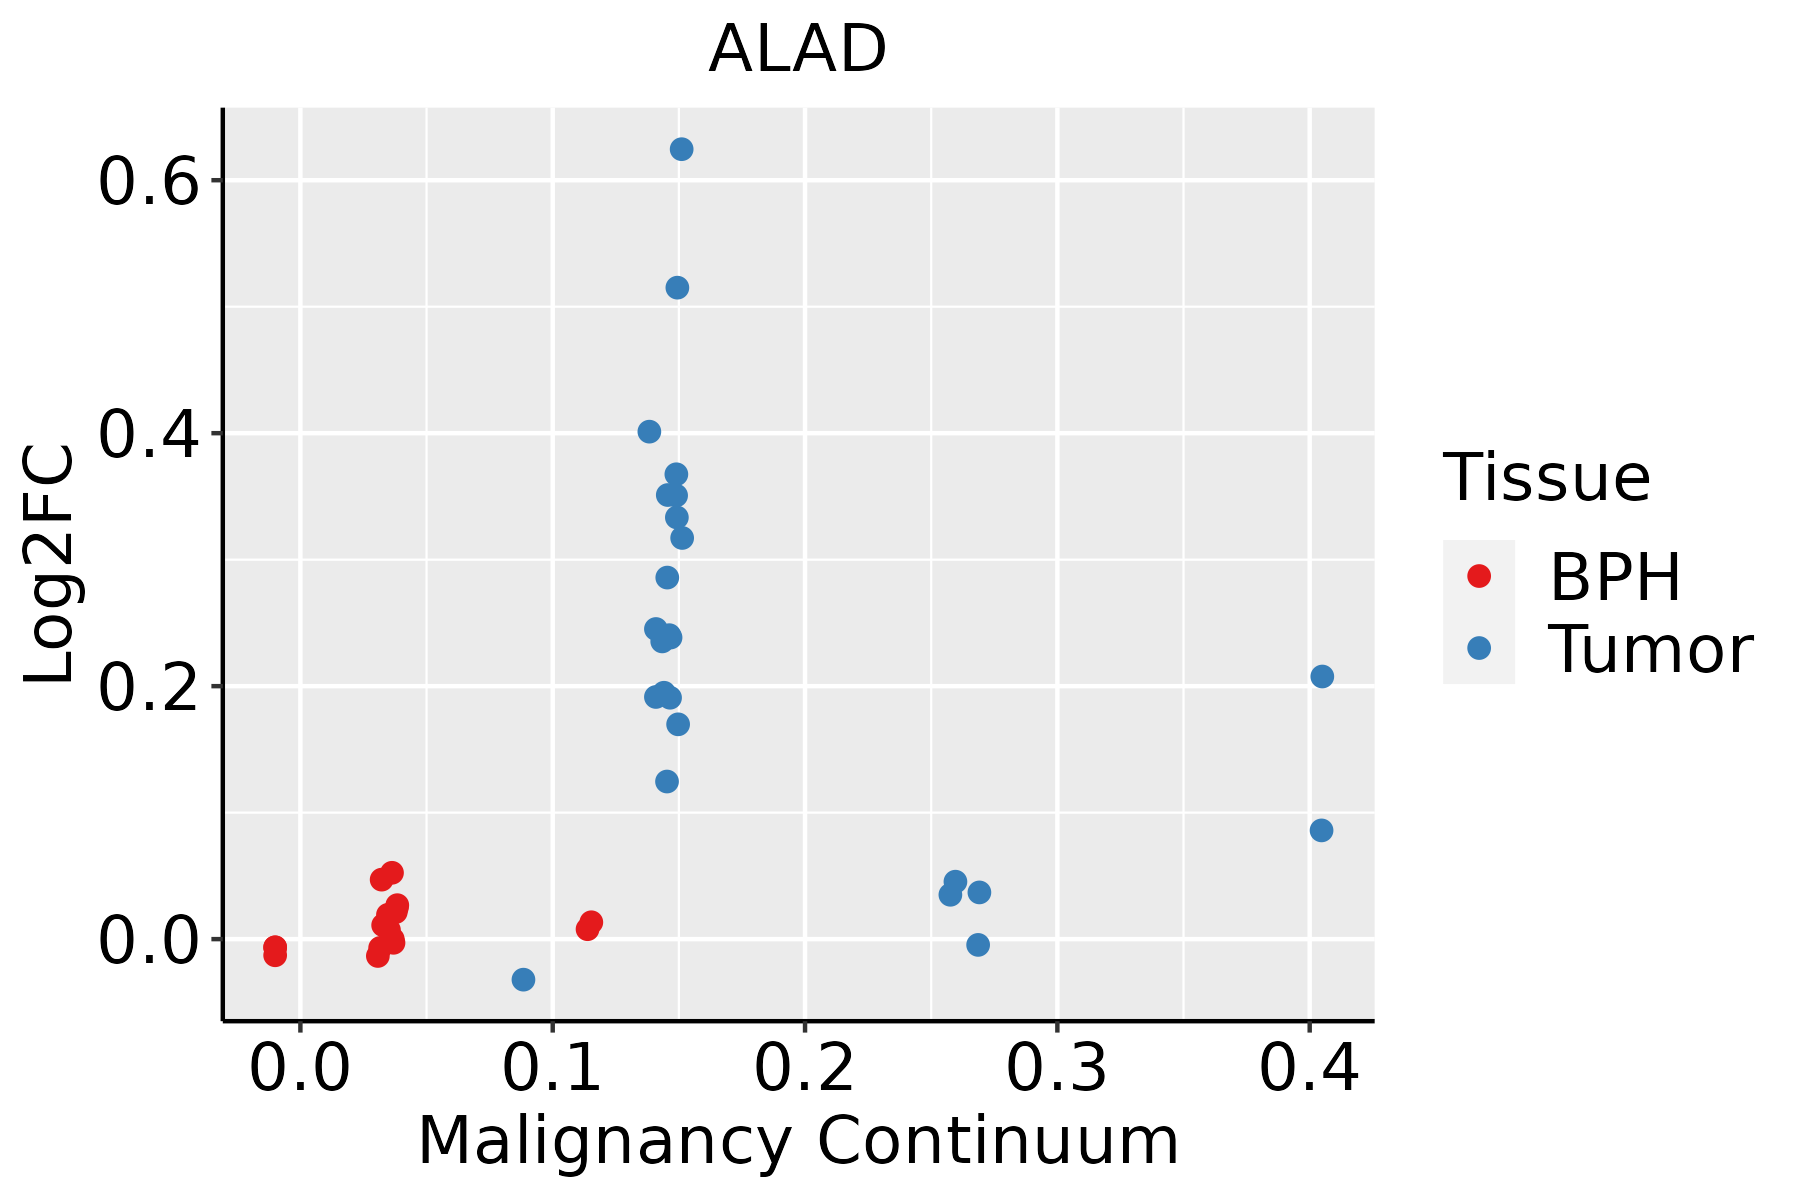 | BPH: Benign Prostatic Hyperplasia |
| ∗log2FC in expression of this searched gene in stem-like cells from each diseased tissue sample relative to stem-like cells in normal samples in each tissue plotted against the malignancy continuum. Samples are colored based on if they are from different disease stage. |
Top |
Malignant transformation related pathway analysis |
| Find out the enriched GO biological processes and KEGG pathways involved in transition from healthy to precancer to cancer |
| Tissue | Disease Stage | Enriched GO biological Processes |
| Colorectum | AD |  |
| Colorectum | SER |  |
| Colorectum | MSS |  |
| Colorectum | MSI-H |  |
| Colorectum | FAP |  |
| ∗Top 15 enriched GO BP terms are showed in the bar plot of each disease state in each tissue. Each row represents a significant GO biological process which is colored according to the -log10(p.adjust). |
| Page: 1 2 3 4 5 6 7 8 9 |
| GO ID | Tissue | Disease Stage | Description | Gene Ratio | Bg Ratio | pvalue | p.adjust | Count |
| GO:0042176 | Colorectum | AD | regulation of protein catabolic process | 160/3918 | 391/18723 | 1.06e-19 | 7.34e-17 | 160 |
| GO:1903362 | Colorectum | AD | regulation of cellular protein catabolic process | 109/3918 | 255/18723 | 2.14e-15 | 6.08e-13 | 109 |
| GO:0010498 | Colorectum | AD | proteasomal protein catabolic process | 174/3918 | 490/18723 | 3.18e-14 | 7.66e-12 | 174 |
| GO:0009895 | Colorectum | AD | negative regulation of catabolic process | 124/3918 | 320/18723 | 1.66e-13 | 3.35e-11 | 124 |
| GO:1903050 | Colorectum | AD | regulation of proteolysis involved in cellular protein catabolic process | 92/3918 | 221/18723 | 2.04e-12 | 3.19e-10 | 92 |
| GO:0031330 | Colorectum | AD | negative regulation of cellular catabolic process | 104/3918 | 262/18723 | 2.66e-12 | 3.96e-10 | 104 |
| GO:0042177 | Colorectum | AD | negative regulation of protein catabolic process | 55/3918 | 121/18723 | 1.19e-09 | 8.85e-08 | 55 |
| GO:0061136 | Colorectum | AD | regulation of proteasomal protein catabolic process | 75/3918 | 187/18723 | 1.65e-09 | 1.20e-07 | 75 |
| GO:1903363 | Colorectum | AD | negative regulation of cellular protein catabolic process | 39/3918 | 75/18723 | 2.69e-09 | 1.87e-07 | 39 |
| GO:0006979 | Colorectum | AD | response to oxidative stress | 145/3918 | 446/18723 | 5.16e-09 | 3.23e-07 | 145 |
| GO:1903051 | Colorectum | AD | negative regulation of proteolysis involved in cellular protein catabolic process | 31/3918 | 64/18723 | 8.71e-07 | 2.98e-05 | 31 |
| GO:0009636 | Colorectum | AD | response to toxic substance | 88/3918 | 262/18723 | 1.12e-06 | 3.72e-05 | 88 |
| GO:0031667 | Colorectum | AD | response to nutrient levels | 138/3918 | 474/18723 | 1.22e-05 | 2.68e-04 | 138 |
| GO:0048545 | Colorectum | AD | response to steroid hormone | 104/3918 | 339/18723 | 1.33e-05 | 2.90e-04 | 104 |
| GO:0045861 | Colorectum | AD | negative regulation of proteolysis | 106/3918 | 351/18723 | 2.33e-05 | 4.57e-04 | 106 |
| GO:1901799 | Colorectum | AD | negative regulation of proteasomal protein catabolic process | 23/3918 | 49/18723 | 4.18e-05 | 7.37e-04 | 23 |
| GO:0009410 | Colorectum | AD | response to xenobiotic stimulus | 128/3918 | 462/18723 | 2.69e-04 | 3.31e-03 | 128 |
| GO:0046686 | Colorectum | AD | response to cadmium ion | 27/3918 | 68/18723 | 3.19e-04 | 3.80e-03 | 27 |
| GO:0010038 | Colorectum | AD | response to metal ion | 106/3918 | 373/18723 | 3.22e-04 | 3.83e-03 | 106 |
| GO:0070482 | Colorectum | AD | response to oxygen levels | 99/3918 | 347/18723 | 4.29e-04 | 4.82e-03 | 99 |
| Page: 1 2 3 4 5 6 7 8 9 10 |
| Pathway ID | Tissue | Disease Stage | Description | Gene Ratio | Bg Ratio | pvalue | p.adjust | qvalue | Count |
| hsa012405 | Esophagus | ESCC | Biosynthesis of cofactors | 97/4205 | 153/8465 | 3.88e-04 | 1.35e-03 | 6.94e-04 | 97 |
| hsa0124012 | Esophagus | ESCC | Biosynthesis of cofactors | 97/4205 | 153/8465 | 3.88e-04 | 1.35e-03 | 6.94e-04 | 97 |
| hsa012404 | Oral cavity | OSCC | Biosynthesis of cofactors | 88/3704 | 153/8465 | 3.84e-04 | 1.20e-03 | 6.12e-04 | 88 |
| hsa0124011 | Oral cavity | OSCC | Biosynthesis of cofactors | 88/3704 | 153/8465 | 3.84e-04 | 1.20e-03 | 6.12e-04 | 88 |
| hsa0124021 | Oral cavity | LP | Biosynthesis of cofactors | 57/2418 | 153/8465 | 1.17e-02 | 3.91e-02 | 2.52e-02 | 57 |
| hsa0124031 | Oral cavity | LP | Biosynthesis of cofactors | 57/2418 | 153/8465 | 1.17e-02 | 3.91e-02 | 2.52e-02 | 57 |
| Page: 1 |
Top |
Cell-cell communication analysis |
| Identification of potential cell-cell interactions between two cell types and their ligand-receptor pairs for different disease states |
| Ligand | Receptor | LRpair | Pathway | Tissue | Disease Stage |
| Page: 1 |
Top |
Single-cell gene regulatory network inference analysis |
| Find out the significant the regulons (TFs) and the target genes of each regulon across cell types for different disease states |
| TF | Cell Type | Tissue | Disease Stage | Target Gene | RSS | Regulon Activity |
| ∗The dot plots of a searched regulon are shown for all cell subpopulations in each disease state of each tissue based on the regulon specific score inferred using pySCENIC and by calculating the average expression. |
| Page: 1 |
Top |
Somatic mutation of malignant transformation related genes |
| Annotation of somatic variants for genes involved in malignant transformation |
| Hugo Symbol | Variant Class | Variant Classification | dbSNP RS | HGVSc | HGVSp | HGVSp Short | SWISSPROT | BIOTYPE | SIFT | PolyPhen | Tumor Sample Barcode | Tissue | Histology | Sex | Age | Stage | Therapy Types | Drugs | Outcome |
| ALAD | SNV | Missense_Mutation | novel | c.346N>A | p.Leu116Met | p.L116M | P13716 | protein_coding | deleterious(0.01) | benign(0.197) | TCGA-EA-A3HU-01 | Cervix | cervical & endocervical cancer | Female | <65 | I/II | Unknown | Unknown | SD |
| ALAD | SNV | Missense_Mutation | c.358N>A | p.Asp120Asn | p.D120N | P13716 | protein_coding | deleterious(0) | probably_damaging(1) | TCGA-EK-A2RA-01 | Cervix | cervical & endocervical cancer | Female | >=65 | I/II | Unknown | Unknown | SD | |
| ALAD | SNV | Missense_Mutation | c.798C>G | p.Asp266Glu | p.D266E | P13716 | protein_coding | tolerated(0.77) | benign(0) | TCGA-MY-A5BD-01 | Cervix | cervical & endocervical cancer | Female | <65 | I/II | Chemotherapy | cisplatin | CR | |
| ALAD | SNV | Missense_Mutation | rs761010522 | c.575C>T | p.Ser192Leu | p.S192L | P13716 | protein_coding | tolerated(0.32) | benign(0.007) | TCGA-AA-A00N-01 | Colorectum | colon adenocarcinoma | Male | >=65 | I/II | Unknown | Unknown | PD |
| ALAD | SNV | Missense_Mutation | c.859N>T | p.His287Tyr | p.H287Y | P13716 | protein_coding | tolerated(0.99) | benign(0.127) | TCGA-AZ-4615-01 | Colorectum | colon adenocarcinoma | Male | >=65 | III/IV | Chemotherapy | xeloda | PD | |
| ALAD | SNV | Missense_Mutation | rs201127458 | c.626N>A | p.Arg209Gln | p.R209Q | P13716 | protein_coding | deleterious(0) | probably_damaging(0.997) | TCGA-AG-A02N-01 | Colorectum | rectum adenocarcinoma | Male | >=65 | I/II | Chemotherapy | folinic | CR |
| ALAD | SNV | Missense_Mutation | rs758622234 | c.520N>T | p.Arg174Cys | p.R174C | P13716 | protein_coding | deleterious(0) | probably_damaging(1) | TCGA-A5-A0G2-01 | Endometrium | uterine corpus endometrioid carcinoma | Female | <65 | III/IV | Unknown | Unknown | SD |
| ALAD | SNV | Missense_Mutation | rs556307080 | c.922N>T | p.Arg308Cys | p.R308C | P13716 | protein_coding | deleterious(0.02) | probably_damaging(0.986) | TCGA-AJ-A3BH-01 | Endometrium | uterine corpus endometrioid carcinoma | Female | Unknown | I/II | Unknown | Unknown | SD |
| ALAD | SNV | Missense_Mutation | novel | c.884N>C | p.Asp295Ala | p.D295A | P13716 | protein_coding | deleterious(0.03) | benign(0.188) | TCGA-AJ-A5DW-01 | Endometrium | uterine corpus endometrioid carcinoma | Female | <65 | I/II | Unknown | Unknown | SD |
| ALAD | SNV | Missense_Mutation | novel | c.727N>T | p.Arg243Trp | p.R243W | P13716 | protein_coding | deleterious(0.01) | possibly_damaging(0.776) | TCGA-AJ-A5DW-01 | Endometrium | uterine corpus endometrioid carcinoma | Female | <65 | I/II | Unknown | Unknown | SD |
| Page: 1 2 3 |
Top |
Related drugs of malignant transformation related genes |
| Identification of chemicals and drugs interact with genes involved in malignant transfromation |
| (DGIdb 4.0) |
| Entrez ID | Symbol | Category | Interaction Types | Drug Claim Name | Drug Name | PMIDs |
| 210 | ALAD | ENZYME | Aminolevulinic acid hci | |||
| 210 | ALAD | ENZYME | Porphobilinogen |
| Page: 1 |

Copyright 2023-Present -The University of Texas Health Science Center at Houston |