
|
|||||
|
 | |
| |
| |
| |
| |
| |
|
Gene: AKTIP |
Gene summary for AKTIP |
| Gene information | Species | Human | Gene symbol | AKTIP | Gene ID | 64400 |
| Gene name | AKT interacting protein | |
| Gene Alias | FT1 | |
| Cytomap | 16q12.2 | |
| Gene Type | protein-coding | GO ID | GO:0000209 | UniProtAcc | A0A024R6T5 |
Top |
Malignant transformation analysis |
| Identification of the aberrant gene expression in precancerous and cancerous lesions by comparing the gene expression of stem-like cells in diseased tissues with normal stem cells |
| Entrez ID | Symbol | Replicates | Species | Organ | Tissue | Adj P-value | Log2FC | Malignancy |
| 64400 | AKTIP | LZE4T | Human | Esophagus | ESCC | 4.53e-07 | 2.27e-01 | 0.0811 |
| 64400 | AKTIP | LZE7T | Human | Esophagus | ESCC | 2.04e-03 | 1.97e-01 | 0.0667 |
| 64400 | AKTIP | LZE24T | Human | Esophagus | ESCC | 1.07e-11 | 3.51e-01 | 0.0596 |
| 64400 | AKTIP | P1T-E | Human | Esophagus | ESCC | 3.07e-02 | 1.50e-01 | 0.0875 |
| 64400 | AKTIP | P2T-E | Human | Esophagus | ESCC | 2.62e-08 | 8.02e-02 | 0.1177 |
| 64400 | AKTIP | P4T-E | Human | Esophagus | ESCC | 4.83e-14 | 2.99e-01 | 0.1323 |
| 64400 | AKTIP | P5T-E | Human | Esophagus | ESCC | 1.57e-05 | 1.15e-01 | 0.1327 |
| 64400 | AKTIP | P8T-E | Human | Esophagus | ESCC | 3.86e-17 | 3.70e-01 | 0.0889 |
| 64400 | AKTIP | P10T-E | Human | Esophagus | ESCC | 8.78e-05 | 1.57e-01 | 0.116 |
| 64400 | AKTIP | P11T-E | Human | Esophagus | ESCC | 2.43e-03 | 1.73e-01 | 0.1426 |
| 64400 | AKTIP | P12T-E | Human | Esophagus | ESCC | 1.00e-16 | 2.05e-01 | 0.1122 |
| 64400 | AKTIP | P15T-E | Human | Esophagus | ESCC | 4.61e-05 | 1.35e-01 | 0.1149 |
| 64400 | AKTIP | P16T-E | Human | Esophagus | ESCC | 3.94e-03 | 8.23e-02 | 0.1153 |
| 64400 | AKTIP | P17T-E | Human | Esophagus | ESCC | 7.61e-03 | 1.88e-01 | 0.1278 |
| 64400 | AKTIP | P19T-E | Human | Esophagus | ESCC | 2.33e-04 | 2.79e-01 | 0.1662 |
| 64400 | AKTIP | P20T-E | Human | Esophagus | ESCC | 1.47e-10 | 2.39e-01 | 0.1124 |
| 64400 | AKTIP | P21T-E | Human | Esophagus | ESCC | 5.12e-12 | 2.74e-01 | 0.1617 |
| 64400 | AKTIP | P22T-E | Human | Esophagus | ESCC | 3.24e-05 | 1.10e-01 | 0.1236 |
| 64400 | AKTIP | P23T-E | Human | Esophagus | ESCC | 7.42e-09 | 2.89e-01 | 0.108 |
| 64400 | AKTIP | P24T-E | Human | Esophagus | ESCC | 1.20e-05 | 1.21e-01 | 0.1287 |
| Page: 1 2 3 4 |
| Tissue | Expression Dynamics | Abbreviation |
| Esophagus | 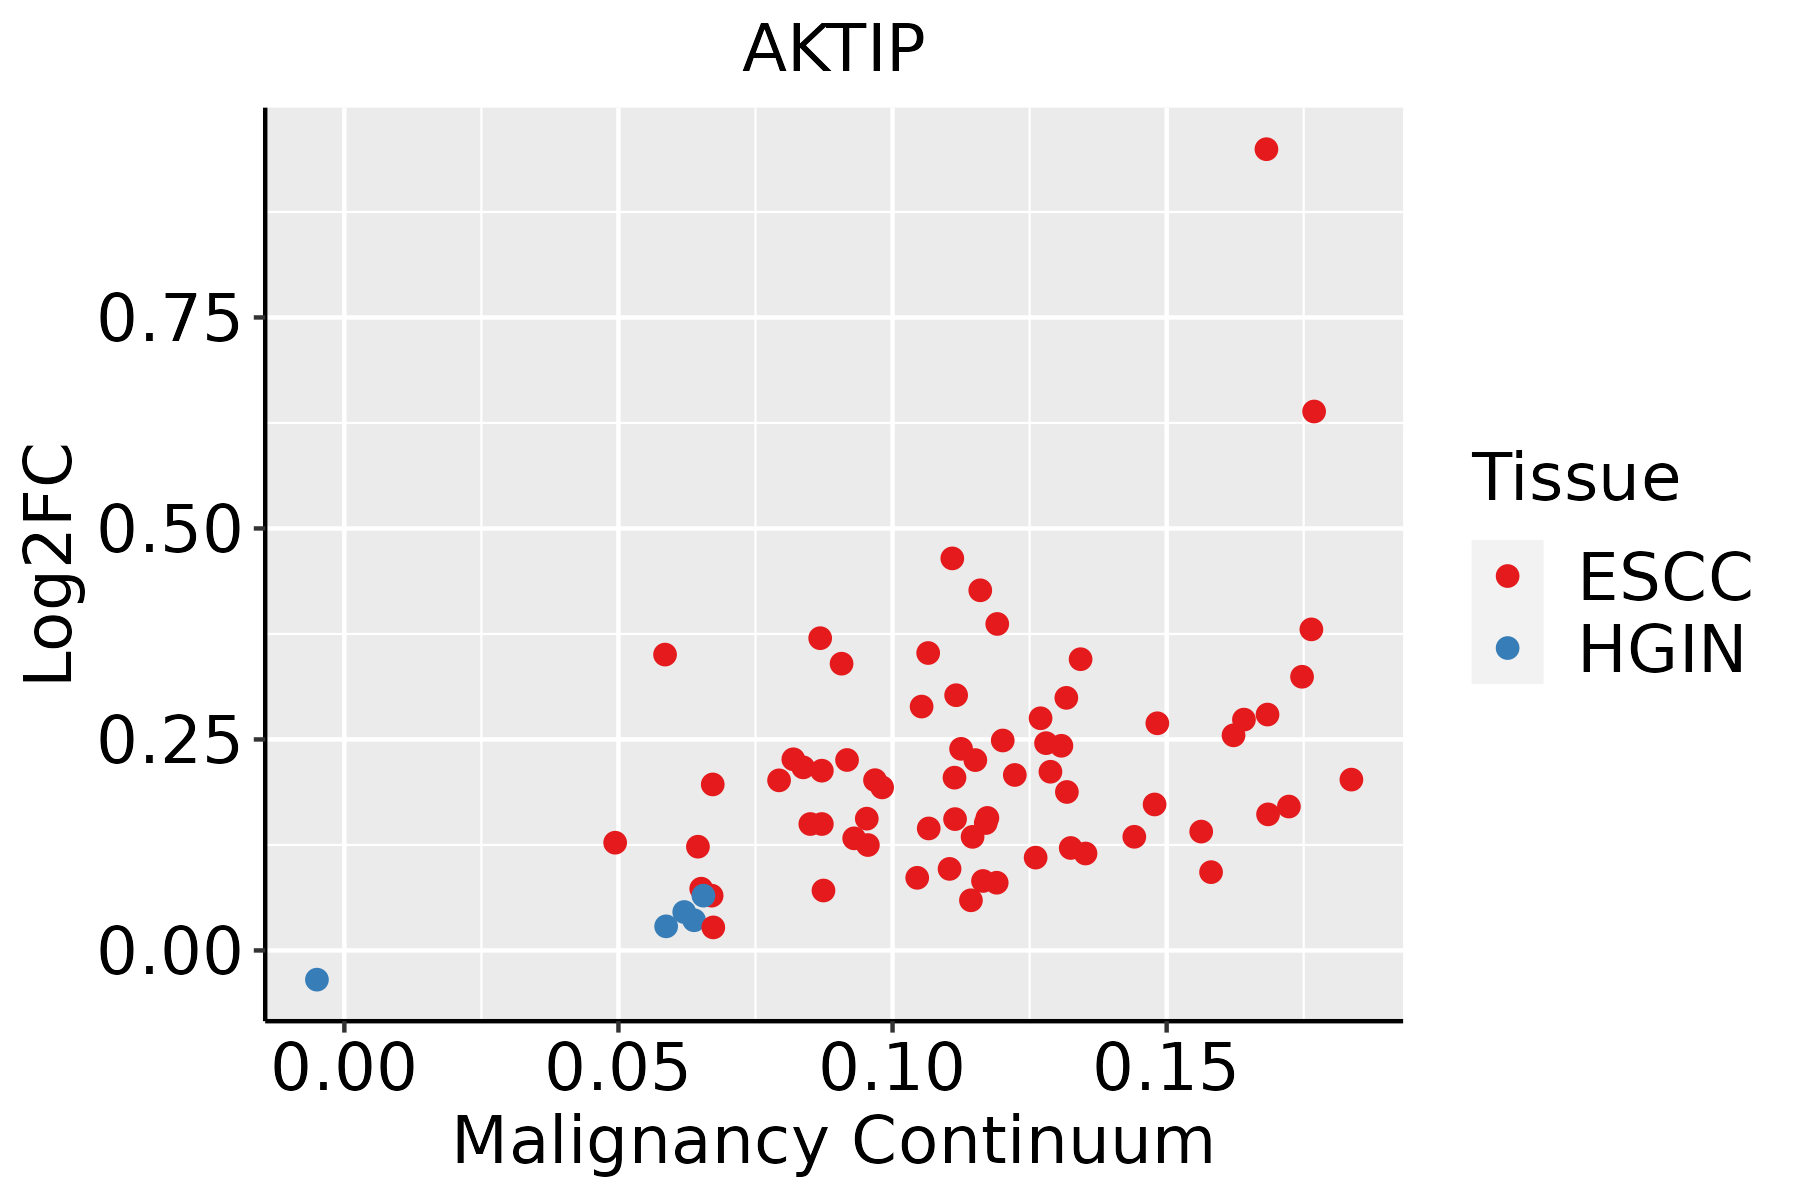 | ESCC: Esophageal squamous cell carcinoma |
| HGIN: High-grade intraepithelial neoplasias | ||
| LGIN: Low-grade intraepithelial neoplasias | ||
| Liver |  | HCC: Hepatocellular carcinoma |
| NAFLD: Non-alcoholic fatty liver disease | ||
| Oral Cavity | 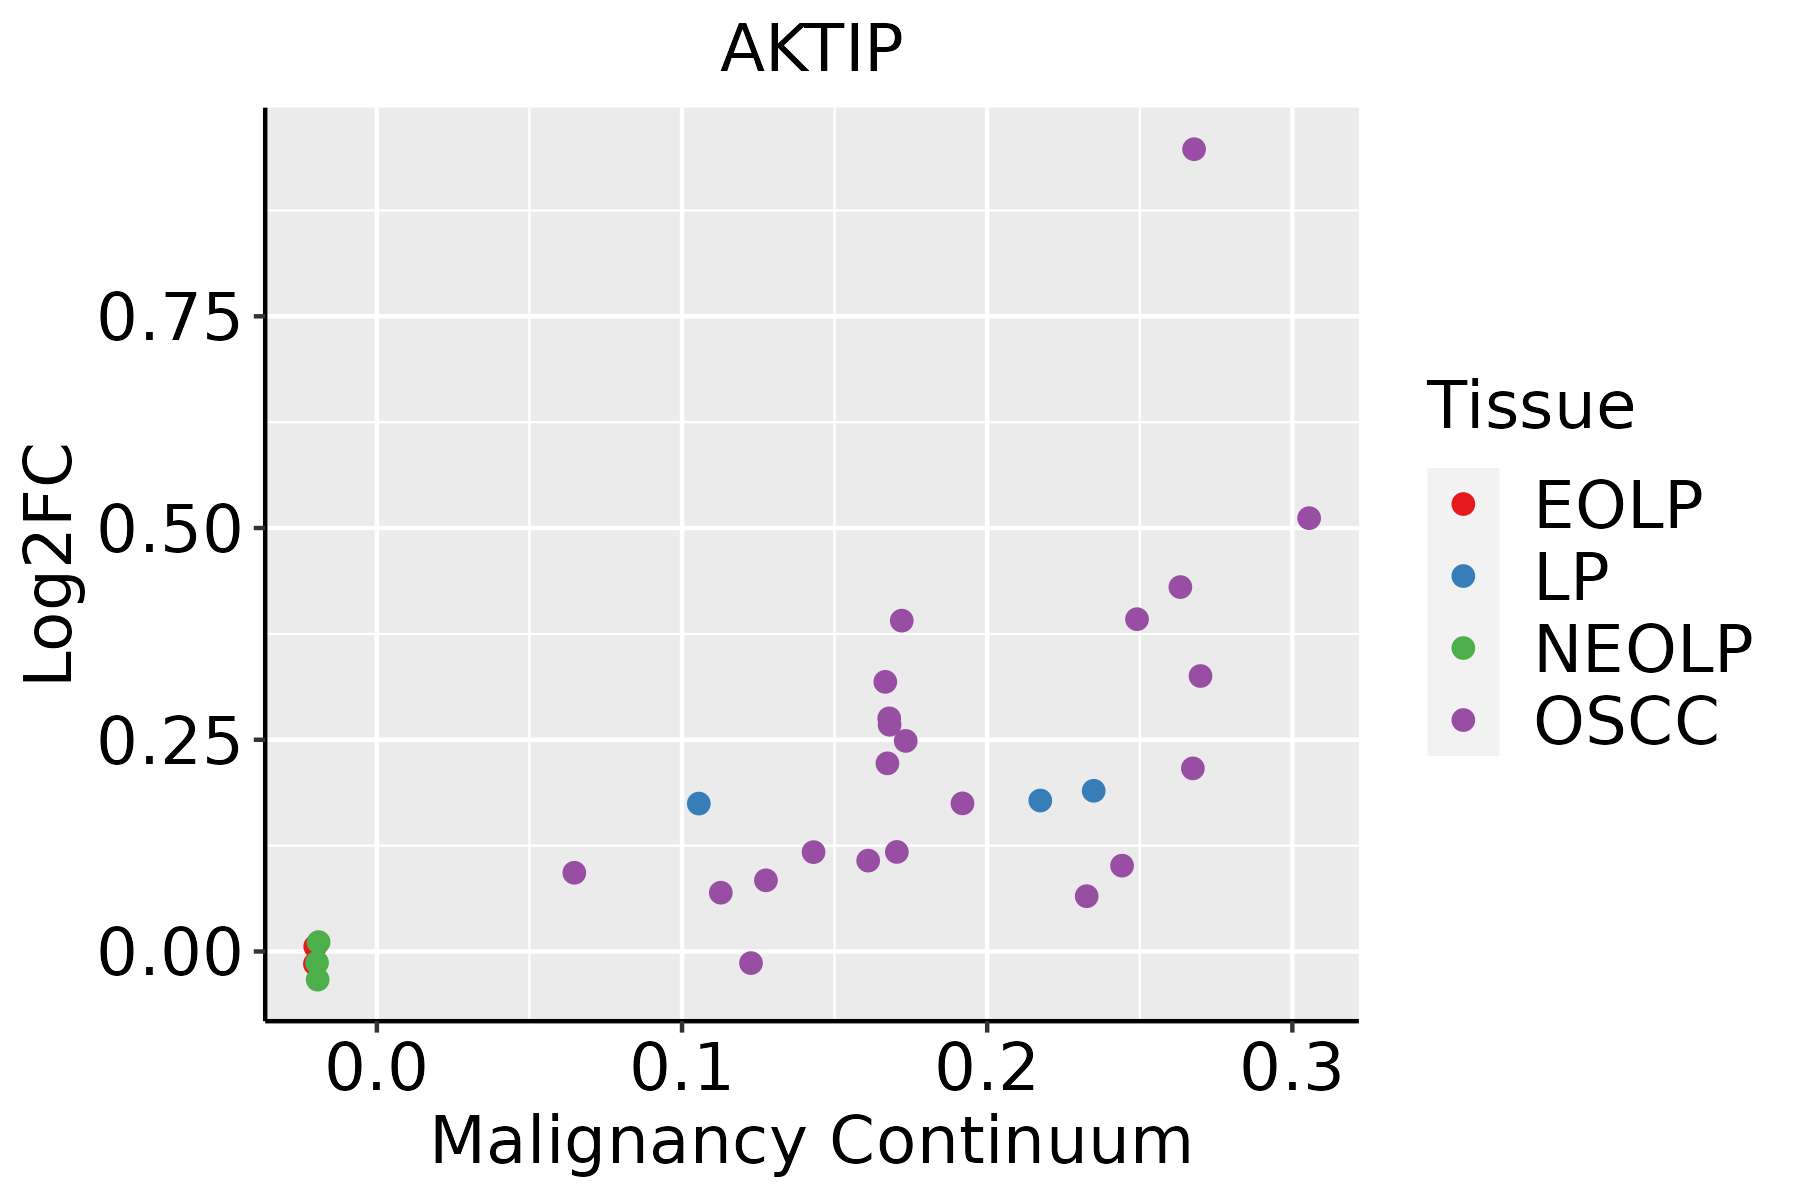 | EOLP: Erosive Oral lichen planus |
| LP: leukoplakia | ||
| NEOLP: Non-erosive oral lichen planus | ||
| OSCC: Oral squamous cell carcinoma |
| ∗log2FC in expression of this searched gene in stem-like cells from each diseased tissue sample relative to stem-like cells in normal samples in each tissue plotted against the malignancy continuum. Samples are colored based on if they are from different disease stage. |
Top |
Malignant transformation related pathway analysis |
| Find out the enriched GO biological processes and KEGG pathways involved in transition from healthy to precancer to cancer |
| Tissue | Disease Stage | Enriched GO biological Processes |
| Colorectum | AD |  |
| Colorectum | SER |  |
| Colorectum | MSS |  |
| Colorectum | MSI-H |  |
| Colorectum | FAP |  |
| ∗Top 15 enriched GO BP terms are showed in the bar plot of each disease state in each tissue. Each row represents a significant GO biological process which is colored according to the -log10(p.adjust). |
| Page: 1 2 3 4 5 6 7 8 9 |
| GO ID | Tissue | Disease Stage | Description | Gene Ratio | Bg Ratio | pvalue | p.adjust | Count |
| GO:0051098111 | Esophagus | ESCC | regulation of binding | 251/8552 | 363/18723 | 6.73e-20 | 8.46e-18 | 251 |
| GO:001605014 | Esophagus | ESCC | vesicle organization | 211/8552 | 300/18723 | 2.85e-18 | 2.87e-16 | 211 |
| GO:000020917 | Esophagus | ESCC | protein polyubiquitination | 170/8552 | 236/18723 | 1.40e-16 | 1.09e-14 | 170 |
| GO:000703417 | Esophagus | ESCC | vacuolar transport | 119/8552 | 157/18723 | 1.16e-14 | 6.30e-13 | 119 |
| GO:001648210 | Esophagus | ESCC | cytosolic transport | 124/8552 | 168/18723 | 9.69e-14 | 4.69e-12 | 124 |
| GO:000703314 | Esophagus | ESCC | vacuole organization | 127/8552 | 180/18723 | 1.04e-11 | 3.85e-10 | 127 |
| GO:0051099111 | Esophagus | ESCC | positive regulation of binding | 122/8552 | 173/18723 | 2.79e-11 | 9.45e-10 | 122 |
| GO:004339320 | Esophagus | ESCC | regulation of protein binding | 135/8552 | 196/18723 | 3.69e-11 | 1.22e-09 | 135 |
| GO:00070419 | Esophagus | ESCC | lysosomal transport | 83/8552 | 114/18723 | 3.52e-09 | 7.41e-08 | 83 |
| GO:000703214 | Esophagus | ESCC | endosome organization | 61/8552 | 82/18723 | 1.13e-07 | 1.85e-06 | 61 |
| GO:00989278 | Esophagus | ESCC | vesicle-mediated transport between endosomal compartments | 36/8552 | 43/18723 | 2.90e-07 | 4.20e-06 | 36 |
| GO:00450226 | Esophagus | ESCC | early endosome to late endosome transport | 33/8552 | 40/18723 | 1.80e-06 | 2.11e-05 | 33 |
| GO:003209216 | Esophagus | ESCC | positive regulation of protein binding | 60/8552 | 85/18723 | 2.83e-06 | 3.22e-05 | 60 |
| GO:00070403 | Esophagus | ESCC | lysosome organization | 53/8552 | 74/18723 | 5.34e-06 | 5.57e-05 | 53 |
| GO:00801713 | Esophagus | ESCC | lytic vacuole organization | 53/8552 | 74/18723 | 5.34e-06 | 5.57e-05 | 53 |
| GO:00083333 | Esophagus | ESCC | endosome to lysosome transport | 40/8552 | 55/18723 | 4.27e-05 | 3.42e-04 | 40 |
| GO:001605011 | Liver | Cirrhotic | vesicle organization | 133/4634 | 300/18723 | 7.35e-14 | 6.41e-12 | 133 |
| GO:005109812 | Liver | Cirrhotic | regulation of binding | 148/4634 | 363/18723 | 9.14e-12 | 5.97e-10 | 148 |
| GO:000703411 | Liver | Cirrhotic | vacuolar transport | 75/4634 | 157/18723 | 3.13e-10 | 1.53e-08 | 75 |
| GO:00070332 | Liver | Cirrhotic | vacuole organization | 80/4634 | 180/18723 | 5.73e-09 | 2.25e-07 | 80 |
| Page: 1 2 3 4 |
| Pathway ID | Tissue | Disease Stage | Description | Gene Ratio | Bg Ratio | pvalue | p.adjust | qvalue | Count |
| Page: 1 |
Top |
Cell-cell communication analysis |
| Identification of potential cell-cell interactions between two cell types and their ligand-receptor pairs for different disease states |
| Ligand | Receptor | LRpair | Pathway | Tissue | Disease Stage |
| Page: 1 |
Top |
Single-cell gene regulatory network inference analysis |
| Find out the significant the regulons (TFs) and the target genes of each regulon across cell types for different disease states |
| TF | Cell Type | Tissue | Disease Stage | Target Gene | RSS | Regulon Activity |
| ∗The dot plots of a searched regulon are shown for all cell subpopulations in each disease state of each tissue based on the regulon specific score inferred using pySCENIC and by calculating the average expression. |
| Page: 1 |
Top |
Somatic mutation of malignant transformation related genes |
| Annotation of somatic variants for genes involved in malignant transformation |
| Hugo Symbol | Variant Class | Variant Classification | dbSNP RS | HGVSc | HGVSp | HGVSp Short | SWISSPROT | BIOTYPE | SIFT | PolyPhen | Tumor Sample Barcode | Tissue | Histology | Sex | Age | Stage | Therapy Types | Drugs | Outcome |
| AKTIP | SNV | Missense_Mutation | c.8C>G | p.Pro3Arg | p.P3R | Q9H8T0 | protein_coding | deleterious_low_confidence(0) | possibly_damaging(0.714) | TCGA-E2-A158-01 | Breast | breast invasive carcinoma | Female | <65 | I/II | Chemotherapy | arimidex | SD | |
| AKTIP | insertion | Nonsense_Mutation | novel | c.286_287insCTCTTTAGCTTTAAATAACGTGACTGCCTTGTCCTGAAGCTCTTT | p.Val96delinsAlaLeuTerLeuTerIleThrTerLeuProCysProGluAlaLeuLeu | p.V96delinsAL*L*IT*LPCPEALL | Q9H8T0 | protein_coding | TCGA-BH-A0B1-01 | Breast | breast invasive carcinoma | Female | >=65 | I/II | Chemotherapy | adriamycin | SD | ||
| AKTIP | SNV | Missense_Mutation | c.718N>G | p.Pro240Ala | p.P240A | Q9H8T0 | protein_coding | tolerated(0.1) | benign(0.003) | TCGA-JW-A5VL-01 | Cervix | cervical & endocervical cancer | Female | <65 | I/II | Unknown | Unknown | SD | |
| AKTIP | SNV | Missense_Mutation | rs752514939 | c.442N>T | p.His148Tyr | p.H148Y | Q9H8T0 | protein_coding | deleterious(0) | probably_damaging(0.999) | TCGA-JW-A5VL-01 | Cervix | cervical & endocervical cancer | Female | <65 | I/II | Unknown | Unknown | SD |
| AKTIP | SNV | Missense_Mutation | rs528168629 | c.668G>A | p.Arg223His | p.R223H | Q9H8T0 | protein_coding | tolerated(1) | benign(0) | TCGA-AA-3697-01 | Colorectum | colon adenocarcinoma | Male | >=65 | I/II | Unknown | Unknown | SD |
| AKTIP | SNV | Missense_Mutation | rs779924211 | c.37N>T | p.Arg13Cys | p.R13C | Q9H8T0 | protein_coding | tolerated_low_confidence(0.11) | probably_damaging(0.994) | TCGA-CK-4952-01 | Colorectum | colon adenocarcinoma | Female | <65 | III/IV | Unknown | Unknown | SD |
| AKTIP | SNV | Missense_Mutation | rs771776966 | c.875N>T | p.Ala292Val | p.A292V | Q9H8T0 | protein_coding | tolerated_low_confidence(0.3) | benign(0.018) | TCGA-F5-6814-01 | Colorectum | rectum adenocarcinoma | Male | <65 | I/II | Unknown | Unknown | SD |
| AKTIP | deletion | Frame_Shift_Del | c.612delN | p.Asp205IlefsTer26 | p.D205Ifs*26 | Q9H8T0 | protein_coding | TCGA-A6-5665-01 | Colorectum | colon adenocarcinoma | Female | >=65 | I/II | Unknown | Unknown | PD | |||
| AKTIP | SNV | Missense_Mutation | novel | c.466N>T | p.Gly156Cys | p.G156C | Q9H8T0 | protein_coding | deleterious(0.04) | probably_damaging(0.999) | TCGA-A5-A1OF-01 | Endometrium | uterine corpus endometrioid carcinoma | Female | <65 | I/II | Unknown | Unknown | SD |
| AKTIP | SNV | Missense_Mutation | c.848N>A | p.Pro283His | p.P283H | Q9H8T0 | protein_coding | deleterious(0.02) | probably_damaging(0.929) | TCGA-AP-A059-01 | Endometrium | uterine corpus endometrioid carcinoma | Female | >=65 | I/II | Unknown | Unknown | SD |
| Page: 1 2 3 |
Top |
Related drugs of malignant transformation related genes |
| Identification of chemicals and drugs interact with genes involved in malignant transfromation |
| (DGIdb 4.0) |
| Entrez ID | Symbol | Category | Interaction Types | Drug Claim Name | Drug Name | PMIDs |
| Page: 1 |

Copyright 2023-Present -The University of Texas Health Science Center at Houston |