
|
|||||
|
 | |
| |
| |
| |
| |
| |
|
Gene: AKT3 |
Gene summary for AKT3 |
| Gene information | Species | Human | Gene symbol | AKT3 | Gene ID | 10000 |
| Gene name | AKT serine/threonine kinase 3 | |
| Gene Alias | MPPH | |
| Cytomap | 1q43-q44 | |
| Gene Type | protein-coding | GO ID | GO:0000002 | UniProtAcc | Q9Y243 |
Top |
Malignant transformation analysis |
| Identification of the aberrant gene expression in precancerous and cancerous lesions by comparing the gene expression of stem-like cells in diseased tissues with normal stem cells |
| Entrez ID | Symbol | Replicates | Species | Organ | Tissue | Adj P-value | Log2FC | Malignancy |
| 10000 | AKT3 | LZE2T | Human | Esophagus | ESCC | 5.81e-05 | 5.45e-01 | 0.082 |
| 10000 | AKT3 | LZE7T | Human | Esophagus | ESCC | 5.22e-05 | 3.66e-01 | 0.0667 |
| 10000 | AKT3 | P2T-E | Human | Esophagus | ESCC | 1.47e-14 | 2.27e-01 | 0.1177 |
| 10000 | AKT3 | P9T-E | Human | Esophagus | ESCC | 4.63e-10 | 2.55e-01 | 0.1131 |
| 10000 | AKT3 | P11T-E | Human | Esophagus | ESCC | 2.94e-02 | 2.20e-01 | 0.1426 |
| 10000 | AKT3 | P16T-E | Human | Esophagus | ESCC | 8.84e-05 | 1.12e-01 | 0.1153 |
| 10000 | AKT3 | P19T-E | Human | Esophagus | ESCC | 5.34e-06 | 4.46e-01 | 0.1662 |
| 10000 | AKT3 | P22T-E | Human | Esophagus | ESCC | 9.40e-24 | 3.22e-01 | 0.1236 |
| 10000 | AKT3 | P24T-E | Human | Esophagus | ESCC | 4.40e-09 | 1.78e-01 | 0.1287 |
| 10000 | AKT3 | P26T-E | Human | Esophagus | ESCC | 4.24e-18 | 3.12e-01 | 0.1276 |
| 10000 | AKT3 | P30T-E | Human | Esophagus | ESCC | 9.74e-10 | 3.98e-01 | 0.137 |
| 10000 | AKT3 | P32T-E | Human | Esophagus | ESCC | 1.46e-12 | 1.68e-01 | 0.1666 |
| 10000 | AKT3 | P36T-E | Human | Esophagus | ESCC | 2.78e-03 | 2.01e-01 | 0.1187 |
| 10000 | AKT3 | P37T-E | Human | Esophagus | ESCC | 3.65e-06 | 2.06e-01 | 0.1371 |
| 10000 | AKT3 | P49T-E | Human | Esophagus | ESCC | 8.87e-06 | 2.97e-01 | 0.1768 |
| 10000 | AKT3 | P52T-E | Human | Esophagus | ESCC | 1.66e-02 | 7.96e-02 | 0.1555 |
| 10000 | AKT3 | P62T-E | Human | Esophagus | ESCC | 1.57e-03 | 6.99e-02 | 0.1302 |
| 10000 | AKT3 | P76T-E | Human | Esophagus | ESCC | 7.98e-13 | 2.75e-01 | 0.1207 |
| 10000 | AKT3 | P83T-E | Human | Esophagus | ESCC | 4.85e-04 | 9.93e-02 | 0.1738 |
| 10000 | AKT3 | P107T-E | Human | Esophagus | ESCC | 5.01e-13 | 2.94e-01 | 0.171 |
| Page: 1 2 3 4 |
| Tissue | Expression Dynamics | Abbreviation |
| Esophagus | 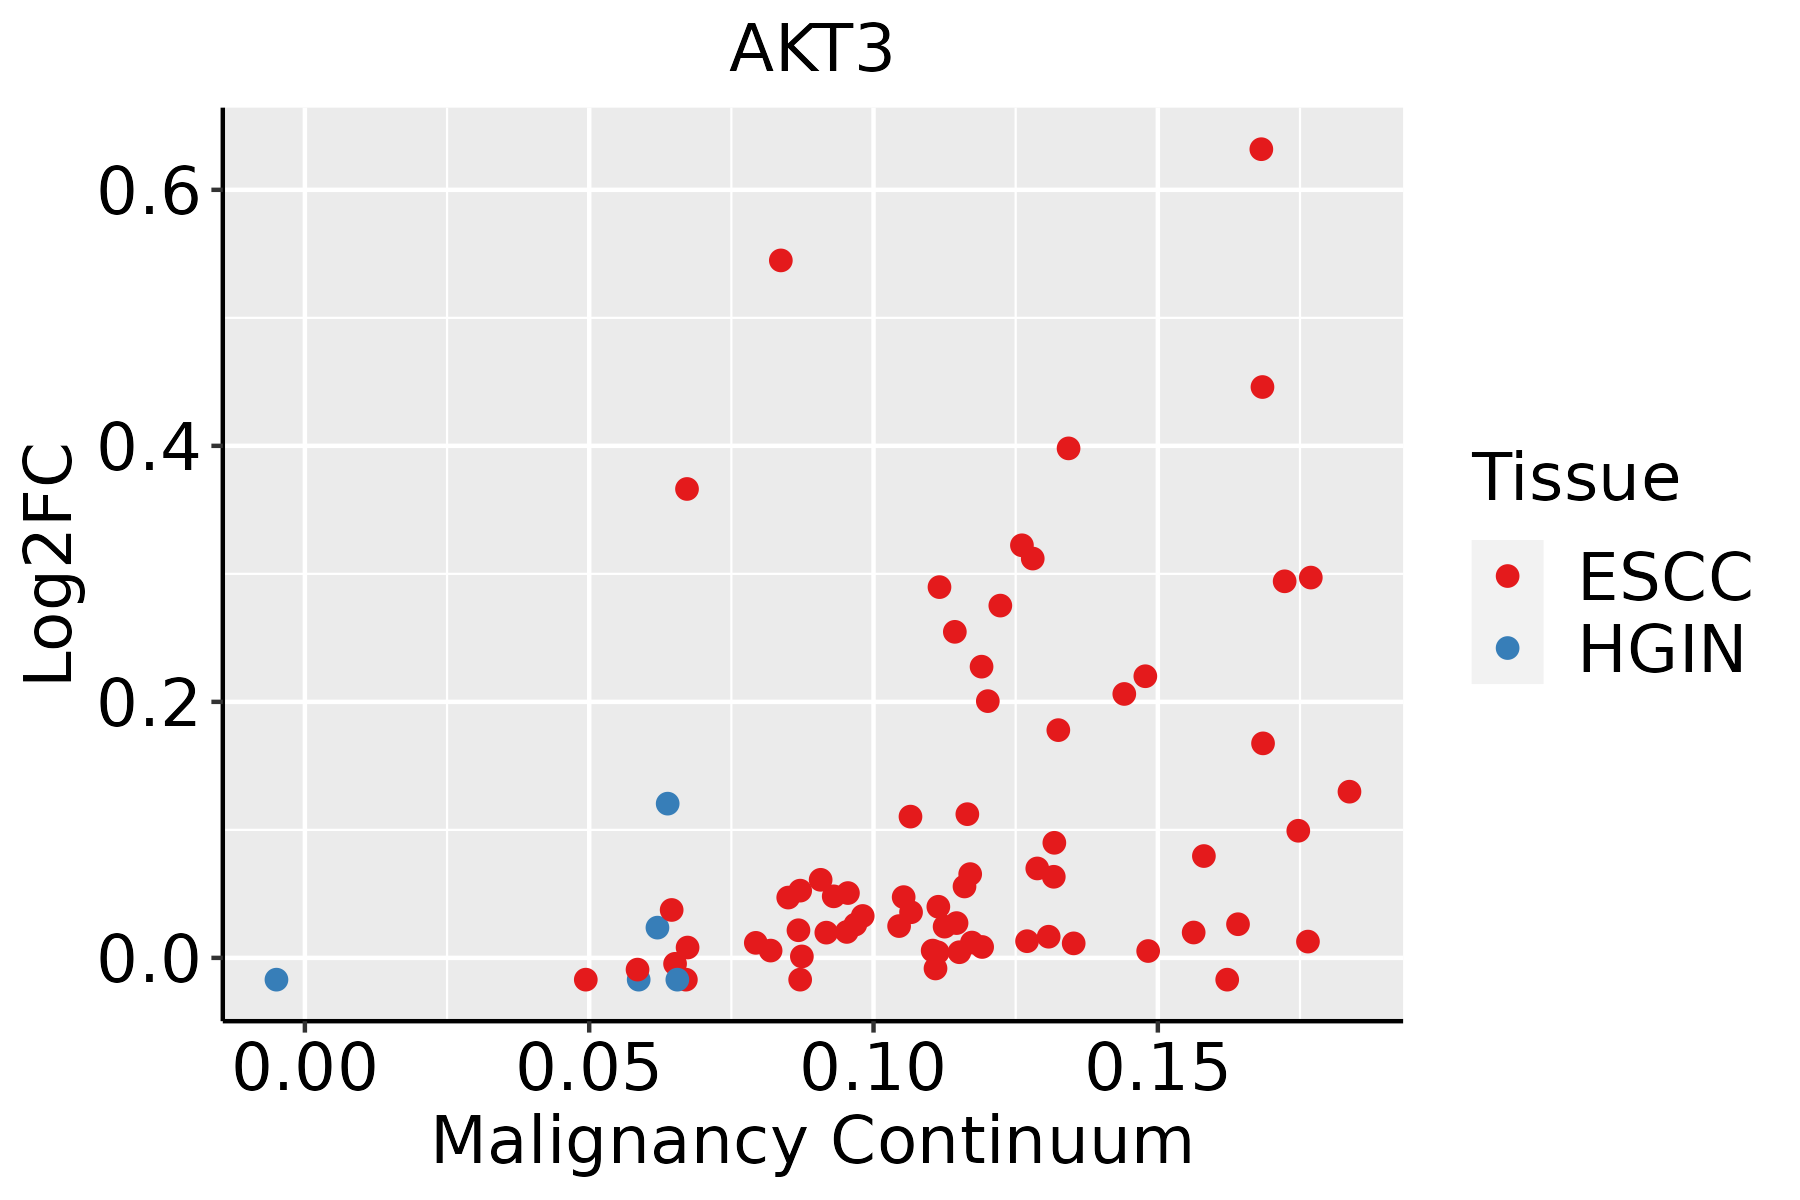 | ESCC: Esophageal squamous cell carcinoma |
| HGIN: High-grade intraepithelial neoplasias | ||
| LGIN: Low-grade intraepithelial neoplasias | ||
| Oral Cavity |  | EOLP: Erosive Oral lichen planus |
| LP: leukoplakia | ||
| NEOLP: Non-erosive oral lichen planus | ||
| OSCC: Oral squamous cell carcinoma | ||
| Prostate | 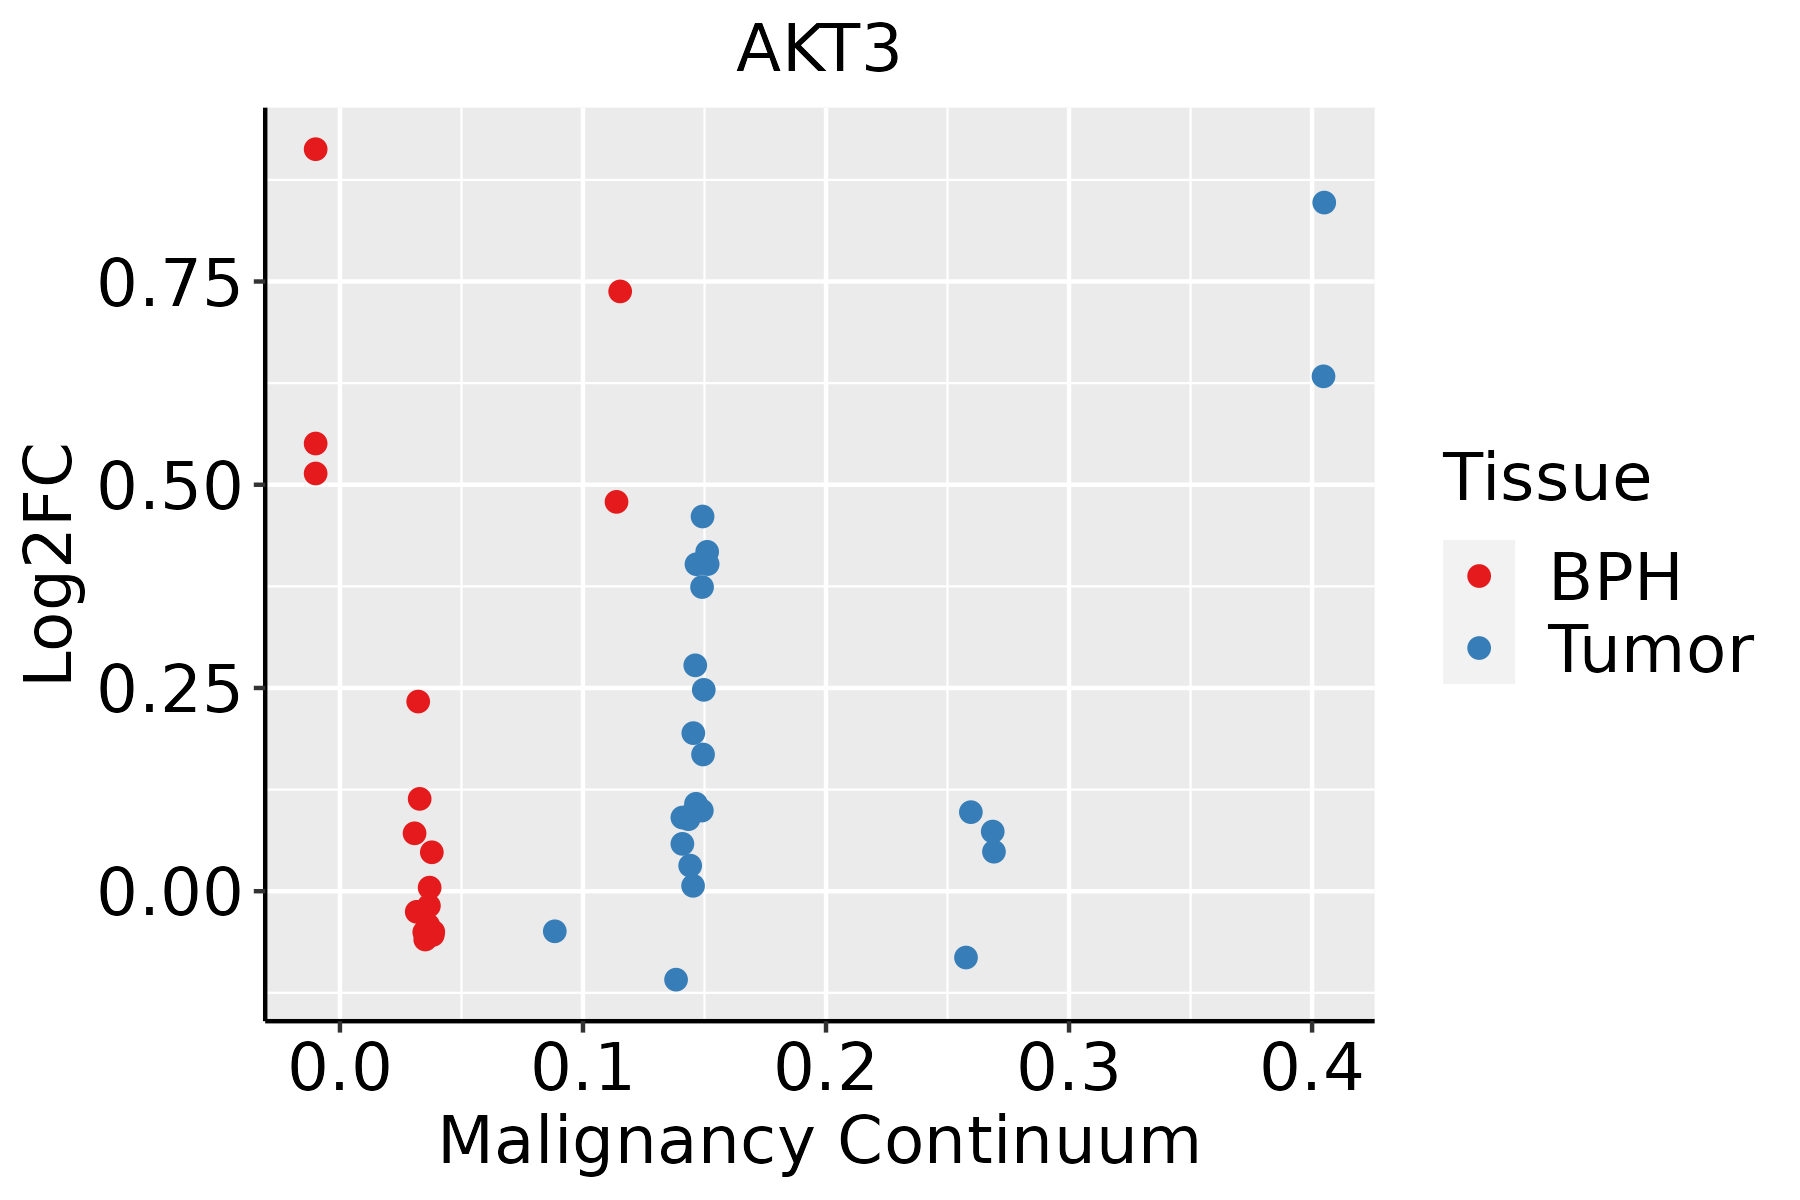 | BPH: Benign Prostatic Hyperplasia |
| Thyroid | 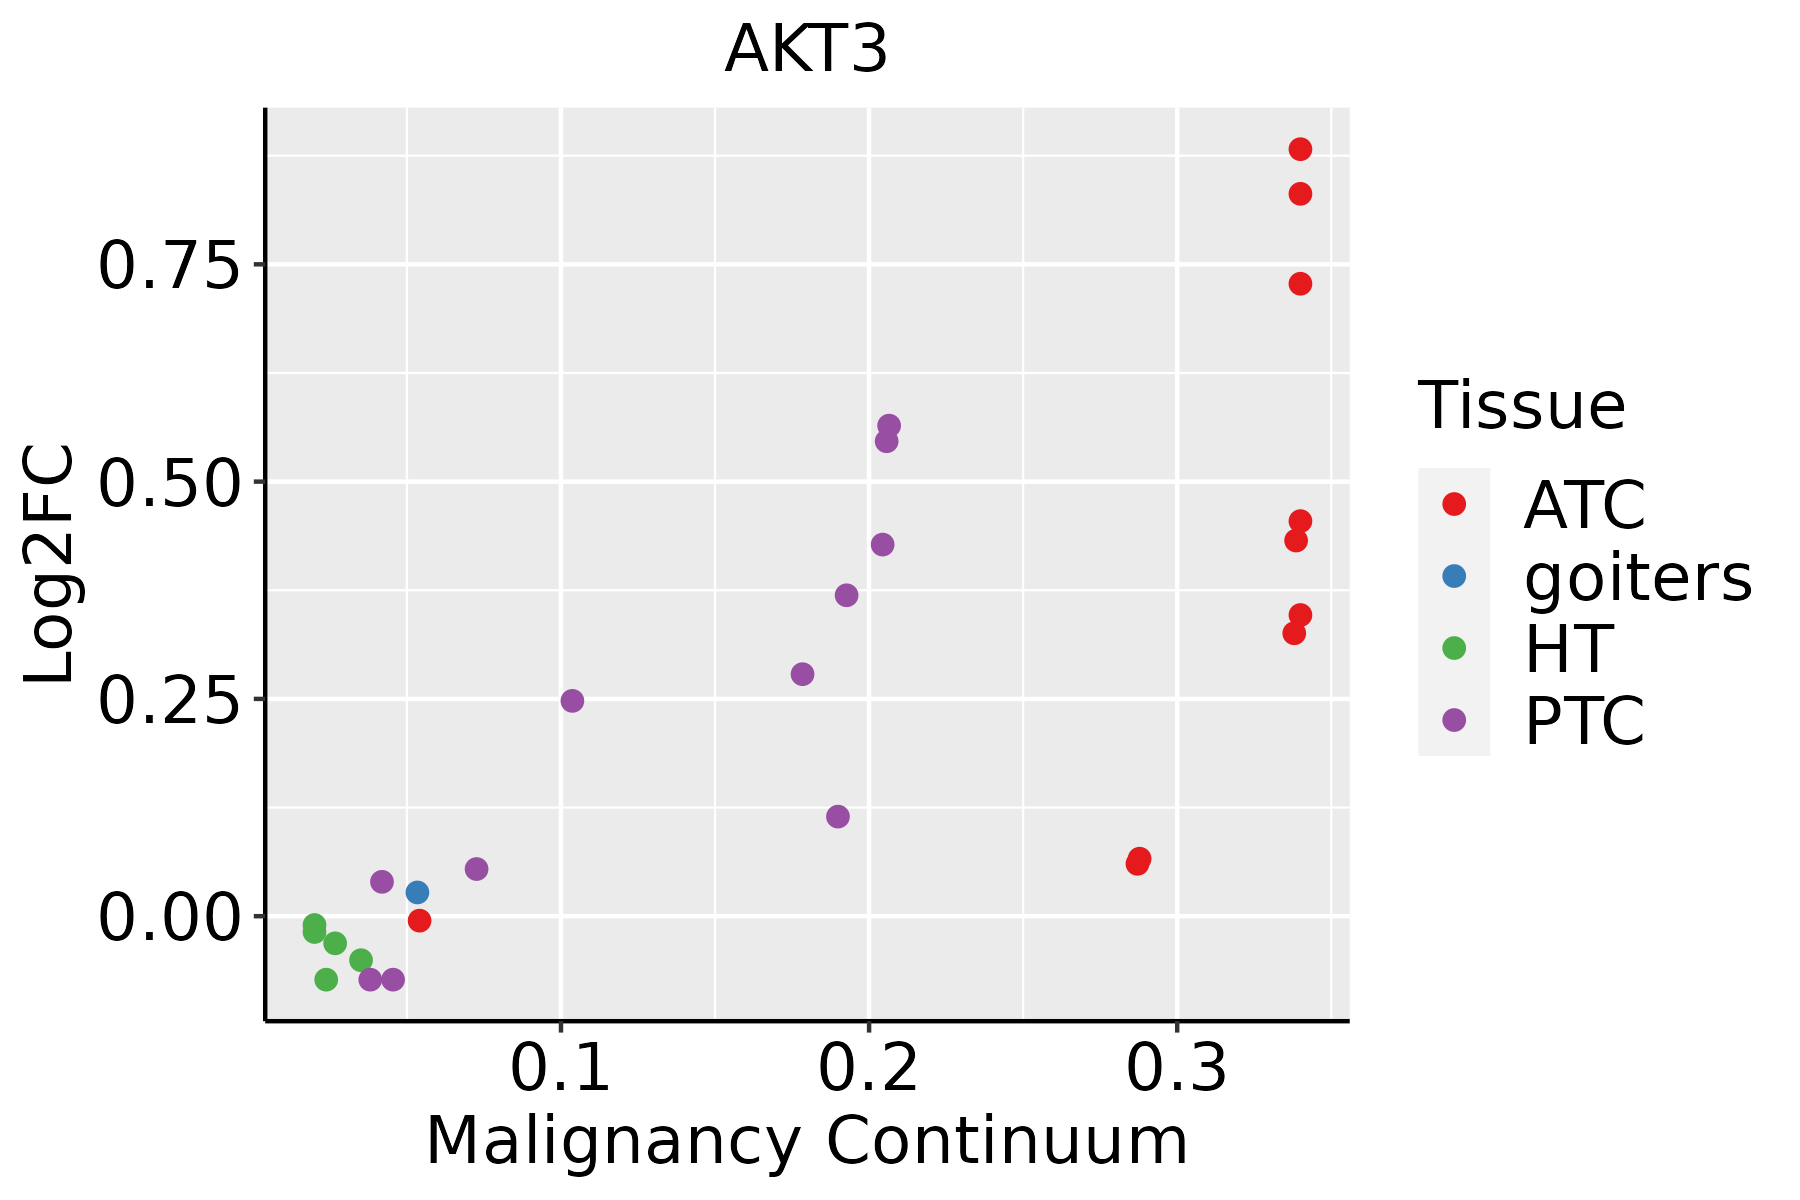 | ATC: Anaplastic thyroid cancer |
| HT: Hashimoto's thyroiditis | ||
| PTC: Papillary thyroid cancer |
| ∗log2FC in expression of this searched gene in stem-like cells from each diseased tissue sample relative to stem-like cells in normal samples in each tissue plotted against the malignancy continuum. Samples are colored based on if they are from different disease stage. |
Top |
Malignant transformation related pathway analysis |
| Find out the enriched GO biological processes and KEGG pathways involved in transition from healthy to precancer to cancer |
| Tissue | Disease Stage | Enriched GO biological Processes |
| Colorectum | AD |  |
| Colorectum | SER |  |
| Colorectum | MSS |  |
| Colorectum | MSI-H |  |
| Colorectum | FAP |  |
| ∗Top 15 enriched GO BP terms are showed in the bar plot of each disease state in each tissue. Each row represents a significant GO biological process which is colored according to the -log10(p.adjust). |
| Page: 1 2 3 4 5 6 7 8 9 |
| GO ID | Tissue | Disease Stage | Description | Gene Ratio | Bg Ratio | pvalue | p.adjust | Count |
| GO:003253520 | Esophagus | ESCC | regulation of cellular component size | 227/8552 | 383/18723 | 4.77e-08 | 8.60e-07 | 227 |
| GO:000756820 | Esophagus | ESCC | aging | 201/8552 | 339/18723 | 2.64e-07 | 3.94e-06 | 201 |
| GO:0048872111 | Esophagus | ESCC | homeostasis of number of cells | 163/8552 | 272/18723 | 1.40e-06 | 1.69e-05 | 163 |
| GO:00182099 | Esophagus | ESCC | peptidyl-serine modification | 196/8552 | 338/18723 | 3.07e-06 | 3.47e-05 | 196 |
| GO:001810515 | Esophagus | ESCC | peptidyl-serine phosphorylation | 184/8552 | 315/18723 | 3.22e-06 | 3.61e-05 | 184 |
| GO:00319294 | Esophagus | ESCC | TOR signaling | 79/8552 | 126/18723 | 8.57e-05 | 6.21e-04 | 79 |
| GO:005067318 | Esophagus | ESCC | epithelial cell proliferation | 238/8552 | 437/18723 | 1.19e-04 | 8.20e-04 | 238 |
| GO:00083619 | Esophagus | ESCC | regulation of cell size | 107/8552 | 181/18723 | 1.81e-04 | 1.16e-03 | 107 |
| GO:00075699 | Esophagus | ESCC | cell aging | 81/8552 | 132/18723 | 2.00e-04 | 1.27e-03 | 81 |
| GO:005067817 | Esophagus | ESCC | regulation of epithelial cell proliferation | 206/8552 | 381/18723 | 5.51e-04 | 3.02e-03 | 206 |
| GO:00000021 | Esophagus | ESCC | mitochondrial genome maintenance | 17/8552 | 21/18723 | 1.03e-03 | 5.19e-03 | 17 |
| GO:000166720 | Esophagus | ESCC | ameboidal-type cell migration | 250/8552 | 475/18723 | 1.22e-03 | 5.97e-03 | 250 |
| GO:00320061 | Esophagus | ESCC | regulation of TOR signaling | 63/8552 | 104/18723 | 1.55e-03 | 7.29e-03 | 63 |
| GO:00320082 | Esophagus | ESCC | positive regulation of TOR signaling | 31/8552 | 47/18723 | 4.01e-03 | 1.62e-02 | 31 |
| GO:001063120 | Esophagus | ESCC | epithelial cell migration | 187/8552 | 357/18723 | 6.05e-03 | 2.23e-02 | 187 |
| GO:009013220 | Esophagus | ESCC | epithelium migration | 188/8552 | 360/18723 | 6.96e-03 | 2.54e-02 | 188 |
| GO:009013020 | Esophagus | ESCC | tissue migration | 190/8552 | 365/18723 | 7.91e-03 | 2.82e-02 | 190 |
| GO:00903984 | Esophagus | ESCC | cellular senescence | 54/8552 | 93/18723 | 1.08e-02 | 3.67e-02 | 54 |
| GO:000756818 | Oral cavity | OSCC | aging | 194/7305 | 339/18723 | 6.18e-12 | 2.33e-10 | 194 |
| GO:004887220 | Oral cavity | OSCC | homeostasis of number of cells | 152/7305 | 272/18723 | 1.08e-08 | 2.23e-07 | 152 |
| Page: 1 2 3 4 5 6 7 8 9 10 |
| Pathway ID | Tissue | Disease Stage | Description | Gene Ratio | Bg Ratio | pvalue | p.adjust | qvalue | Count |
| hsa05132211 | Esophagus | ESCC | Salmonella infection | 191/4205 | 249/8465 | 6.51e-19 | 5.45e-17 | 2.79e-17 | 191 |
| hsa05208211 | Esophagus | ESCC | Chemical carcinogenesis - reactive oxygen species | 168/4205 | 223/8465 | 1.83e-15 | 6.81e-14 | 3.49e-14 | 168 |
| hsa05010210 | Esophagus | ESCC | Alzheimer disease | 263/4205 | 384/8465 | 1.80e-14 | 5.47e-13 | 2.80e-13 | 263 |
| hsa04932210 | Esophagus | ESCC | Non-alcoholic fatty liver disease | 122/4205 | 155/8465 | 5.69e-14 | 1.59e-12 | 8.14e-13 | 122 |
| hsa05166211 | Esophagus | ESCC | Human T-cell leukemia virus 1 infection | 164/4205 | 222/8465 | 8.13e-14 | 2.09e-12 | 1.07e-12 | 164 |
| hsa05169210 | Esophagus | ESCC | Epstein-Barr virus infection | 151/4205 | 202/8465 | 1.55e-13 | 3.45e-12 | 1.77e-12 | 151 |
| hsa05418211 | Esophagus | ESCC | Fluid shear stress and atherosclerosis | 109/4205 | 139/8465 | 2.00e-12 | 3.72e-11 | 1.90e-11 | 109 |
| hsa05131211 | Esophagus | ESCC | Shigellosis | 176/4205 | 247/8465 | 2.27e-12 | 4.01e-11 | 2.05e-11 | 176 |
| hsa0421829 | Esophagus | ESCC | Cellular senescence | 119/4205 | 156/8465 | 5.89e-12 | 9.40e-11 | 4.81e-11 | 119 |
| hsa05415211 | Esophagus | ESCC | Diabetic cardiomyopathy | 146/4205 | 203/8465 | 5.81e-11 | 7.78e-10 | 3.99e-10 | 146 |
| hsa0466810 | Esophagus | ESCC | TNF signaling pathway | 89/4205 | 114/8465 | 3.36e-10 | 4.01e-09 | 2.06e-09 | 89 |
| hsa0421027 | Esophagus | ESCC | Apoptosis | 102/4205 | 136/8465 | 1.05e-09 | 1.21e-08 | 6.21e-09 | 102 |
| hsa05170210 | Esophagus | ESCC | Human immunodeficiency virus 1 infection | 147/4205 | 212/8465 | 3.37e-09 | 3.53e-08 | 1.81e-08 | 147 |
| hsa0521020 | Esophagus | ESCC | Colorectal cancer | 69/4205 | 86/8465 | 4.06e-09 | 4.13e-08 | 2.11e-08 | 69 |
| hsa05167211 | Esophagus | ESCC | Kaposi sarcoma-associated herpesvirus infection | 136/4205 | 194/8465 | 4.28e-09 | 4.22e-08 | 2.16e-08 | 136 |
| hsa0516425 | Esophagus | ESCC | Influenza A | 122/4205 | 171/8465 | 5.01e-09 | 4.79e-08 | 2.45e-08 | 122 |
| hsa0521216 | Esophagus | ESCC | Pancreatic cancer | 62/4205 | 76/8465 | 7.37e-09 | 6.85e-08 | 3.51e-08 | 62 |
| hsa0516510 | Esophagus | ESCC | Human papillomavirus infection | 215/4205 | 331/8465 | 7.86e-09 | 7.12e-08 | 3.65e-08 | 215 |
| hsa0513526 | Esophagus | ESCC | Yersinia infection | 100/4205 | 137/8465 | 1.80e-08 | 1.59e-07 | 8.12e-08 | 100 |
| hsa0522020 | Esophagus | ESCC | Chronic myeloid leukemia | 61/4205 | 76/8465 | 3.20e-08 | 2.68e-07 | 1.37e-07 | 61 |
| Page: 1 2 3 4 5 6 7 8 9 10 11 12 13 14 15 16 17 18 19 20 21 22 23 24 25 26 27 28 29 |
Top |
Cell-cell communication analysis |
| Identification of potential cell-cell interactions between two cell types and their ligand-receptor pairs for different disease states |
| Ligand | Receptor | LRpair | Pathway | Tissue | Disease Stage |
| Page: 1 |
Top |
Single-cell gene regulatory network inference analysis |
| Find out the significant the regulons (TFs) and the target genes of each regulon across cell types for different disease states |
| TF | Cell Type | Tissue | Disease Stage | Target Gene | RSS | Regulon Activity |
| ∗The dot plots of a searched regulon are shown for all cell subpopulations in each disease state of each tissue based on the regulon specific score inferred using pySCENIC and by calculating the average expression. |
| Page: 1 |
Top |
Somatic mutation of malignant transformation related genes |
| Annotation of somatic variants for genes involved in malignant transformation |
| Hugo Symbol | Variant Class | Variant Classification | dbSNP RS | HGVSc | HGVSp | HGVSp Short | SWISSPROT | BIOTYPE | SIFT | PolyPhen | Tumor Sample Barcode | Tissue | Histology | Sex | Age | Stage | Therapy Types | Drugs | Outcome |
| AKT3 | SNV | Missense_Mutation | novel | c.453N>C | p.Leu151Phe | p.L151F | Q9Y243 | protein_coding | deleterious(0) | probably_damaging(0.96) | TCGA-5L-AAT1-01 | Breast | breast invasive carcinoma | Female | <65 | III/IV | Hormone Therapy | letrozol | SD |
| AKT3 | SNV | Missense_Mutation | rs772090769 | c.793N>A | p.Gly265Arg | p.G265R | Q9Y243 | protein_coding | tolerated(0.67) | benign(0) | TCGA-A2-A0ET-01 | Breast | breast invasive carcinoma | Female | <65 | III/IV | Chemotherapy | cytoxan | SD |
| AKT3 | SNV | Missense_Mutation | c.1118N>G | p.Ala373Gly | p.A373G | Q9Y243 | protein_coding | tolerated(0.09) | benign(0.117) | TCGA-AC-A2FF-01 | Breast | breast invasive carcinoma | Female | <65 | I/II | Chemotherapy | cytoxan | CR | |
| AKT3 | SNV | Missense_Mutation | c.928C>G | p.Pro310Ala | p.P310A | Q9Y243 | protein_coding | deleterious(0.01) | probably_damaging(0.977) | TCGA-AR-A0TU-01 | Breast | breast invasive carcinoma | Female | <65 | I/II | Unspecific | Doxorubicin | SD | |
| AKT3 | SNV | Missense_Mutation | c.1421C>T | p.Ser474Phe | p.S474F | Q9Y243 | protein_coding | tolerated(0.05) | possibly_damaging(0.783) | TCGA-E2-A1B1-01 | Breast | breast invasive carcinoma | Female | <65 | I/II | Other, specify in notesbiphosphonate | zoledronic | SD | |
| AKT3 | SNV | Missense_Mutation | c.250N>A | p.Glu84Lys | p.E84K | Q9Y243 | protein_coding | deleterious(0.01) | probably_damaging(0.984) | TCGA-E9-A1R4-01 | Breast | breast invasive carcinoma | Female | >=65 | I/II | Chemotherapy | 5-fluorouracil | SD | |
| AKT3 | SNV | Missense_Mutation | novel | c.47G>C | p.Gly16Ala | p.G16A | Q9Y243 | protein_coding | deleterious(0) | probably_damaging(0.992) | TCGA-4J-AA1J-01 | Cervix | cervical & endocervical cancer | Female | <65 | I/II | Unknown | Unknown | SD |
| AKT3 | SNV | Missense_Mutation | c.629C>T | p.Ser210Phe | p.S210F | Q9Y243 | protein_coding | deleterious(0.01) | benign(0.285) | TCGA-C5-A7UE-01 | Cervix | cervical & endocervical cancer | Female | <65 | I/II | Chemotherapy | cisplatin | SD | |
| AKT3 | SNV | Missense_Mutation | c.1212N>G | p.Phe404Leu | p.F404L | Q9Y243 | protein_coding | deleterious(0.03) | probably_damaging(0.997) | TCGA-DR-A0ZM-01 | Cervix | cervical & endocervical cancer | Female | <65 | III/IV | Unspecific | Cisplatin | SD | |
| AKT3 | SNV | Missense_Mutation | c.164C>T | p.Ser55Leu | p.S55L | Q9Y243 | protein_coding | tolerated(0.05) | benign(0.16) | TCGA-Q1-A73O-01 | Cervix | cervical & endocervical cancer | Female | <65 | I/II | Chemotherapy | cisplatin | CR |
| Page: 1 2 3 4 5 6 7 8 9 |
Top |
Related drugs of malignant transformation related genes |
| Identification of chemicals and drugs interact with genes involved in malignant transfromation |
| (DGIdb 4.0) |
| Entrez ID | Symbol | Category | Interaction Types | Drug Claim Name | Drug Name | PMIDs |
| 10000 | AKT3 | DRUGGABLE GENOME, KINASE, ENZYME, DRUG RESISTANCE, SERINE THREONINE KINASE, CLINICALLY ACTIONABLE | inhibitor | 249565578 | IPATASERTIB | |
| 10000 | AKT3 | DRUGGABLE GENOME, KINASE, ENZYME, DRUG RESISTANCE, SERINE THREONINE KINASE, CLINICALLY ACTIONABLE | inhibitor | GSK2126458 | OMIPALISIB | |
| 10000 | AKT3 | DRUGGABLE GENOME, KINASE, ENZYME, DRUG RESISTANCE, SERINE THREONINE KINASE, CLINICALLY ACTIONABLE | inhibitor | 249565585 | UPROSERTIB | |
| 10000 | AKT3 | DRUGGABLE GENOME, KINASE, ENZYME, DRUG RESISTANCE, SERINE THREONINE KINASE, CLINICALLY ACTIONABLE | Afuresertib | AFURESERTIB | ||
| 10000 | AKT3 | DRUGGABLE GENOME, KINASE, ENZYME, DRUG RESISTANCE, SERINE THREONINE KINASE, CLINICALLY ACTIONABLE | MK2206 | MK-2206 | ||
| 10000 | AKT3 | DRUGGABLE GENOME, KINASE, ENZYME, DRUG RESISTANCE, SERINE THREONINE KINASE, CLINICALLY ACTIONABLE | BAY1125976 | |||
| 10000 | AKT3 | DRUGGABLE GENOME, KINASE, ENZYME, DRUG RESISTANCE, SERINE THREONINE KINASE, CLINICALLY ACTIONABLE | GSK2141795 | UPROSERTIB | ||
| 10000 | AKT3 | DRUGGABLE GENOME, KINASE, ENZYME, DRUG RESISTANCE, SERINE THREONINE KINASE, CLINICALLY ACTIONABLE | allosteric modulator | 328083529 | MIRANSERTIB | |
| 10000 | AKT3 | DRUGGABLE GENOME, KINASE, ENZYME, DRUG RESISTANCE, SERINE THREONINE KINASE, CLINICALLY ACTIONABLE | inhibitor | CHEMBL494089 | GSK-690693 | |
| 10000 | AKT3 | DRUGGABLE GENOME, KINASE, ENZYME, DRUG RESISTANCE, SERINE THREONINE KINASE, CLINICALLY ACTIONABLE | PERIFOSINE | PERIFOSINE |
| Page: 1 2 3 4 5 6 |

Copyright 2023-Present -The University of Texas Health Science Center at Houston |