
|
|||||
|
 | |
| |
| |
| |
| |
| |
|
Gene: AKT2 |
Gene summary for AKT2 |
| Gene information | Species | Human | Gene symbol | AKT2 | Gene ID | 208 |
| Gene name | AKT serine/threonine kinase 2 | |
| Gene Alias | HIHGHH | |
| Cytomap | 19q13.2 | |
| Gene Type | protein-coding | GO ID | GO:0000271 | UniProtAcc | B4DG79 |
Top |
Malignant transformation analysis |
| Identification of the aberrant gene expression in precancerous and cancerous lesions by comparing the gene expression of stem-like cells in diseased tissues with normal stem cells |
| Entrez ID | Symbol | Replicates | Species | Organ | Tissue | Adj P-value | Log2FC | Malignancy |
| 208 | AKT2 | HTA11_347_2000001011 | Human | Colorectum | AD | 1.63e-04 | 2.42e-01 | -0.1954 |
| 208 | AKT2 | HTA11_1391_2000001011 | Human | Colorectum | AD | 2.41e-07 | 5.08e-01 | -0.059 |
| 208 | AKT2 | HTA11_7663_2000001011 | Human | Colorectum | SER | 4.53e-03 | 3.82e-01 | 0.0131 |
| 208 | AKT2 | HTA11_7696_3000711011 | Human | Colorectum | AD | 5.11e-13 | 6.14e-01 | 0.0674 |
| 208 | AKT2 | HTA11_99999965104_69814 | Human | Colorectum | MSS | 1.28e-03 | 4.11e-01 | 0.281 |
| 208 | AKT2 | HTA11_99999971662_82457 | Human | Colorectum | MSS | 3.62e-17 | 7.04e-01 | 0.3859 |
| 208 | AKT2 | A015-C-203 | Human | Colorectum | FAP | 3.18e-02 | -9.16e-02 | -0.1294 |
| 208 | AKT2 | A015-C-104 | Human | Colorectum | FAP | 3.58e-02 | -1.94e-02 | -0.1899 |
| 208 | AKT2 | A002-C-016 | Human | Colorectum | FAP | 4.42e-02 | -1.01e-01 | 0.0521 |
| 208 | AKT2 | A002-C-116 | Human | Colorectum | FAP | 6.07e-04 | -1.15e-01 | -0.0452 |
| 208 | AKT2 | LZE4T | Human | Esophagus | ESCC | 2.91e-02 | 6.89e-03 | 0.0811 |
| 208 | AKT2 | LZE5T | Human | Esophagus | ESCC | 3.80e-02 | 1.06e-01 | 0.0514 |
| 208 | AKT2 | LZE7T | Human | Esophagus | ESCC | 1.46e-04 | 2.22e-01 | 0.0667 |
| 208 | AKT2 | LZE8T | Human | Esophagus | ESCC | 7.65e-04 | 1.62e-01 | 0.067 |
| 208 | AKT2 | LZE22T | Human | Esophagus | ESCC | 3.32e-03 | 1.35e-01 | 0.068 |
| 208 | AKT2 | LZE24T | Human | Esophagus | ESCC | 8.07e-16 | 3.56e-01 | 0.0596 |
| 208 | AKT2 | LZE21T | Human | Esophagus | ESCC | 3.26e-08 | 2.21e-01 | 0.0655 |
| 208 | AKT2 | P1T-E | Human | Esophagus | ESCC | 1.55e-06 | 4.97e-01 | 0.0875 |
| 208 | AKT2 | P2T-E | Human | Esophagus | ESCC | 5.00e-29 | 4.34e-01 | 0.1177 |
| 208 | AKT2 | P4T-E | Human | Esophagus | ESCC | 1.08e-11 | 2.47e-01 | 0.1323 |
| Page: 1 2 3 4 5 6 7 |
| Tissue | Expression Dynamics | Abbreviation |
| Colorectum (GSE201348) |  | FAP: Familial adenomatous polyposis |
| CRC: Colorectal cancer | ||
| Colorectum (HTA11) |  | AD: Adenomas |
| SER: Sessile serrated lesions | ||
| MSI-H: Microsatellite-high colorectal cancer | ||
| MSS: Microsatellite stable colorectal cancer | ||
| Esophagus | 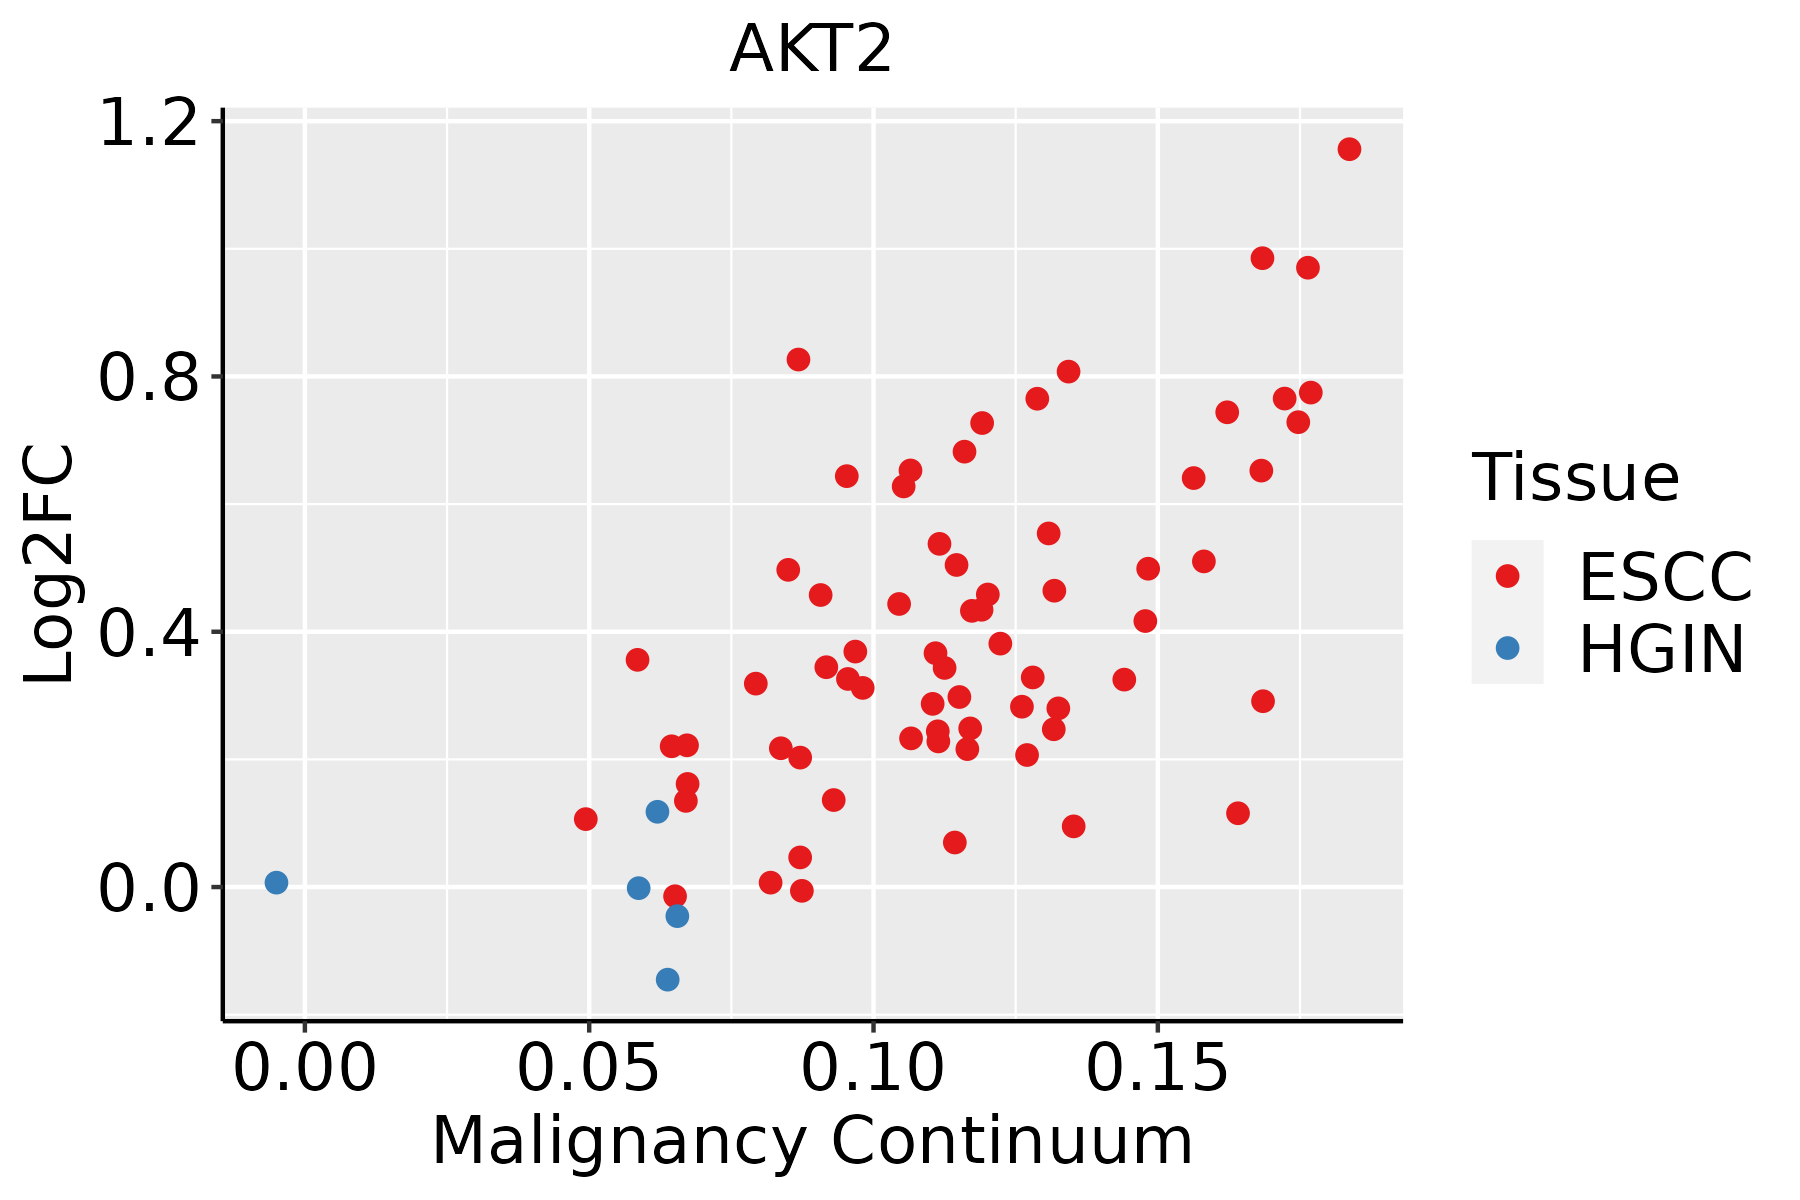 | ESCC: Esophageal squamous cell carcinoma |
| HGIN: High-grade intraepithelial neoplasias | ||
| LGIN: Low-grade intraepithelial neoplasias | ||
| Liver | 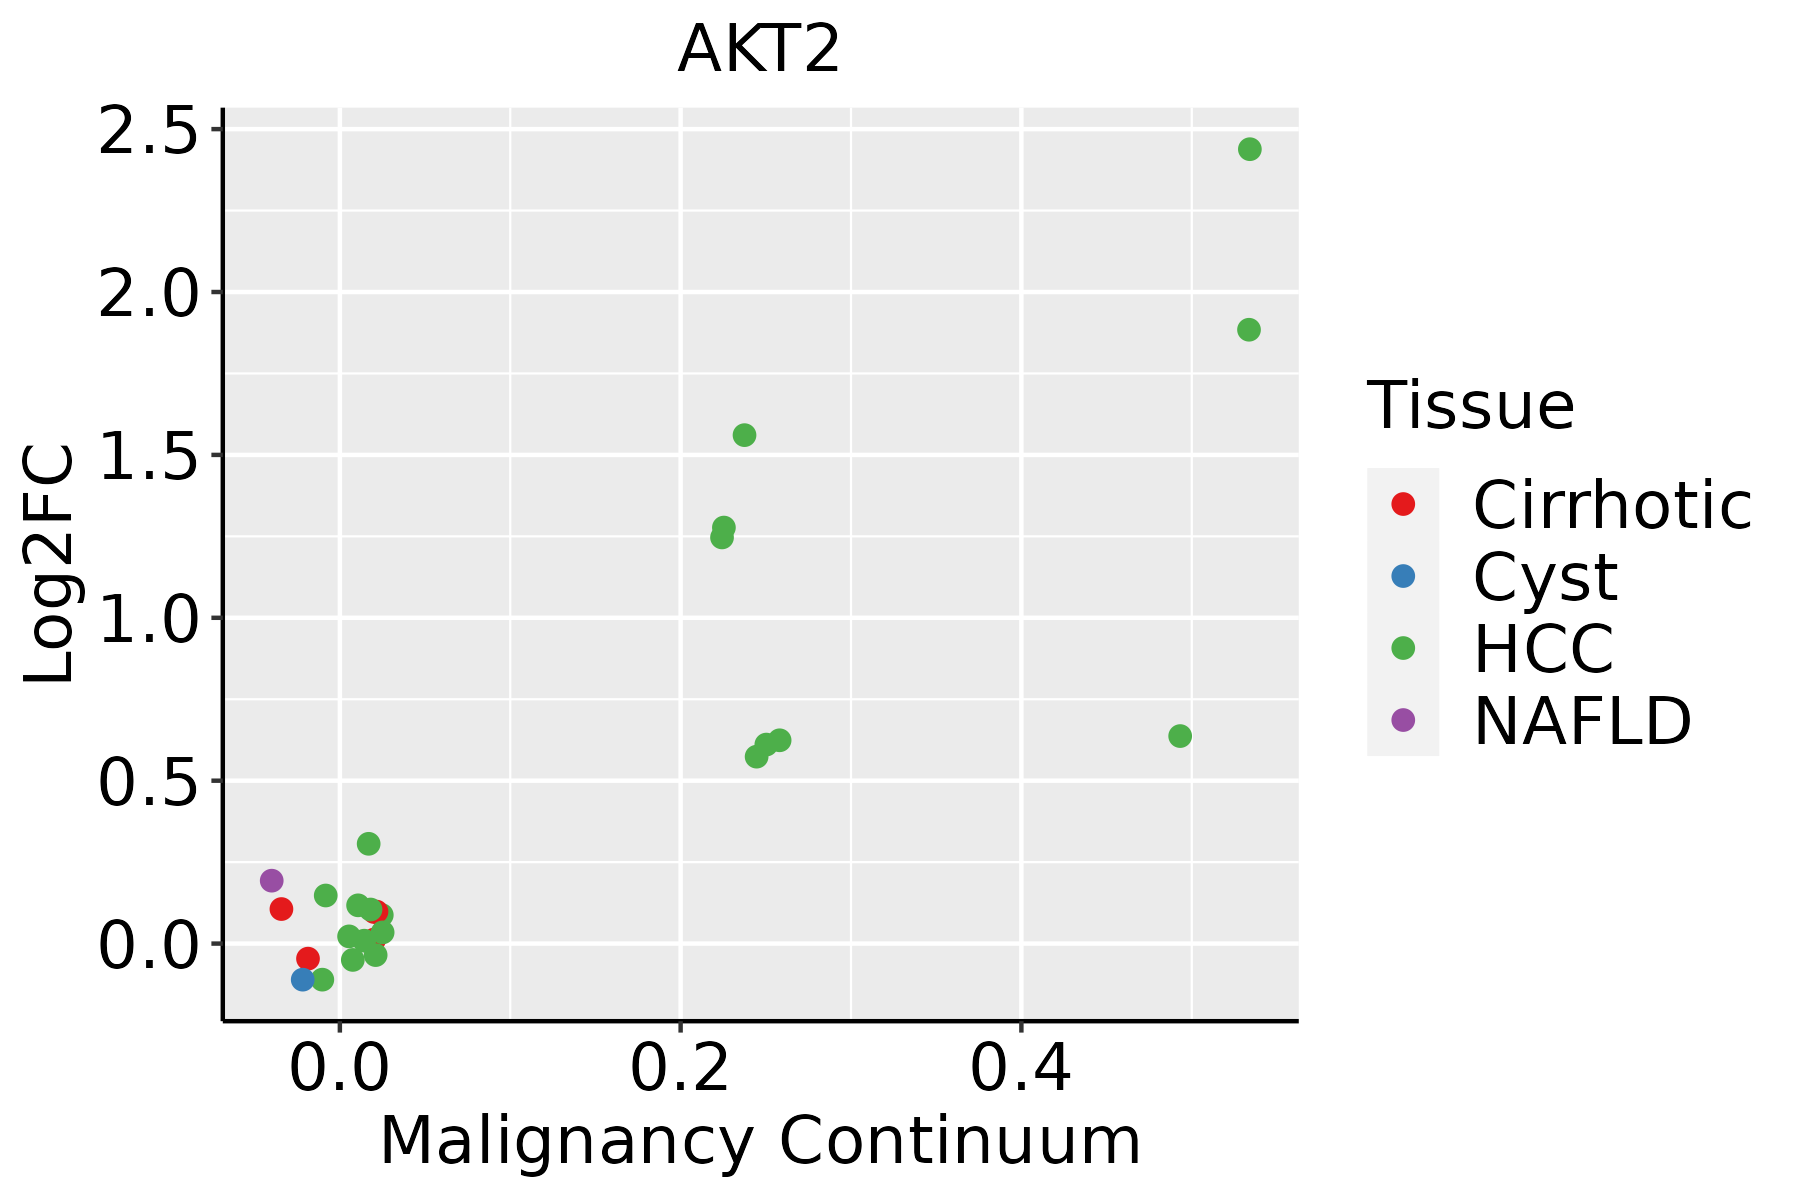 | HCC: Hepatocellular carcinoma |
| NAFLD: Non-alcoholic fatty liver disease | ||
| Oral Cavity | 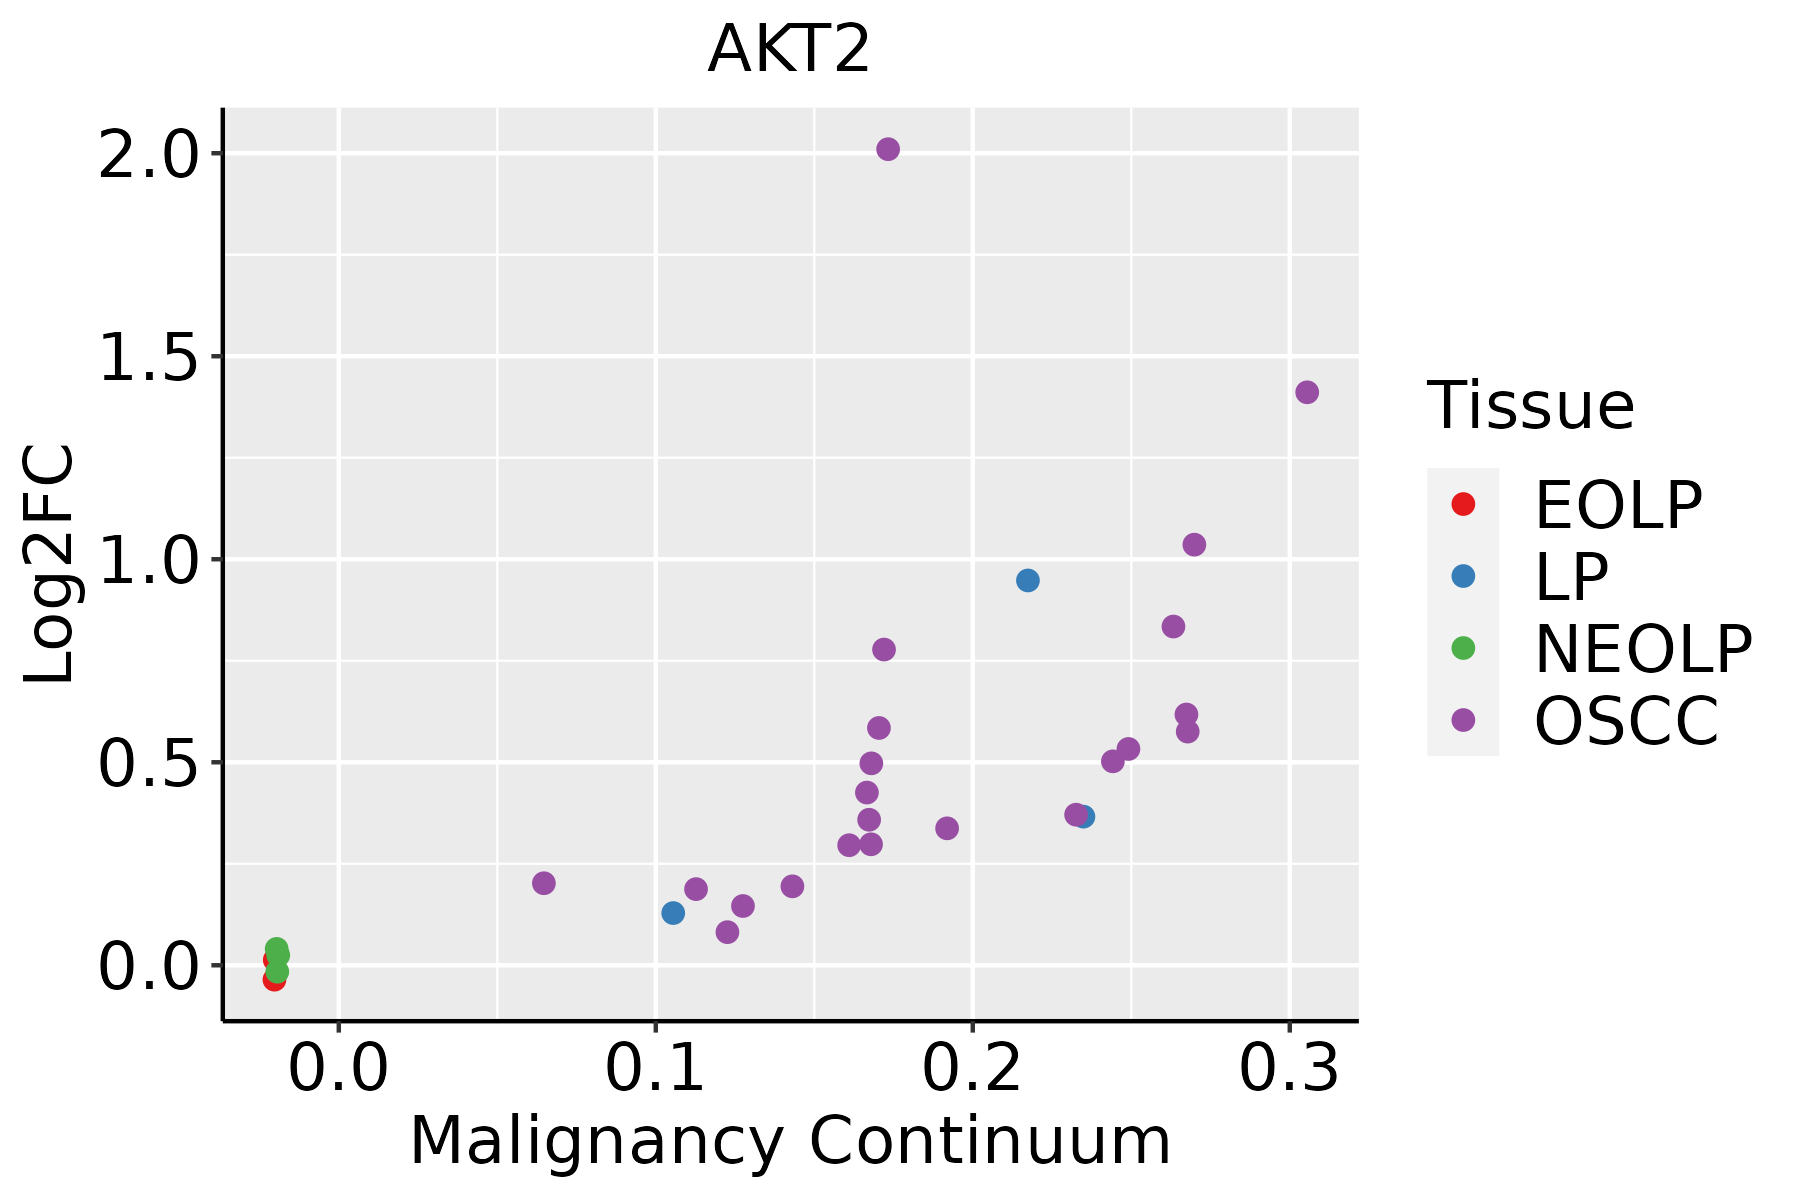 | EOLP: Erosive Oral lichen planus |
| LP: leukoplakia | ||
| NEOLP: Non-erosive oral lichen planus | ||
| OSCC: Oral squamous cell carcinoma | ||
| Skin | 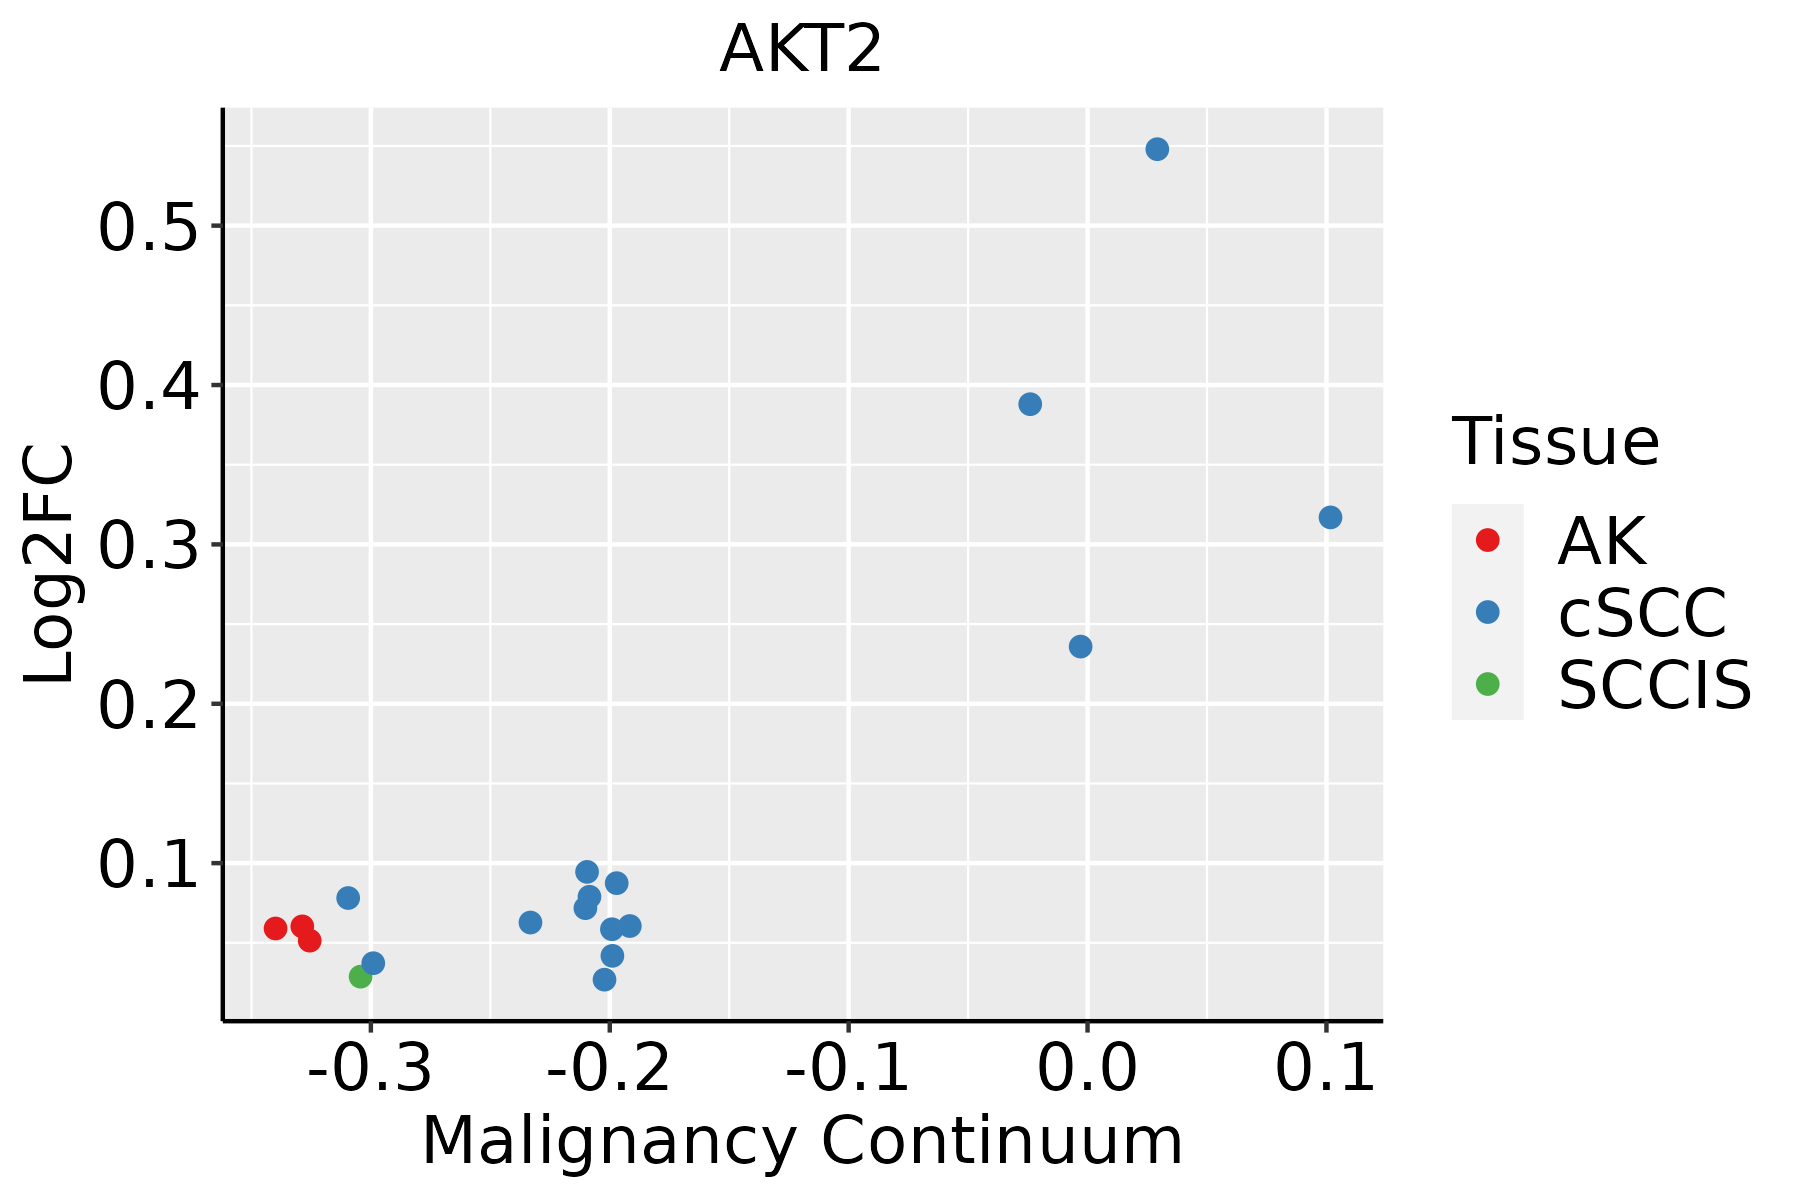 | AK: Actinic keratosis |
| cSCC: Cutaneous squamous cell carcinoma | ||
| SCCIS:squamous cell carcinoma in situ | ||
| Thyroid |  | ATC: Anaplastic thyroid cancer |
| HT: Hashimoto's thyroiditis | ||
| PTC: Papillary thyroid cancer |
| ∗log2FC in expression of this searched gene in stem-like cells from each diseased tissue sample relative to stem-like cells in normal samples in each tissue plotted against the malignancy continuum. Samples are colored based on if they are from different disease stage. |
Top |
Malignant transformation related pathway analysis |
| Find out the enriched GO biological processes and KEGG pathways involved in transition from healthy to precancer to cancer |
| Tissue | Disease Stage | Enriched GO biological Processes |
| Colorectum | AD |  |
| Colorectum | SER |  |
| Colorectum | MSS |  |
| Colorectum | MSI-H |  |
| Colorectum | FAP |  |
| ∗Top 15 enriched GO BP terms are showed in the bar plot of each disease state in each tissue. Each row represents a significant GO biological process which is colored according to the -log10(p.adjust). |
| Page: 1 2 3 4 5 6 7 8 9 |
| GO ID | Tissue | Disease Stage | Description | Gene Ratio | Bg Ratio | pvalue | p.adjust | Count |
| GO:0006091 | Colorectum | AD | generation of precursor metabolites and energy | 209/3918 | 490/18723 | 3.17e-28 | 6.61e-25 | 209 |
| GO:0015980 | Colorectum | AD | energy derivation by oxidation of organic compounds | 143/3918 | 318/18723 | 2.78e-22 | 2.49e-19 | 143 |
| GO:0072659 | Colorectum | AD | protein localization to plasma membrane | 122/3918 | 284/18723 | 2.86e-17 | 1.49e-14 | 122 |
| GO:0009896 | Colorectum | AD | positive regulation of catabolic process | 180/3918 | 492/18723 | 4.33e-16 | 1.94e-13 | 180 |
| GO:0031331 | Colorectum | AD | positive regulation of cellular catabolic process | 156/3918 | 427/18723 | 4.68e-14 | 1.05e-11 | 156 |
| GO:1990778 | Colorectum | AD | protein localization to cell periphery | 129/3918 | 333/18723 | 5.51e-14 | 1.15e-11 | 129 |
| GO:1903829 | Colorectum | AD | positive regulation of cellular protein localization | 110/3918 | 276/18723 | 4.58e-13 | 8.44e-11 | 110 |
| GO:0090150 | Colorectum | AD | establishment of protein localization to membrane | 100/3918 | 260/18723 | 6.01e-11 | 6.33e-09 | 100 |
| GO:0048732 | Colorectum | AD | gland development | 149/3918 | 436/18723 | 6.07e-11 | 6.33e-09 | 149 |
| GO:1905475 | Colorectum | AD | regulation of protein localization to membrane | 73/3918 | 175/18723 | 3.37e-10 | 2.93e-08 | 73 |
| GO:1904951 | Colorectum | AD | positive regulation of establishment of protein localization | 112/3918 | 319/18723 | 2.55e-09 | 1.80e-07 | 112 |
| GO:0051222 | Colorectum | AD | positive regulation of protein transport | 106/3918 | 303/18723 | 8.45e-09 | 5.08e-07 | 106 |
| GO:0006605 | Colorectum | AD | protein targeting | 105/3918 | 314/18723 | 1.39e-07 | 6.44e-06 | 105 |
| GO:1905477 | Colorectum | AD | positive regulation of protein localization to membrane | 46/3918 | 106/18723 | 1.47e-07 | 6.64e-06 | 46 |
| GO:0016050 | Colorectum | AD | vesicle organization | 101/3918 | 300/18723 | 1.65e-07 | 7.17e-06 | 101 |
| GO:0090316 | Colorectum | AD | positive regulation of intracellular protein transport | 62/3918 | 160/18723 | 1.82e-07 | 7.79e-06 | 62 |
| GO:0032388 | Colorectum | AD | positive regulation of intracellular transport | 74/3918 | 202/18723 | 1.83e-07 | 7.80e-06 | 74 |
| GO:0032868 | Colorectum | AD | response to insulin | 91/3918 | 264/18723 | 2.02e-07 | 8.48e-06 | 91 |
| GO:0032386 | Colorectum | AD | regulation of intracellular transport | 109/3918 | 337/18723 | 5.33e-07 | 1.95e-05 | 109 |
| GO:0033157 | Colorectum | AD | regulation of intracellular protein transport | 80/3918 | 229/18723 | 5.81e-07 | 2.09e-05 | 80 |
| Page: 1 2 3 4 5 6 7 8 9 10 11 12 13 14 15 16 17 18 19 20 21 22 23 24 25 26 27 28 29 30 31 32 33 34 35 |
| Pathway ID | Tissue | Disease Stage | Description | Gene Ratio | Bg Ratio | pvalue | p.adjust | qvalue | Count |
| hsa05208 | Colorectum | AD | Chemical carcinogenesis - reactive oxygen species | 126/2092 | 223/8465 | 1.01e-24 | 1.68e-22 | 1.07e-22 | 126 |
| hsa05415 | Colorectum | AD | Diabetic cardiomyopathy | 114/2092 | 203/8465 | 3.65e-22 | 3.06e-20 | 1.95e-20 | 114 |
| hsa05010 | Colorectum | AD | Alzheimer disease | 174/2092 | 384/8465 | 1.82e-19 | 9.26e-18 | 5.91e-18 | 174 |
| hsa04932 | Colorectum | AD | Non-alcoholic fatty liver disease | 90/2092 | 155/8465 | 4.83e-19 | 1.80e-17 | 1.15e-17 | 90 |
| hsa05131 | Colorectum | AD | Shigellosis | 109/2092 | 247/8465 | 1.09e-11 | 2.44e-10 | 1.55e-10 | 109 |
| hsa05132 | Colorectum | AD | Salmonella infection | 102/2092 | 249/8465 | 7.65e-09 | 1.28e-07 | 8.17e-08 | 102 |
| hsa04666 | Colorectum | AD | Fc gamma R-mediated phagocytosis | 46/2092 | 97/8465 | 9.10e-07 | 1.22e-05 | 7.77e-06 | 46 |
| hsa05017 | Colorectum | AD | Spinocerebellar ataxia | 60/2092 | 143/8465 | 3.78e-06 | 4.35e-05 | 2.78e-05 | 60 |
| hsa05135 | Colorectum | AD | Yersinia infection | 58/2092 | 137/8465 | 3.90e-06 | 4.35e-05 | 2.78e-05 | 58 |
| hsa04066 | Colorectum | AD | HIF-1 signaling pathway | 48/2092 | 109/8465 | 7.25e-06 | 7.84e-05 | 5.00e-05 | 48 |
| hsa04919 | Colorectum | AD | Thyroid hormone signaling pathway | 51/2092 | 121/8465 | 1.71e-05 | 1.73e-04 | 1.10e-04 | 51 |
| hsa04722 | Colorectum | AD | Neurotrophin signaling pathway | 50/2092 | 119/8465 | 2.28e-05 | 2.24e-04 | 1.43e-04 | 50 |
| hsa05213 | Colorectum | AD | Endometrial cancer | 29/2092 | 58/8465 | 2.69e-05 | 2.57e-04 | 1.64e-04 | 29 |
| hsa05230 | Colorectum | AD | Central carbon metabolism in cancer | 33/2092 | 70/8465 | 3.61e-05 | 3.19e-04 | 2.03e-04 | 33 |
| hsa05418 | Colorectum | AD | Fluid shear stress and atherosclerosis | 54/2092 | 139/8465 | 1.41e-04 | 1.16e-03 | 7.37e-04 | 54 |
| hsa04152 | Colorectum | AD | AMPK signaling pathway | 47/2092 | 121/8465 | 3.74e-04 | 2.82e-03 | 1.80e-03 | 47 |
| hsa05210 | Colorectum | AD | Colorectal cancer | 35/2092 | 86/8465 | 7.54e-04 | 5.49e-03 | 3.50e-03 | 35 |
| hsa04213 | Colorectum | AD | Longevity regulating pathway - multiple species | 27/2092 | 62/8465 | 8.72e-04 | 5.96e-03 | 3.80e-03 | 27 |
| hsa04922 | Colorectum | AD | Glucagon signaling pathway | 41/2092 | 107/8465 | 1.18e-03 | 7.75e-03 | 4.94e-03 | 41 |
| hsa05417 | Colorectum | AD | Lipid and atherosclerosis | 73/2092 | 215/8465 | 1.31e-03 | 8.27e-03 | 5.27e-03 | 73 |
| Page: 1 2 3 4 5 6 7 8 9 10 11 12 13 14 15 16 17 18 19 20 21 22 23 24 25 26 27 28 29 30 31 32 33 34 35 36 |
Top |
Cell-cell communication analysis |
| Identification of potential cell-cell interactions between two cell types and their ligand-receptor pairs for different disease states |
| Ligand | Receptor | LRpair | Pathway | Tissue | Disease Stage |
| Page: 1 |
Top |
Single-cell gene regulatory network inference analysis |
| Find out the significant the regulons (TFs) and the target genes of each regulon across cell types for different disease states |
| TF | Cell Type | Tissue | Disease Stage | Target Gene | RSS | Regulon Activity |
| ∗The dot plots of a searched regulon are shown for all cell subpopulations in each disease state of each tissue based on the regulon specific score inferred using pySCENIC and by calculating the average expression. |
| Page: 1 |
Top |
Somatic mutation of malignant transformation related genes |
| Annotation of somatic variants for genes involved in malignant transformation |
| Hugo Symbol | Variant Class | Variant Classification | dbSNP RS | HGVSc | HGVSp | HGVSp Short | SWISSPROT | BIOTYPE | SIFT | PolyPhen | Tumor Sample Barcode | Tissue | Histology | Sex | Age | Stage | Therapy Types | Drugs | Outcome |
| AKT2 | SNV | Missense_Mutation | c.867N>G | p.Ile289Met | p.I289M | P31751 | protein_coding | deleterious(0) | possibly_damaging(0.896) | TCGA-A1-A0SI-01 | Breast | breast invasive carcinoma | Female | <65 | I/II | Unknown | Unknown | SD | |
| AKT2 | SNV | Missense_Mutation | c.1066N>A | p.Glu356Lys | p.E356K | P31751 | protein_coding | deleterious(0.02) | probably_damaging(0.934) | TCGA-C8-A1HM-01 | Breast | breast invasive carcinoma | Female | >=65 | I/II | Chemotherapy | doxorubicin | CR | |
| AKT2 | SNV | Missense_Mutation | novel | c.976N>A | p.Asp326Asn | p.D326N | P31751 | protein_coding | deleterious(0.04) | possibly_damaging(0.831) | TCGA-2W-A8YY-01 | Cervix | cervical & endocervical cancer | Female | <65 | I/II | Chemotherapy | cisplatin | CR |
| AKT2 | SNV | Missense_Mutation | novel | c.133N>G | p.Pro45Ala | p.P45A | P31751 | protein_coding | tolerated(0.77) | benign(0) | TCGA-EX-A3L1-01 | Cervix | cervical & endocervical cancer | Female | <65 | I/II | Chemotherapy | cisplatin | CR |
| AKT2 | SNV | Missense_Mutation | novel | c.90G>C | p.Lys30Asn | p.K30N | P31751 | protein_coding | tolerated(0.22) | benign(0.111) | TCGA-JW-A5VJ-01 | Cervix | cervical & endocervical cancer | Female | <65 | I/II | Unknown | Unknown | PD |
| AKT2 | SNV | Missense_Mutation | c.1278N>G | p.Phe426Leu | p.F426L | P31751 | protein_coding | deleterious(0.01) | probably_damaging(0.94) | TCGA-LP-A4AV-01 | Cervix | cervical & endocervical cancer | Female | <65 | I/II | Unknown | Unknown | SD | |
| AKT2 | SNV | Missense_Mutation | novel | c.401N>G | p.Glu134Gly | p.E134G | P31751 | protein_coding | tolerated(0.08) | benign(0.003) | TCGA-A6-6780-01 | Colorectum | colon adenocarcinoma | Male | >=65 | I/II | Unknown | Unknown | SD |
| AKT2 | SNV | Missense_Mutation | novel | c.1021T>C | p.Tyr341His | p.Y341H | P31751 | protein_coding | deleterious(0.03) | probably_damaging(0.976) | TCGA-AA-3984-01 | Colorectum | colon adenocarcinoma | Female | <65 | I/II | Unknown | Unknown | SD |
| AKT2 | SNV | Missense_Mutation | c.1189N>T | p.Pro397Ser | p.P397S | P31751 | protein_coding | tolerated(0.16) | benign(0.035) | TCGA-AA-A01R-01 | Colorectum | colon adenocarcinoma | Male | <65 | III/IV | Chemotherapy | 5-fluorouracil | PD | |
| AKT2 | SNV | Missense_Mutation | rs757245351 | c.803C>T | p.Ser268Leu | p.S268L | P31751 | protein_coding | tolerated(0.07) | benign(0.082) | TCGA-AZ-4615-01 | Colorectum | colon adenocarcinoma | Male | >=65 | III/IV | Chemotherapy | xeloda | PD |
| Page: 1 2 3 4 5 6 7 |
Top |
Related drugs of malignant transformation related genes |
| Identification of chemicals and drugs interact with genes involved in malignant transfromation |
| (DGIdb 4.0) |
| Entrez ID | Symbol | Category | Interaction Types | Drug Claim Name | Drug Name | PMIDs |
| 208 | AKT2 | CLINICALLY ACTIONABLE, ENZYME, DRUGGABLE GENOME, TRANSPORTER, TRANSCRIPTION FACTOR, KINASE, SERINE THREONINE KINASE, TUMOR SUPPRESSOR | inhibitor | CHEMBL2177390 | IPATASERTIB | |
| 208 | AKT2 | CLINICALLY ACTIONABLE, ENZYME, DRUGGABLE GENOME, TRANSPORTER, TRANSCRIPTION FACTOR, KINASE, SERINE THREONINE KINASE, TUMOR SUPPRESSOR | GDC-0068 | IPATASERTIB | ||
| 208 | AKT2 | CLINICALLY ACTIONABLE, ENZYME, DRUGGABLE GENOME, TRANSPORTER, TRANSCRIPTION FACTOR, KINASE, SERINE THREONINE KINASE, TUMOR SUPPRESSOR | allosteric modulator | 405560349 | ||
| 208 | AKT2 | CLINICALLY ACTIONABLE, ENZYME, DRUGGABLE GENOME, TRANSPORTER, TRANSCRIPTION FACTOR, KINASE, SERINE THREONINE KINASE, TUMOR SUPPRESSOR | TRICIRIBINE | TRICIRIBINE | ||
| 208 | AKT2 | CLINICALLY ACTIONABLE, ENZYME, DRUGGABLE GENOME, TRANSPORTER, TRANSCRIPTION FACTOR, KINASE, SERINE THREONINE KINASE, TUMOR SUPPRESSOR | inhibitor | 223366042 | CAPIVASERTIB | |
| 208 | AKT2 | CLINICALLY ACTIONABLE, ENZYME, DRUGGABLE GENOME, TRANSPORTER, TRANSCRIPTION FACTOR, KINASE, SERINE THREONINE KINASE, TUMOR SUPPRESSOR | inhibitor | CHEMBL3545134 | LY-2780301 | |
| 208 | AKT2 | CLINICALLY ACTIONABLE, ENZYME, DRUGGABLE GENOME, TRANSPORTER, TRANSCRIPTION FACTOR, KINASE, SERINE THREONINE KINASE, TUMOR SUPPRESSOR | inhibitor | 249565578 | IPATASERTIB | |
| 208 | AKT2 | CLINICALLY ACTIONABLE, ENZYME, DRUGGABLE GENOME, TRANSPORTER, TRANSCRIPTION FACTOR, KINASE, SERINE THREONINE KINASE, TUMOR SUPPRESSOR | AFURESERTIB HYDROCHLORIDE | |||
| 208 | AKT2 | CLINICALLY ACTIONABLE, ENZYME, DRUGGABLE GENOME, TRANSPORTER, TRANSCRIPTION FACTOR, KINASE, SERINE THREONINE KINASE, TUMOR SUPPRESSOR | allosteric modulator | 249565628 | MK-2206 | |
| 208 | AKT2 | CLINICALLY ACTIONABLE, ENZYME, DRUGGABLE GENOME, TRANSPORTER, TRANSCRIPTION FACTOR, KINASE, SERINE THREONINE KINASE, TUMOR SUPPRESSOR | inhibitor | MK2206 | MK-2206 |
| Page: 1 2 3 4 5 |

Copyright 2023-Present -The University of Texas Health Science Center at Houston |