
|
|||||
|
 | |
| |
| |
| |
| |
| |
|
Gene: AKR7A3 |
Gene summary for AKR7A3 |
| Gene information | Species | Human | Gene symbol | AKR7A3 | Gene ID | 22977 |
| Gene name | aldo-keto reductase family 7 member A3 | |
| Gene Alias | AFAR2 | |
| Cytomap | 1p36.13 | |
| Gene Type | protein-coding | GO ID | GO:0006081 | UniProtAcc | O95154 |
Top |
Malignant transformation analysis |
| Identification of the aberrant gene expression in precancerous and cancerous lesions by comparing the gene expression of stem-like cells in diseased tissues with normal stem cells |
| Entrez ID | Symbol | Replicates | Species | Organ | Tissue | Adj P-value | Log2FC | Malignancy |
| 22977 | AKR7A3 | GSM4909291 | Human | Breast | IDC | 2.87e-05 | 3.39e-01 | 0.1753 |
| 22977 | AKR7A3 | GSM4909297 | Human | Breast | IDC | 7.30e-11 | 5.58e-01 | 0.1517 |
| 22977 | AKR7A3 | GSM4909304 | Human | Breast | IDC | 4.30e-37 | 7.42e-01 | 0.1636 |
| 22977 | AKR7A3 | GSM4909306 | Human | Breast | IDC | 7.92e-11 | 4.09e-01 | 0.1564 |
| 22977 | AKR7A3 | GSM4909319 | Human | Breast | IDC | 1.44e-03 | 1.69e-01 | 0.1563 |
| 22977 | AKR7A3 | NCCBC2 | Human | Breast | DCIS | 3.60e-09 | 8.36e-01 | 0.1554 |
| 22977 | AKR7A3 | NCCBC5 | Human | Breast | DCIS | 3.78e-03 | 3.13e-01 | 0.2046 |
| 22977 | AKR7A3 | HTA11_3410_2000001011 | Human | Colorectum | AD | 1.16e-04 | 1.84e-01 | 0.0155 |
| 22977 | AKR7A3 | HTA11_2487_2000001011 | Human | Colorectum | SER | 1.26e-22 | 7.15e-01 | -0.1808 |
| 22977 | AKR7A3 | HTA11_1938_2000001011 | Human | Colorectum | AD | 5.18e-07 | 5.01e-01 | -0.0811 |
| 22977 | AKR7A3 | HTA11_78_2000001011 | Human | Colorectum | AD | 2.26e-07 | 2.95e-01 | -0.1088 |
| 22977 | AKR7A3 | HTA11_347_2000001011 | Human | Colorectum | AD | 3.14e-25 | 5.82e-01 | -0.1954 |
| 22977 | AKR7A3 | HTA11_411_2000001011 | Human | Colorectum | SER | 2.76e-04 | 7.57e-01 | -0.2602 |
| 22977 | AKR7A3 | HTA11_2112_2000001011 | Human | Colorectum | SER | 3.36e-06 | 7.53e-01 | -0.2196 |
| 22977 | AKR7A3 | HTA11_3361_2000001011 | Human | Colorectum | AD | 7.69e-06 | 3.26e-01 | -0.1207 |
| 22977 | AKR7A3 | HTA11_83_2000001011 | Human | Colorectum | SER | 8.57e-22 | 8.42e-01 | -0.1526 |
| 22977 | AKR7A3 | HTA11_696_2000001011 | Human | Colorectum | AD | 4.42e-27 | 6.31e-01 | -0.1464 |
| 22977 | AKR7A3 | HTA11_866_2000001011 | Human | Colorectum | AD | 4.31e-08 | 2.65e-01 | -0.1001 |
| 22977 | AKR7A3 | HTA11_1391_2000001011 | Human | Colorectum | AD | 8.24e-29 | 8.60e-01 | -0.059 |
| 22977 | AKR7A3 | HTA11_2992_2000001011 | Human | Colorectum | SER | 8.80e-11 | 7.22e-01 | -0.1706 |
| Page: 1 2 3 4 |
| Tissue | Expression Dynamics | Abbreviation |
| Breast | 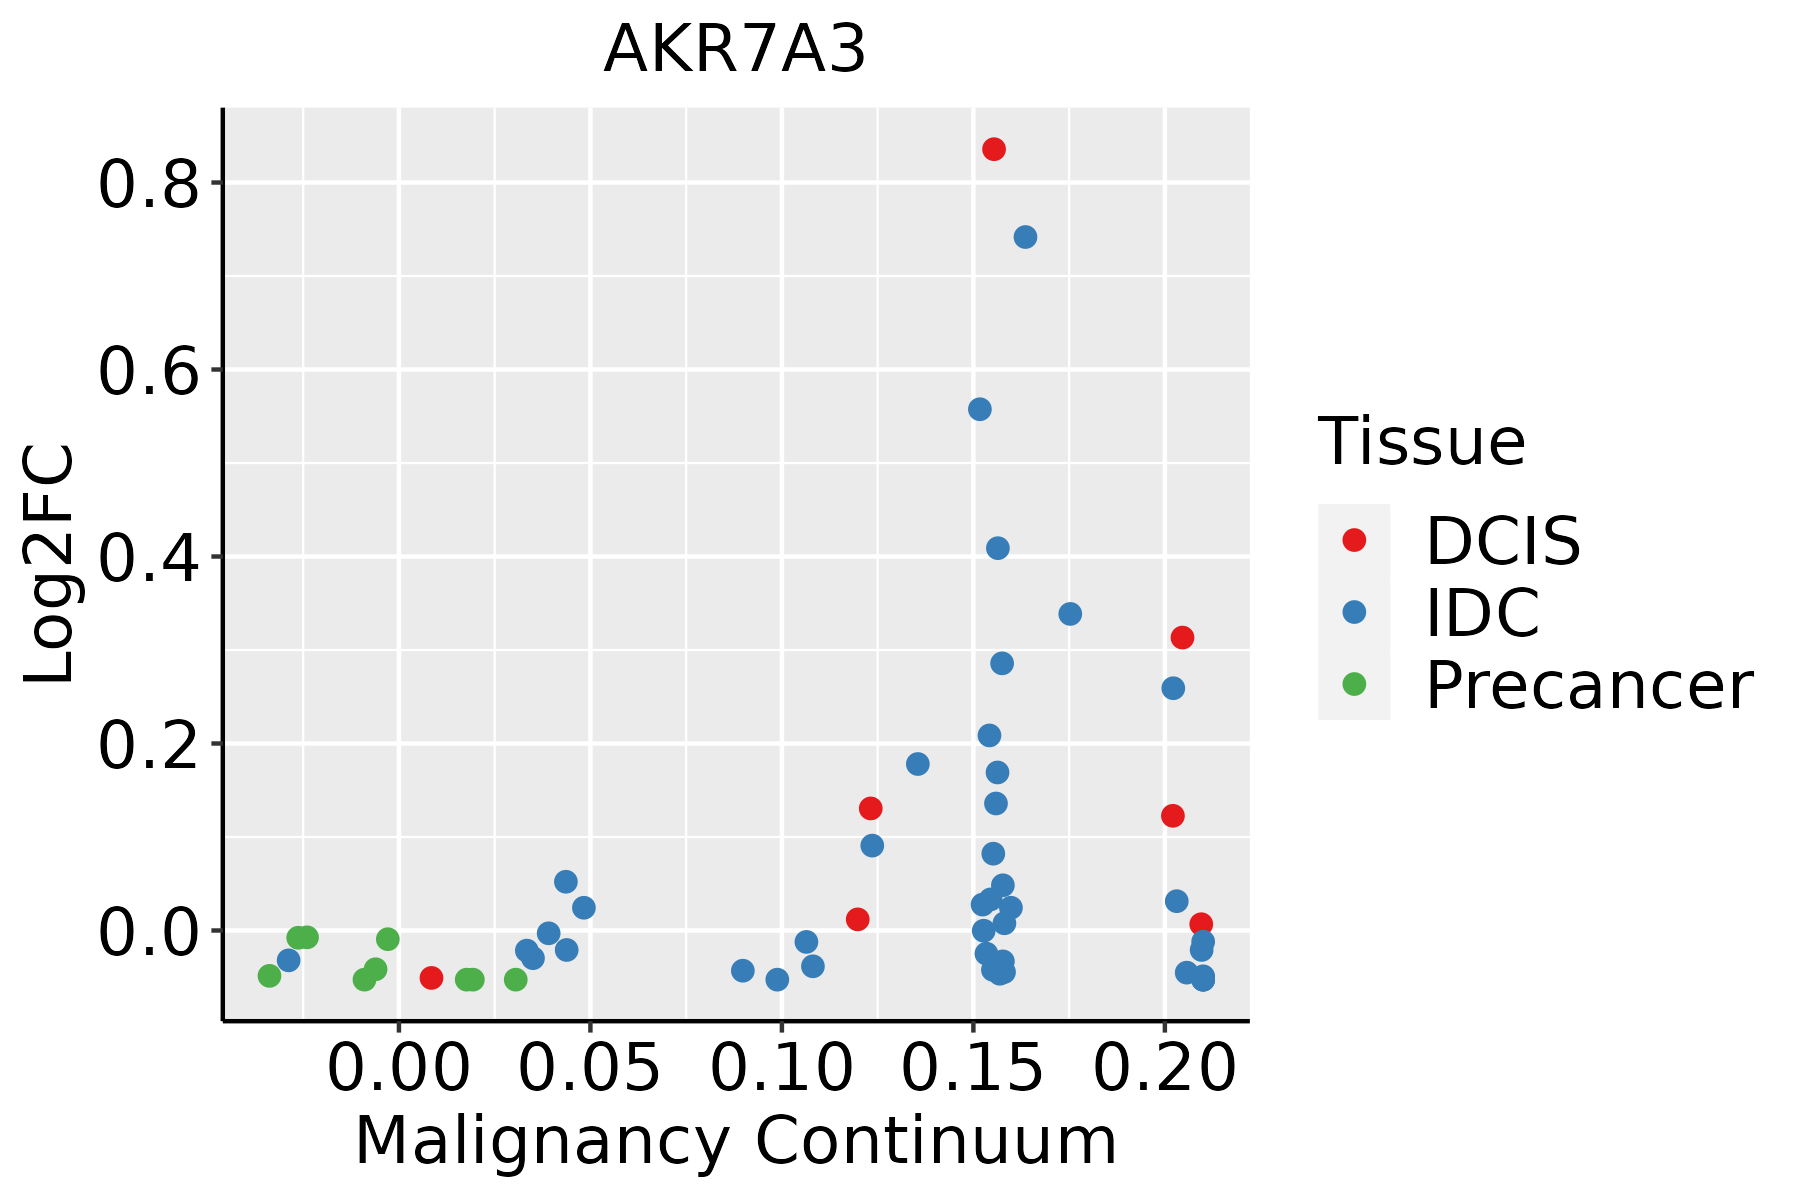 | IDC: Invasive ductal carcinoma |
| DCIS: Ductal carcinoma in situ | ||
| Precancer(BRCA1-mut): Precancerous lesion from BRCA1 mutation carriers | ||
| Colorectum (GSE201348) |  | FAP: Familial adenomatous polyposis |
| CRC: Colorectal cancer | ||
| Colorectum (HTA11) |  | AD: Adenomas |
| SER: Sessile serrated lesions | ||
| MSI-H: Microsatellite-high colorectal cancer | ||
| MSS: Microsatellite stable colorectal cancer | ||
| Esophagus |  | ESCC: Esophageal squamous cell carcinoma |
| HGIN: High-grade intraepithelial neoplasias | ||
| LGIN: Low-grade intraepithelial neoplasias | ||
| GC | 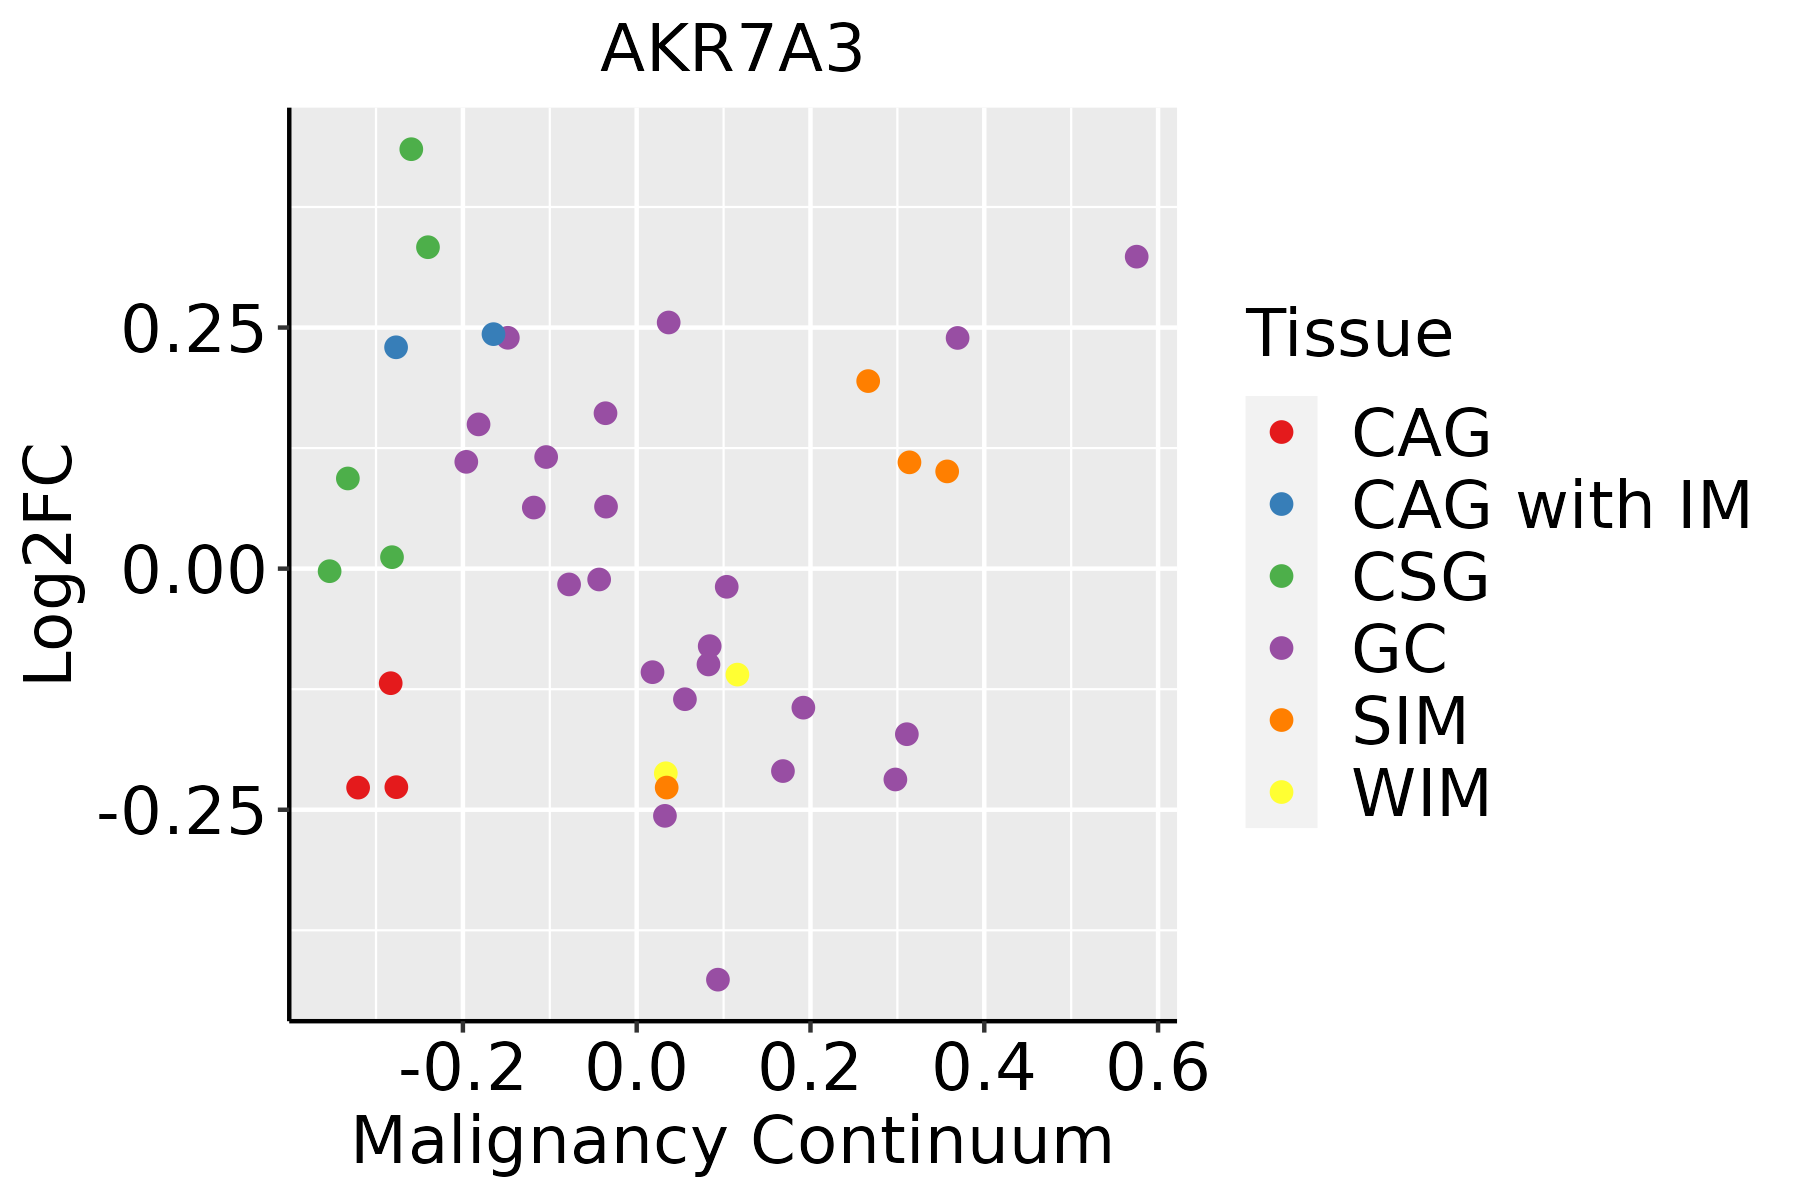 | CAG: Chronic atrophic gastritis |
| CAG with IM: Chronic atrophic gastritis with intestinal metaplasia | ||
| CSG: Chronic superficial gastritis | ||
| GC: Gastric cancer | ||
| SIM: Severe intestinal metaplasia | ||
| WIM: Wild intestinal metaplasia | ||
| Liver |  | HCC: Hepatocellular carcinoma |
| NAFLD: Non-alcoholic fatty liver disease |
| ∗log2FC in expression of this searched gene in stem-like cells from each diseased tissue sample relative to stem-like cells in normal samples in each tissue plotted against the malignancy continuum. Samples are colored based on if they are from different disease stage. |
Top |
Malignant transformation related pathway analysis |
| Find out the enriched GO biological processes and KEGG pathways involved in transition from healthy to precancer to cancer |
| Tissue | Disease Stage | Enriched GO biological Processes |
| Colorectum | AD |  |
| Colorectum | SER |  |
| Colorectum | MSS |  |
| Colorectum | MSI-H |  |
| Colorectum | FAP |  |
| ∗Top 15 enriched GO BP terms are showed in the bar plot of each disease state in each tissue. Each row represents a significant GO biological process which is colored according to the -log10(p.adjust). |
| Page: 1 2 3 4 5 6 7 8 9 |
| GO ID | Tissue | Disease Stage | Description | Gene Ratio | Bg Ratio | pvalue | p.adjust | Count |
| GO:000609113 | Breast | IDC | generation of precursor metabolites and energy | 103/1434 | 490/18723 | 1.53e-21 | 1.74e-18 | 103 |
| GO:002290013 | Breast | IDC | electron transport chain | 51/1434 | 175/18723 | 2.23e-17 | 8.43e-15 | 51 |
| GO:000963613 | Breast | IDC | response to toxic substance | 44/1434 | 262/18723 | 6.33e-07 | 3.00e-05 | 44 |
| GO:009875413 | Breast | IDC | detoxification | 29/1434 | 152/18723 | 3.97e-06 | 1.43e-04 | 29 |
| GO:190136112 | Breast | IDC | organic cyclic compound catabolic process | 56/1434 | 495/18723 | 2.12e-03 | 1.99e-02 | 56 |
| GO:004670012 | Breast | IDC | heterocycle catabolic process | 51/1434 | 445/18723 | 2.51e-03 | 2.25e-02 | 51 |
| GO:000609123 | Breast | DCIS | generation of precursor metabolites and energy | 103/1390 | 490/18723 | 1.46e-22 | 1.65e-19 | 103 |
| GO:002290023 | Breast | DCIS | electron transport chain | 51/1390 | 175/18723 | 6.01e-18 | 2.62e-15 | 51 |
| GO:000963623 | Breast | DCIS | response to toxic substance | 42/1390 | 262/18723 | 1.76e-06 | 6.56e-05 | 42 |
| GO:009875423 | Breast | DCIS | detoxification | 29/1390 | 152/18723 | 2.15e-06 | 7.79e-05 | 29 |
| GO:190136122 | Breast | DCIS | organic cyclic compound catabolic process | 55/1390 | 495/18723 | 1.75e-03 | 1.71e-02 | 55 |
| GO:004670022 | Breast | DCIS | heterocycle catabolic process | 50/1390 | 445/18723 | 2.19e-03 | 2.03e-02 | 50 |
| GO:0006091 | Colorectum | AD | generation of precursor metabolites and energy | 209/3918 | 490/18723 | 3.17e-28 | 6.61e-25 | 209 |
| GO:0022900 | Colorectum | AD | electron transport chain | 89/3918 | 175/18723 | 1.42e-18 | 8.91e-16 | 89 |
| GO:0046700 | Colorectum | AD | heterocycle catabolic process | 145/3918 | 445/18723 | 4.37e-09 | 2.84e-07 | 145 |
| GO:1901361 | Colorectum | AD | organic cyclic compound catabolic process | 153/3918 | 495/18723 | 8.23e-08 | 4.18e-06 | 153 |
| GO:0009636 | Colorectum | AD | response to toxic substance | 88/3918 | 262/18723 | 1.12e-06 | 3.72e-05 | 88 |
| GO:0098754 | Colorectum | AD | detoxification | 53/3918 | 152/18723 | 4.63e-05 | 7.98e-04 | 53 |
| GO:0006081 | Colorectum | AD | cellular aldehyde metabolic process | 22/3918 | 60/18723 | 3.64e-03 | 2.60e-02 | 22 |
| GO:00060911 | Colorectum | SER | generation of precursor metabolites and energy | 168/2897 | 490/18723 | 1.39e-25 | 1.70e-22 | 168 |
| Page: 1 2 3 4 |
| Pathway ID | Tissue | Disease Stage | Description | Gene Ratio | Bg Ratio | pvalue | p.adjust | qvalue | Count |
| hsa00980 | Stomach | GC | Metabolism of xenobiotics by cytochrome P450 | 15/708 | 78/8465 | 1.77e-03 | 1.16e-02 | 8.15e-03 | 15 |
| hsa009801 | Stomach | GC | Metabolism of xenobiotics by cytochrome P450 | 15/708 | 78/8465 | 1.77e-03 | 1.16e-02 | 8.15e-03 | 15 |
| hsa009802 | Stomach | SIM | Metabolism of xenobiotics by cytochrome P450 | 11/465 | 78/8465 | 3.37e-03 | 2.18e-02 | 1.75e-02 | 11 |
| hsa009803 | Stomach | SIM | Metabolism of xenobiotics by cytochrome P450 | 11/465 | 78/8465 | 3.37e-03 | 2.18e-02 | 1.75e-02 | 11 |
| Page: 1 |
Top |
Cell-cell communication analysis |
| Identification of potential cell-cell interactions between two cell types and their ligand-receptor pairs for different disease states |
| Ligand | Receptor | LRpair | Pathway | Tissue | Disease Stage |
| Page: 1 |
Top |
Single-cell gene regulatory network inference analysis |
| Find out the significant the regulons (TFs) and the target genes of each regulon across cell types for different disease states |
| TF | Cell Type | Tissue | Disease Stage | Target Gene | RSS | Regulon Activity |
| ∗The dot plots of a searched regulon are shown for all cell subpopulations in each disease state of each tissue based on the regulon specific score inferred using pySCENIC and by calculating the average expression. |
| Page: 1 |
Top |
Somatic mutation of malignant transformation related genes |
| Annotation of somatic variants for genes involved in malignant transformation |
| Hugo Symbol | Variant Class | Variant Classification | dbSNP RS | HGVSc | HGVSp | HGVSp Short | SWISSPROT | BIOTYPE | SIFT | PolyPhen | Tumor Sample Barcode | Tissue | Histology | Sex | Age | Stage | Therapy Types | Drugs | Outcome |
| AKR7A3 | SNV | Missense_Mutation | c.325N>G | p.Leu109Val | p.L109V | O95154 | protein_coding | deleterious(0.02) | possibly_damaging(0.777) | TCGA-A8-A07G-01 | Breast | breast invasive carcinoma | Female | >=65 | I/II | Chemotherapy | 5-fluorouracil | CR | |
| AKR7A3 | SNV | Missense_Mutation | novel | c.367N>A | p.Glu123Lys | p.E123K | O95154 | protein_coding | tolerated(0.05) | possibly_damaging(0.798) | TCGA-VS-A94Z-01 | Cervix | cervical & endocervical cancer | Female | <65 | I/II | Chemotherapy | cisplatin | CR |
| AKR7A3 | SNV | Missense_Mutation | rs780744277 | c.991C>T | p.Arg331Cys | p.R331C | O95154 | protein_coding | deleterious(0) | probably_damaging(0.999) | TCGA-A6-2686-01 | Colorectum | colon adenocarcinoma | Female | >=65 | I/II | Unknown | Unknown | SD |
| AKR7A3 | SNV | Missense_Mutation | rs753206965 | c.704N>A | p.Arg235His | p.R235H | O95154 | protein_coding | deleterious(0) | benign(0.278) | TCGA-CA-5796-01 | Colorectum | colon adenocarcinoma | Female | <65 | I/II | Chemotherapy | oxaliplatin | CR |
| AKR7A3 | SNV | Missense_Mutation | novel | c.776N>T | p.Ser259Ile | p.S259I | O95154 | protein_coding | tolerated(0.13) | benign(0.396) | TCGA-A5-A0G2-01 | Endometrium | uterine corpus endometrioid carcinoma | Female | <65 | III/IV | Unknown | Unknown | SD |
| AKR7A3 | SNV | Missense_Mutation | rs756610725 | c.703N>T | p.Arg235Cys | p.R235C | O95154 | protein_coding | deleterious(0.01) | possibly_damaging(0.546) | TCGA-AJ-A5DW-01 | Endometrium | uterine corpus endometrioid carcinoma | Female | <65 | I/II | Unknown | Unknown | SD |
| AKR7A3 | SNV | Missense_Mutation | novel | c.46N>A | p.Ala16Thr | p.A16T | O95154 | protein_coding | tolerated(0.88) | benign(0.005) | TCGA-AP-A1DV-01 | Endometrium | uterine corpus endometrioid carcinoma | Female | <65 | I/II | Unknown | Unknown | SD |
| AKR7A3 | SNV | Missense_Mutation | c.601N>A | p.Ala201Thr | p.A201T | O95154 | protein_coding | deleterious(0.01) | probably_damaging(0.998) | TCGA-AX-A064-01 | Endometrium | uterine corpus endometrioid carcinoma | Female | >=65 | I/II | Unknown | Unknown | SD | |
| AKR7A3 | SNV | Missense_Mutation | rs369669956 | c.302G>A | p.Arg101Gln | p.R101Q | O95154 | protein_coding | tolerated(0.07) | benign(0.379) | TCGA-AX-A1CE-01 | Endometrium | uterine corpus endometrioid carcinoma | Female | <65 | I/II | Unspecific | Paclitaxel | SD |
| AKR7A3 | SNV | Missense_Mutation | rs747280858 | c.542N>T | p.Thr181Met | p.T181M | O95154 | protein_coding | tolerated(0.1) | benign(0.067) | TCGA-D1-A103-01 | Endometrium | uterine corpus endometrioid carcinoma | Female | >=65 | I/II | Unknown | Unknown | SD |
| Page: 1 2 3 |
Top |
Related drugs of malignant transformation related genes |
| Identification of chemicals and drugs interact with genes involved in malignant transfromation |
| (DGIdb 4.0) |
| Entrez ID | Symbol | Category | Interaction Types | Drug Claim Name | Drug Name | PMIDs |
| Page: 1 |

Copyright 2023-Present -The University of Texas Health Science Center at Houston |