Schematic overview of the cellular and molecular mechanisms involved in the cancer progression, including the proposed cellular and molecular mechanisms in cancer cells trajectory. AT1: alveolar type 1 cells; AT2: alveolar type 2 cells; AAH: atypical adenomatous hyperplasia; AIS: adenocarcinoma in situ; MIA: minimally invasive adenocarcinoma; IA: invasive adenocarcinoma; EMT: epithelial-mesenchymal transition

Home

Download

Statistics

Help

Contact

Center for Computational Systems Medicine
leaf

Gene summary

leaf

Malignant transformation analysis

leaf

Malignant transformation related pathway analysis

leaf

Cell-cell communication analysis

leaf

Single-cell gene regulatory network inference analysis

leaf

Somatic mutation of malignant transformation related genes

leaf

Related drugs of malignant transformation related genes

Gene: AKR7A2

Gene summary for AKR7A2

check button Gene summary.

Gene informationSpeciesHuman
Gene symbol

AKR7A2

Gene ID

8574

Gene namealdo-keto reductase family 7 member A2
Gene AliasAFAR
Cytomap1p36.13
Gene Typeprotein-coding
GO ID

GO:0005975

UniProtAcc

B4DZX4


Top

Malignant transformation analysis

check button Identification of the aberrant gene expression in precancerous and cancerous lesions by comparing the gene expression of stem-like cells in diseased tissues with normal stem cells
check button Malignant transformation involving gene list.
Entrez IDSymbolReplicatesSpeciesOrganTissueAdj P-valueLog2FCMalignancy
8574AKR7A2GSM4909281HumanBreastIDC8.11e-051.51e-010.21
8574AKR7A2GSM4909282HumanBreastIDC2.08e-163.95e-01-0.0288
8574AKR7A2GSM4909288HumanBreastIDC2.72e-024.07e-010.0988
8574AKR7A2GSM4909291HumanBreastIDC1.78e-043.72e-010.1753
8574AKR7A2GSM4909293HumanBreastIDC2.10e-051.85e-010.1581
8574AKR7A2GSM4909294HumanBreastIDC1.32e-113.69e-010.2022
8574AKR7A2GSM4909298HumanBreastIDC5.58e-051.15e-010.1551
8574AKR7A2GSM4909304HumanBreastIDC4.08e-446.82e-010.1636
8574AKR7A2GSM4909305HumanBreastIDC2.15e-032.86e-010.0436
8574AKR7A2GSM4909306HumanBreastIDC5.10e-093.10e-010.1564
8574AKR7A2GSM4909318HumanBreastIDC8.68e-065.27e-010.2031
8574AKR7A2GSM4909319HumanBreastIDC7.36e-171.94e-010.1563
8574AKR7A2brca2HumanBreastPrecancer1.37e-036.67e-02-0.024
8574AKR7A2brca3HumanBreastPrecancer1.46e-029.31e-02-0.0263
8574AKR7A2NCCBC2HumanBreastDCIS1.91e-021.46e-010.1554
8574AKR7A2P1HumanBreastIDC2.98e-03-5.54e-020.1527
8574AKR7A2DCIS2HumanBreastDCIS9.30e-497.53e-020.0085
8574AKR7A2HTA11_3410_2000001011HumanColorectumAD1.06e-042.54e-010.0155
8574AKR7A2HTA11_2487_2000001011HumanColorectumSER2.21e-126.02e-01-0.1808
8574AKR7A2HTA11_1938_2000001011HumanColorectumAD1.14e-085.49e-01-0.0811
Page: 1 2 3 4 5 6 7 8 9 10 

check button Transcriptomic changes along malignancy continuum.
TissueExpression DynamicsAbbreviation
BreastThe image shows the transcriptomic changes along malignancy continuum.log2FC in expression of this searched gene in stem-like cells from each diseased tissue sample relative to stem-like cells in normal samples in each tissue plotted against the malignancy continuum. Samples are colored based on if they are from different disease stage.
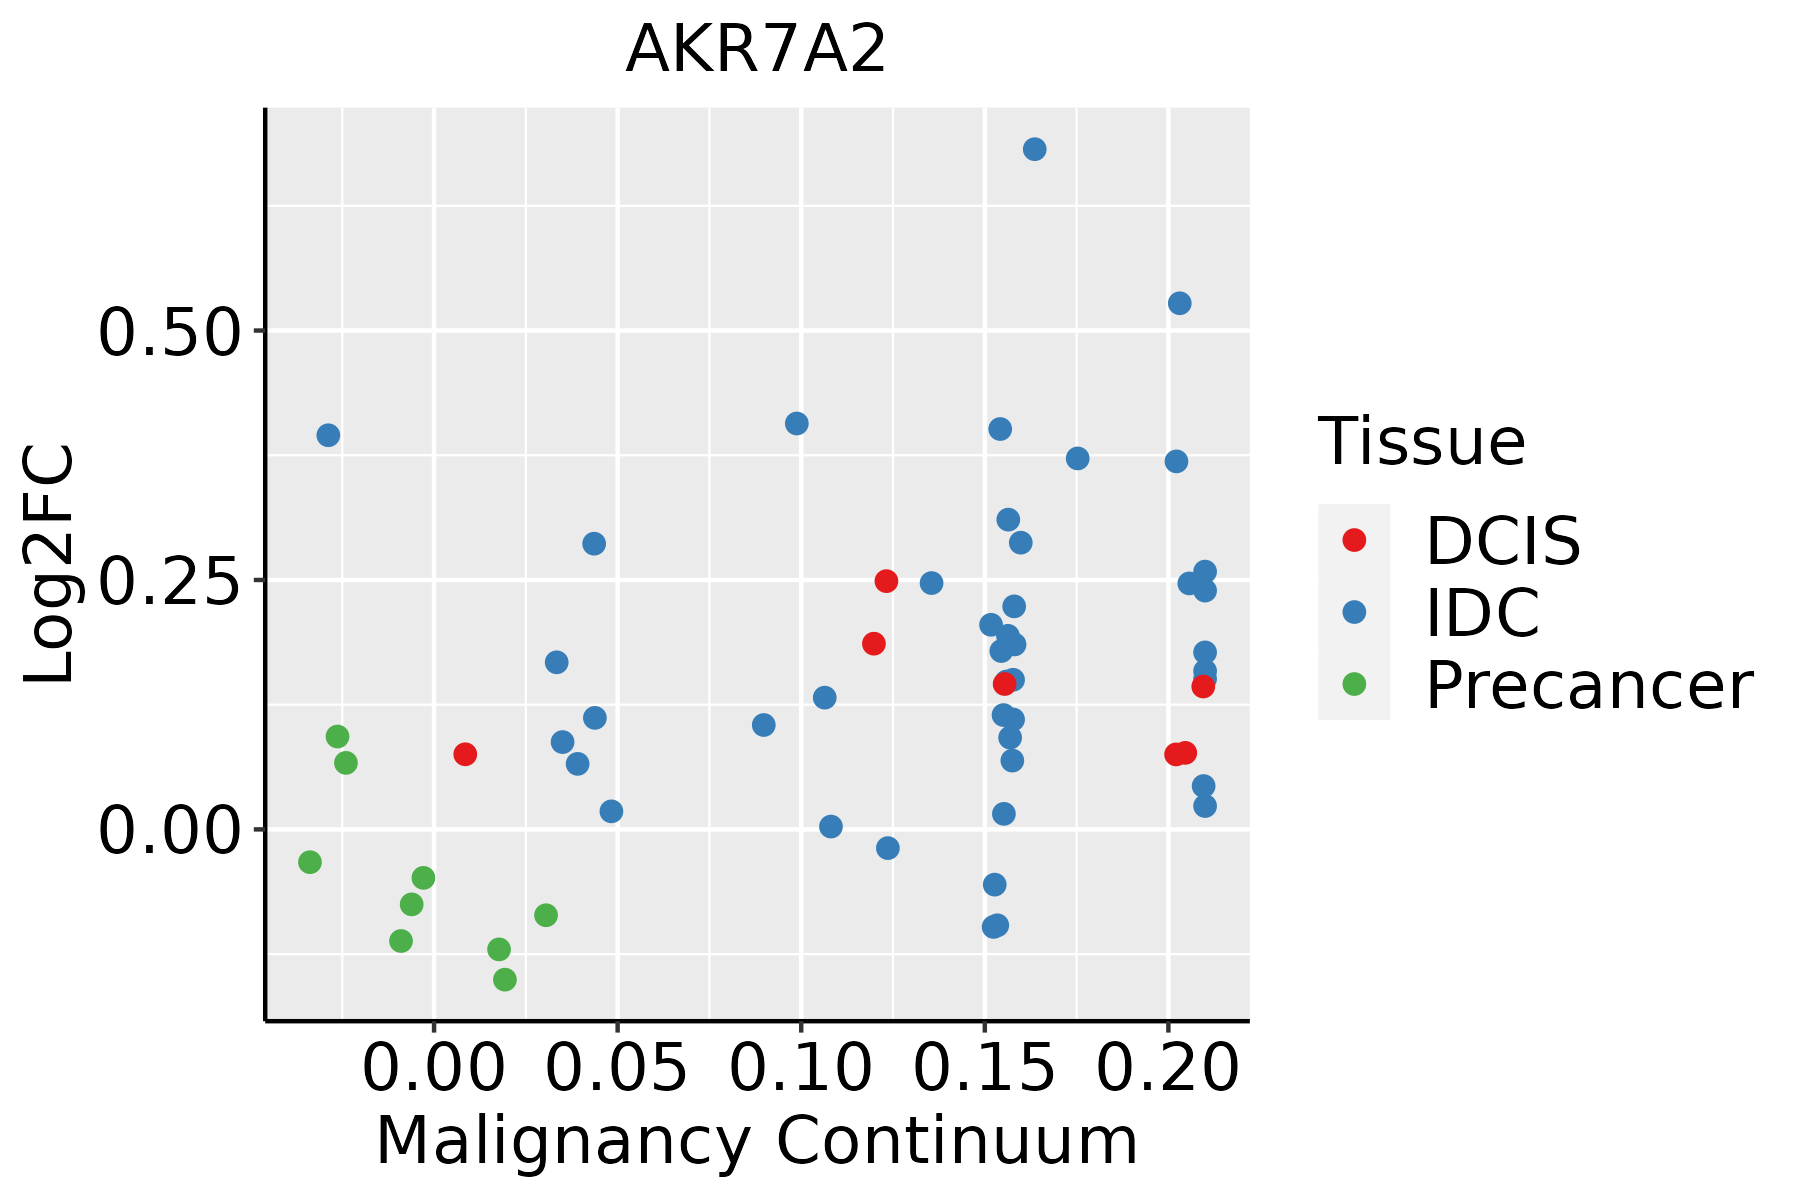
IDC: Invasive ductal carcinoma
DCIS: Ductal carcinoma in situ
Precancer(BRCA1-mut): Precancerous lesion from BRCA1 mutation carriers
Colorectum (GSE201348)The image shows the transcriptomic changes along malignancy continuum.log2FC in expression of this searched gene in stem-like cells from each diseased tissue sample relative to stem-like cells in normal samples in each tissue plotted against the malignancy continuum. Samples are colored based on if they are from different disease stage.FAP: Familial adenomatous polyposis
CRC: Colorectal cancer
Colorectum (HTA11)The image shows the transcriptomic changes along malignancy continuum.log2FC in expression of this searched gene in stem-like cells from each diseased tissue sample relative to stem-like cells in normal samples in each tissue plotted against the malignancy continuum. Samples are colored based on if they are from different disease stage.AD: Adenomas
SER: Sessile serrated lesions
MSI-H: Microsatellite-high colorectal cancer
MSS: Microsatellite stable colorectal cancer
EndometriumThe image shows the transcriptomic changes along malignancy continuum.log2FC in expression of this searched gene in stem-like cells from each diseased tissue sample relative to stem-like cells in normal samples in each tissue plotted against the malignancy continuum. Samples are colored based on if they are from different disease stage.AEH: Atypical endometrial hyperplasia
EEC: Endometrioid Cancer
EsophagusThe image shows the transcriptomic changes along malignancy continuum.log2FC in expression of this searched gene in stem-like cells from each diseased tissue sample relative to stem-like cells in normal samples in each tissue plotted against the malignancy continuum. Samples are colored based on if they are from different disease stage.
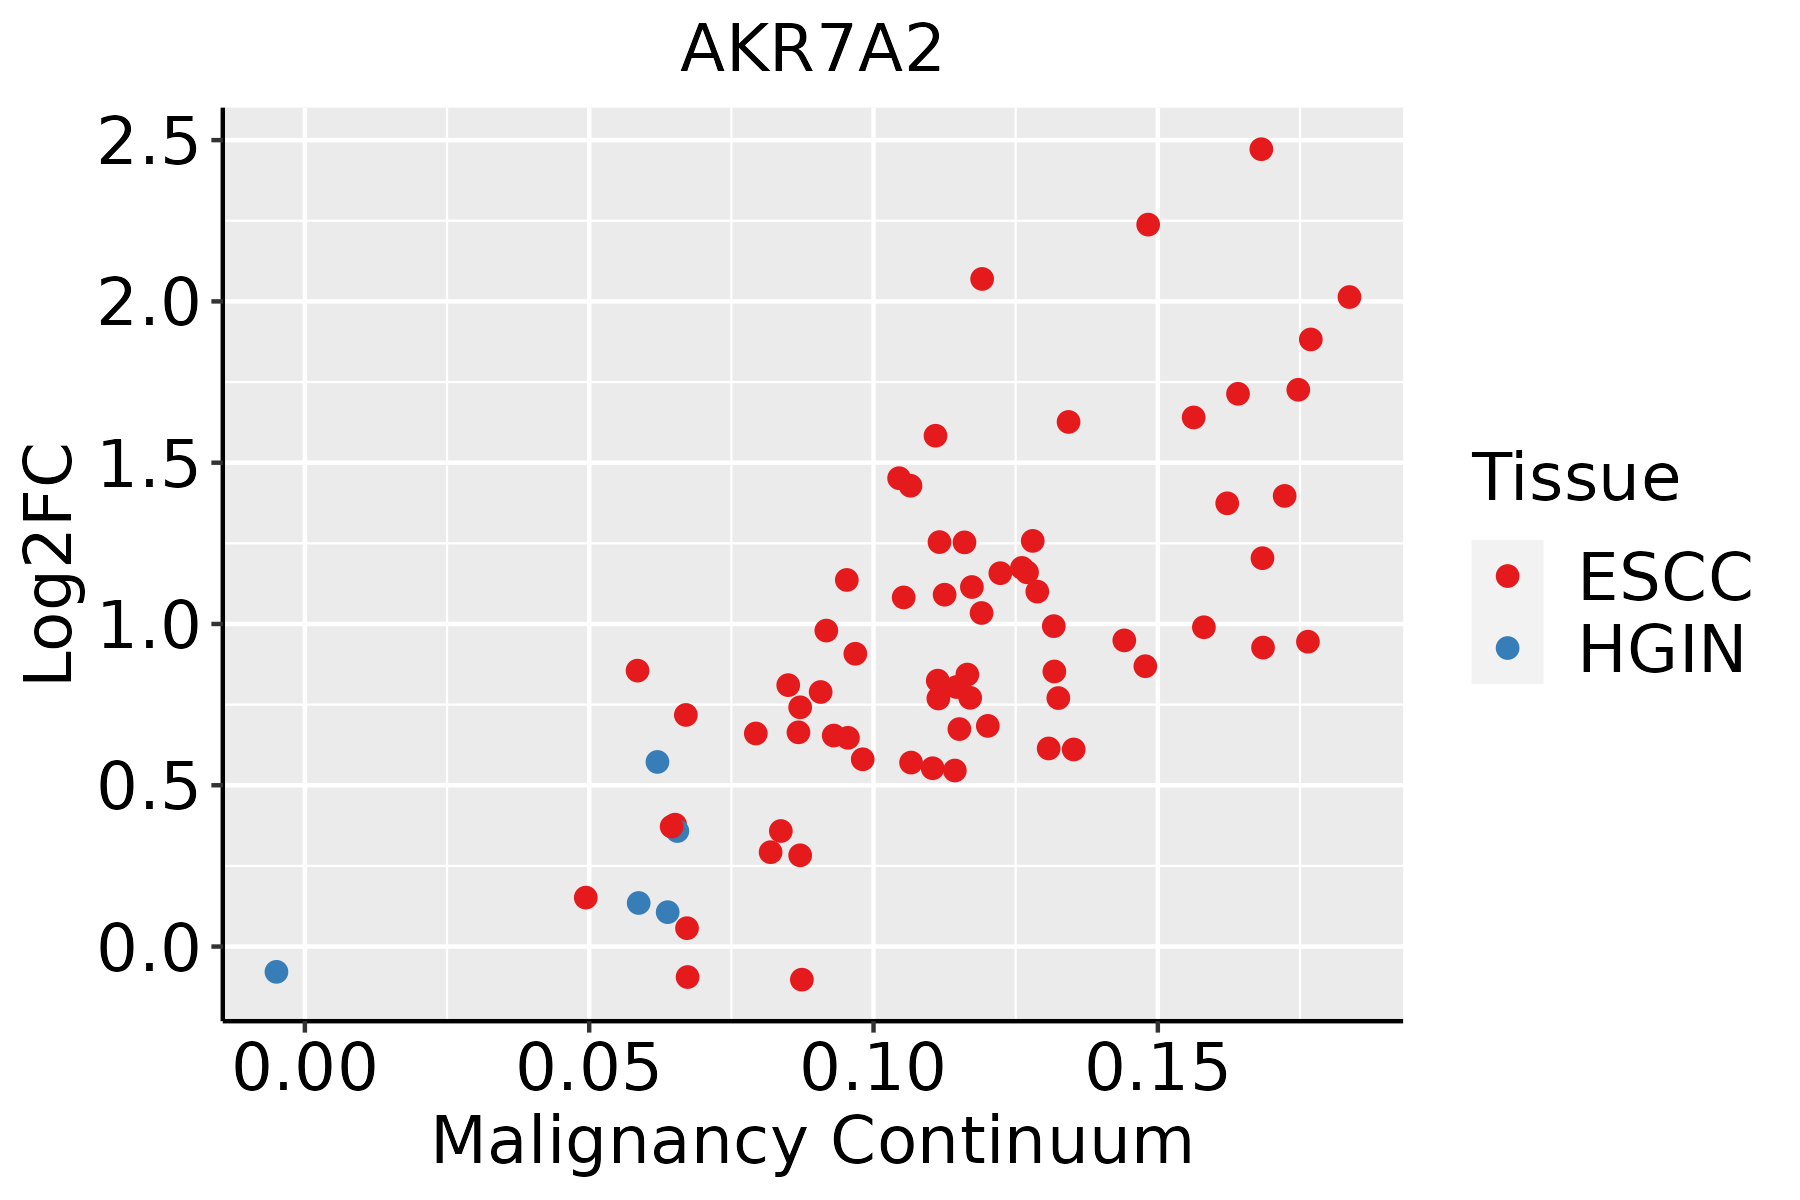
ESCC: Esophageal squamous cell carcinoma
HGIN: High-grade intraepithelial neoplasias
LGIN: Low-grade intraepithelial neoplasias
LiverThe image shows the transcriptomic changes along malignancy continuum.log2FC in expression of this searched gene in stem-like cells from each diseased tissue sample relative to stem-like cells in normal samples in each tissue plotted against the malignancy continuum. Samples are colored based on if they are from different disease stage.HCC: Hepatocellular carcinoma
NAFLD: Non-alcoholic fatty liver disease
Oral CavityThe image shows the transcriptomic changes along malignancy continuum.log2FC in expression of this searched gene in stem-like cells from each diseased tissue sample relative to stem-like cells in normal samples in each tissue plotted against the malignancy continuum. Samples are colored based on if they are from different disease stage.
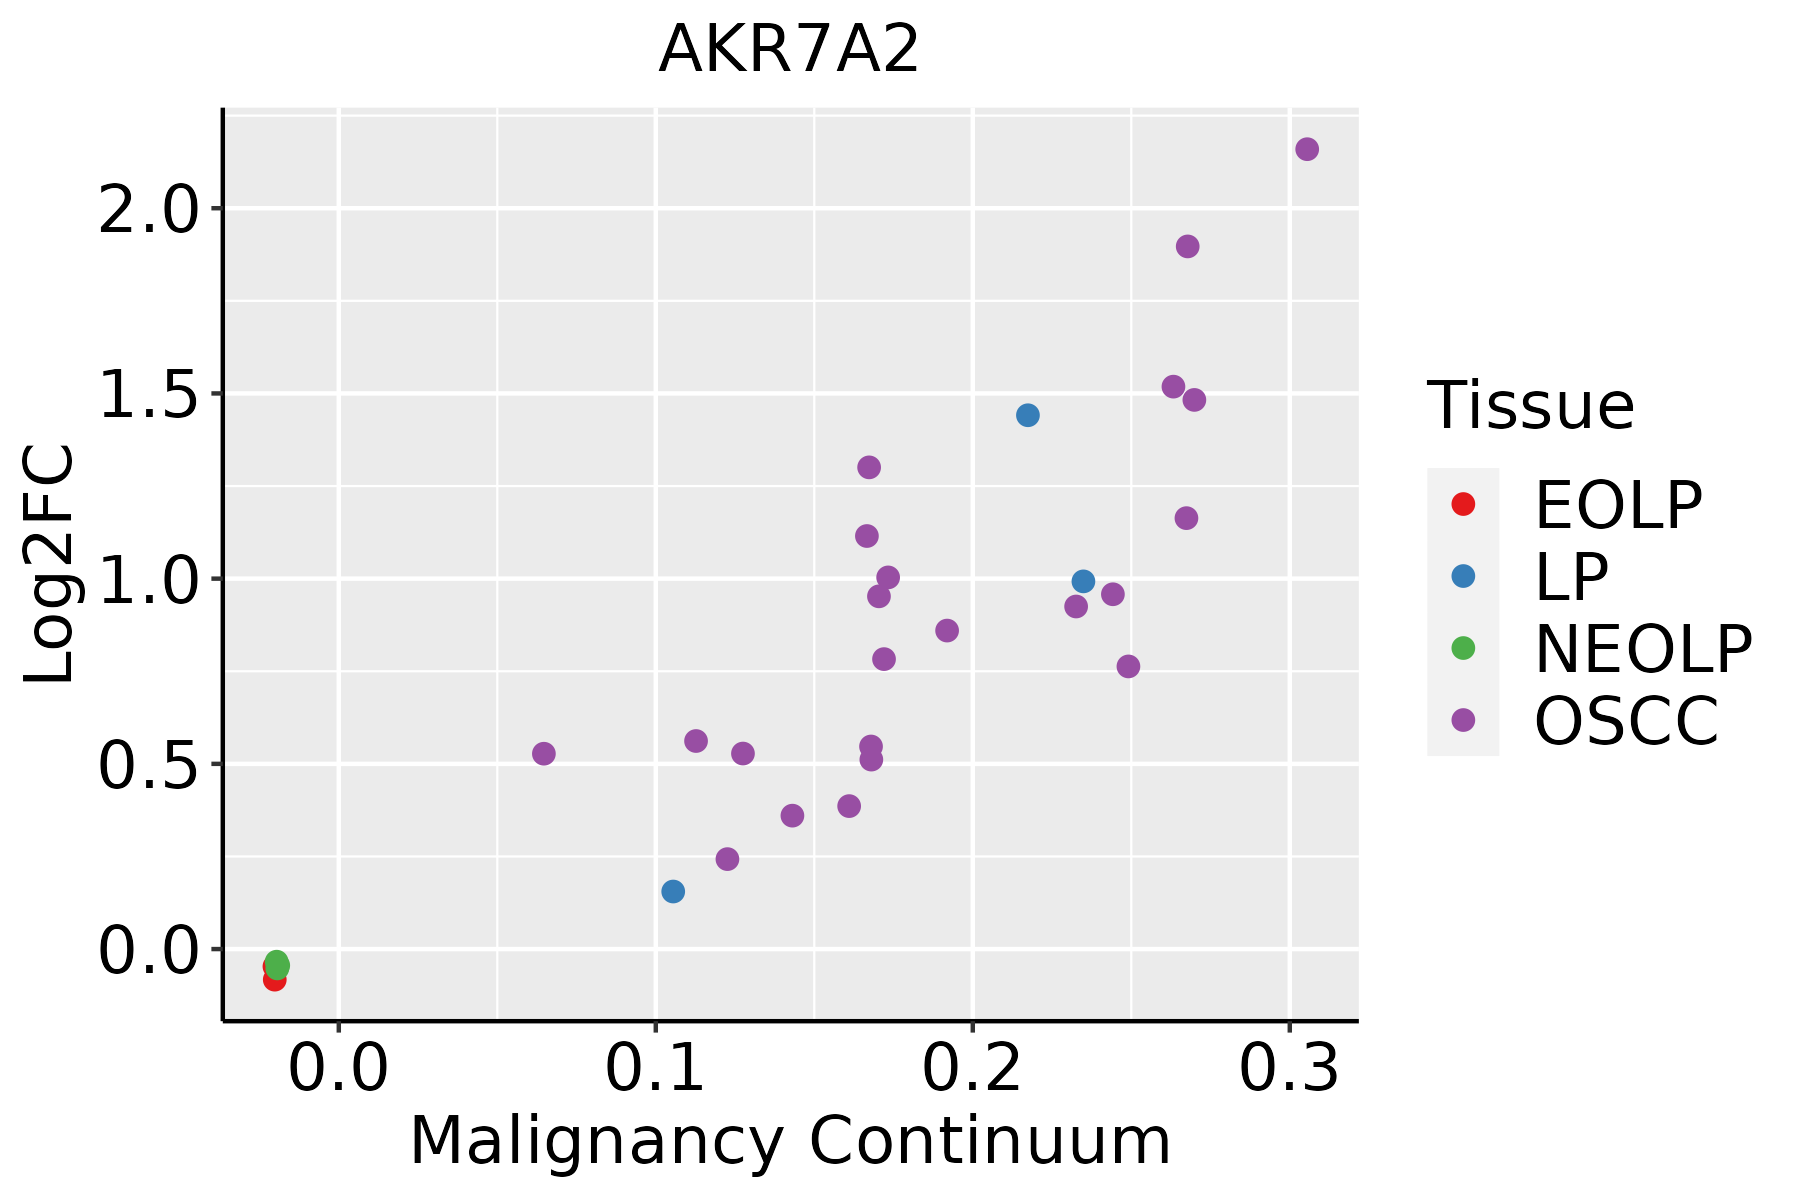
EOLP: Erosive Oral lichen planus
LP: leukoplakia
NEOLP: Non-erosive oral lichen planus
OSCC: Oral squamous cell carcinoma
SkinThe image shows the transcriptomic changes along malignancy continuum.log2FC in expression of this searched gene in stem-like cells from each diseased tissue sample relative to stem-like cells in normal samples in each tissue plotted against the malignancy continuum. Samples are colored based on if they are from different disease stage.AK: Actinic keratosis
cSCC: Cutaneous squamous cell carcinoma
SCCIS:squamous cell carcinoma in situ
ThyroidThe image shows the transcriptomic changes along malignancy continuum.log2FC in expression of this searched gene in stem-like cells from each diseased tissue sample relative to stem-like cells in normal samples in each tissue plotted against the malignancy continuum. Samples are colored based on if they are from different disease stage.
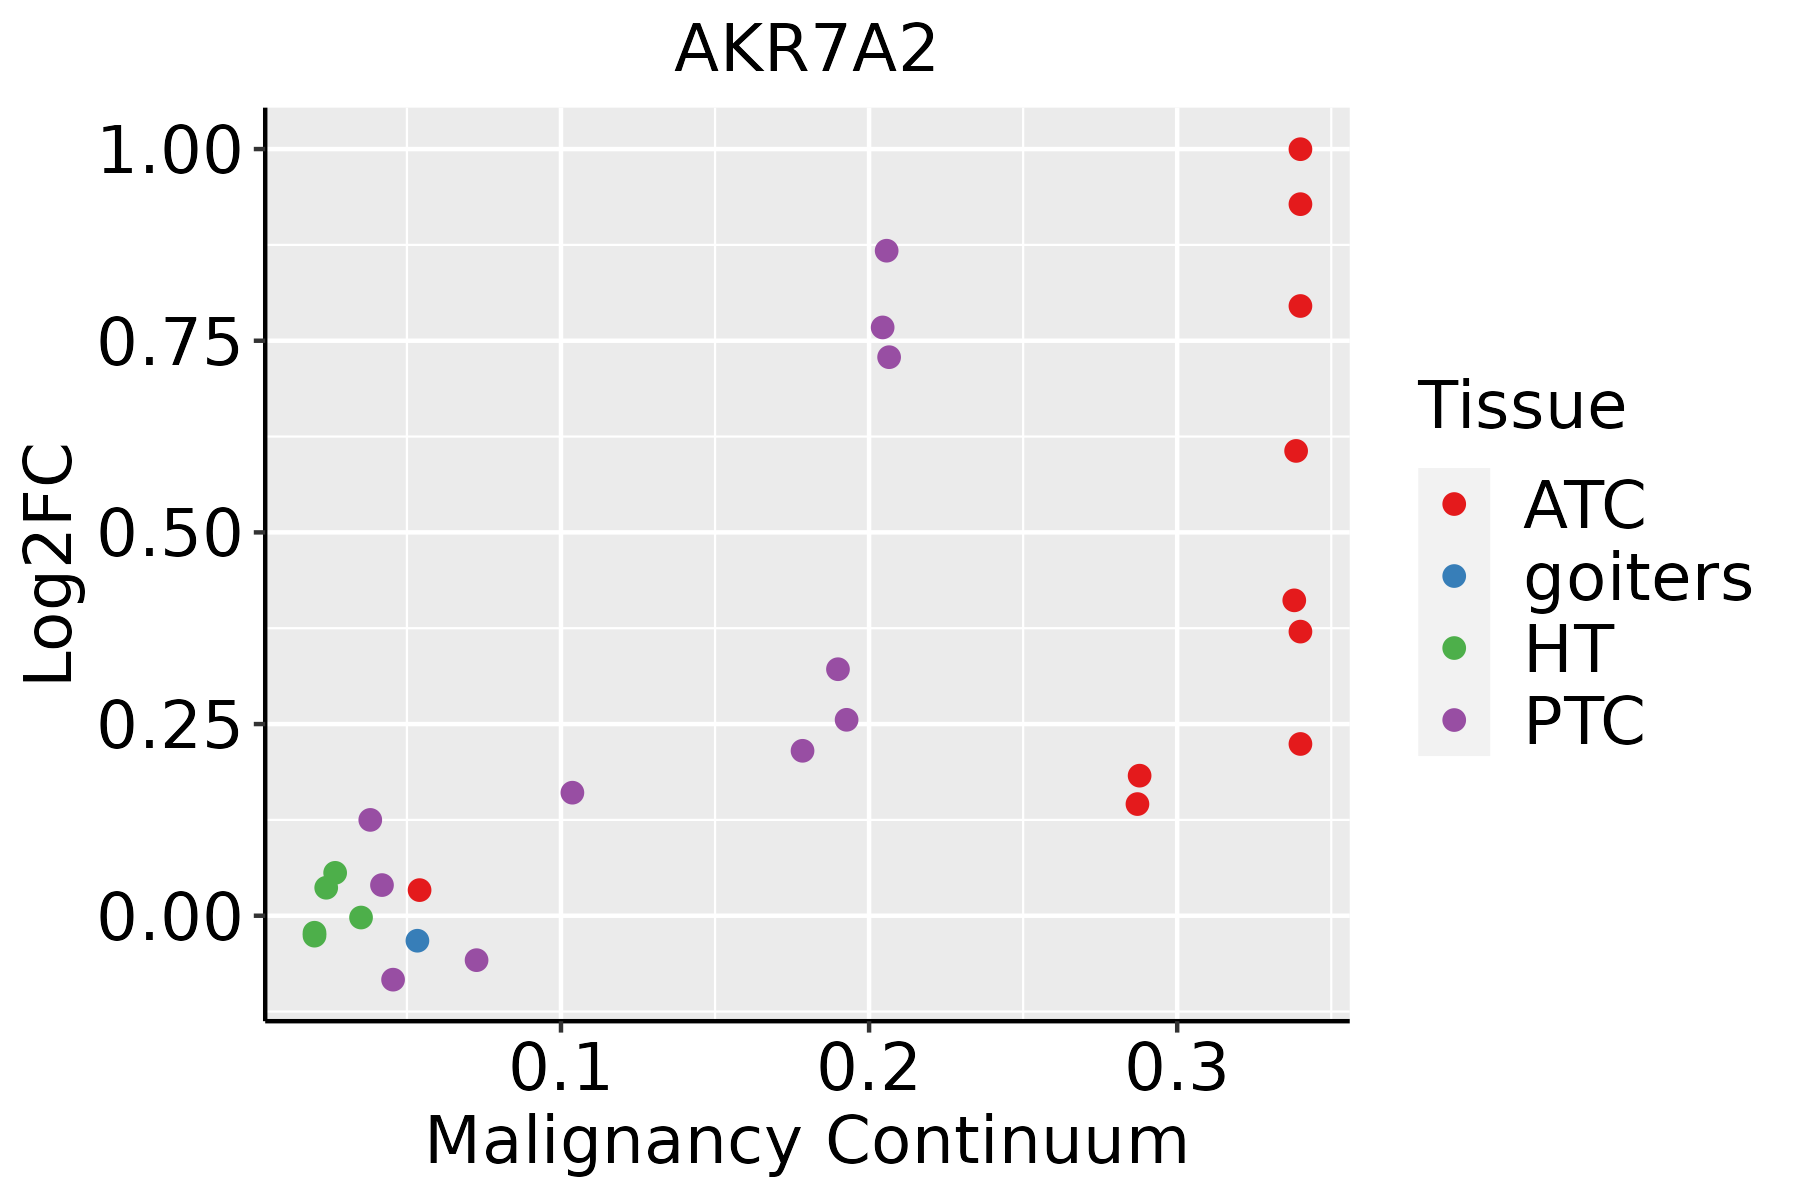
ATC: Anaplastic thyroid cancer
HT: Hashimoto's thyroiditis
PTC: Papillary thyroid cancer
∗log2FC in expression of this searched gene in stem-like cells from each diseased tissue sample relative to stem-like cells in normal samples in each tissue plotted against the malignancy continuum. Samples are colored based on if they are from different disease stage.

Top

Malignant transformation related pathway analysis

check buttonFind out the enriched GO biological processes and KEGG pathways involved in transition from healthy to precancer to cancer
check button Figure of enriched GO biological processes.
TissueDisease StageEnriched GO biological Processes
ColorectumADGO analysis - Figure of enriched GO biological processes: Top 15 enriched GO BP terms are showed in the bar plot of each disease state in each tissue. Each row represents a significant GO biological process which is colored according to the -log10(p.adjust).
ColorectumSERGO analysis - Figure of enriched GO biological processes: Top 15 enriched GO BP terms are showed in the bar plot of each disease state in each tissue. Each row represents a significant GO biological process which is colored according to the -log10(p.adjust).
ColorectumMSSGO analysis - Figure of enriched GO biological processes: Top 15 enriched GO BP terms are showed in the bar plot of each disease state in each tissue. Each row represents a significant GO biological process which is colored according to the -log10(p.adjust).
ColorectumMSI-HGO analysis - Figure of enriched GO biological processes: Top 15 enriched GO BP terms are showed in the bar plot of each disease state in each tissue. Each row represents a significant GO biological process which is colored according to the -log10(p.adjust).
ColorectumFAPGO analysis - Figure of enriched GO biological processes: Top 15 enriched GO BP terms are showed in the bar plot of each disease state in each tissue. Each row represents a significant GO biological process which is colored according to the -log10(p.adjust).
∗Top 15 enriched GO BP terms are showed in the bar plot of each disease state in each tissue. Each row represents a significant GO biological process which is colored according to the -log10(p.adjust).
Page: 1 2 3 4 5 6 7 8 9 

check button Enriched GO biological processes.
GO IDTissueDisease StageDescriptionGene RatioBg Ratiopvaluep.adjustCount
GO:00060918BreastPrecancergeneration of precursor metabolites and energy94/1080490/187231.54e-251.64e-2294
GO:00229008BreastPrecancerelectron transport chain42/1080175/187231.37e-154.59e-1342
GO:000609113BreastIDCgeneration of precursor metabolites and energy103/1434490/187231.53e-211.74e-18103
GO:002290013BreastIDCelectron transport chain51/1434175/187232.23e-178.43e-1551
GO:000609123BreastDCISgeneration of precursor metabolites and energy103/1390490/187231.46e-221.65e-19103
GO:002290023BreastDCISelectron transport chain51/1390175/187236.01e-182.62e-1551
GO:0006091ColorectumADgeneration of precursor metabolites and energy209/3918490/187233.17e-286.61e-25209
GO:0022900ColorectumADelectron transport chain89/3918175/187231.42e-188.91e-1689
GO:0006066ColorectumADalcohol metabolic process106/3918353/187233.02e-055.57e-04106
GO:0034308ColorectumADprimary alcohol metabolic process35/3918102/187231.16e-031.05e-0235
GO:0006081ColorectumADcellular aldehyde metabolic process22/391860/187233.64e-032.60e-0222
GO:00060911ColorectumSERgeneration of precursor metabolites and energy168/2897490/187231.39e-251.70e-22168
GO:00229001ColorectumSERelectron transport chain77/2897175/187231.77e-191.36e-1677
GO:00060661ColorectumSERalcohol metabolic process79/2897353/187233.50e-045.50e-0379
GO:00343081ColorectumSERprimary alcohol metabolic process26/2897102/187235.87e-034.29e-0226
GO:00060912ColorectumMSSgeneration of precursor metabolites and energy186/3467490/187231.14e-242.15e-21186
GO:00229002ColorectumMSSelectron transport chain83/3467175/187232.06e-181.17e-1583
GO:00060662ColorectumMSSalcohol metabolic process92/3467353/187232.57e-043.46e-0392
GO:00060811ColorectumMSScellular aldehyde metabolic process21/346760/187231.81e-031.60e-0221
GO:00229003ColorectumMSI-Helectron transport chain52/1319175/187231.13e-195.21e-1752
Page: 1 2 3 4 5 6 

check button Enriched KEGG pathways.
Pathway IDTissueDisease StageDescriptionGene RatioBg Ratiopvaluep.adjustqvalueCount
Page: 1 

Top

Cell-cell communication analysis

check buttonIdentification of potential cell-cell interactions between two cell types and their ligand-receptor pairs for different disease states
LigandReceptorLRpairPathwayTissueDisease Stage
Page: 1 

Top

Single-cell gene regulatory network inference analysis

check buttonFind out the significant the regulons (TFs) and the target genes of each regulon across cell types for different disease states
TFCell TypeTissueDisease StageTarget GeneRSSRegulon Activity
∗The dot plots of a searched regulon are shown for all cell subpopulations in each disease state of each tissue based on the regulon specific score inferred using pySCENIC and by calculating the average expression.
Page: 1 

Top

Somatic mutation of malignant transformation related genes

check buttonAnnotation of somatic variants for genes involved in malignant transformation
Hugo SymbolVariant ClassVariant ClassificationdbSNP RSHGVScHGVSpHGVSp ShortSWISSPROTBIOTYPESIFTPolyPhenTumor Sample BarcodeTissueHistologySexAgeStageTherapy TypesDrugsOutcome
AKR7A2SNVMissense_Mutationrs773248892c.847G>Ap.Ala283Thrp.A283TO43488protein_codingtolerated(0.37)benign(0.003)TCGA-2W-A8YY-01Cervixcervical & endocervical cancerFemale<65I/IIChemotherapycisplatinCR
AKR7A2SNVMissense_Mutationrs775556235c.862N>Ap.Ala288Thrp.A288TO43488protein_codingtolerated(0.39)benign(0.003)TCGA-A5-A0G1-01Endometriumuterine corpus endometrioid carcinomaFemale>=65I/IIUnknownUnknownSD
AKR7A2SNVMissense_Mutationrs146046785c.358N>Tp.Arg120Trpp.R120WO43488protein_codingdeleterious(0)probably_damaging(0.977)TCGA-A5-A0G2-01Endometriumuterine corpus endometrioid carcinomaFemale<65III/IVUnknownUnknownSD
AKR7A2SNVMissense_Mutationnovelc.798N>Tp.Lys266Asnp.K266NO43488protein_codingtolerated(0.26)possibly_damaging(0.642)TCGA-AP-A059-01Endometriumuterine corpus endometrioid carcinomaFemale>=65I/IIUnknownUnknownSD
AKR7A2SNVMissense_Mutationnovelc.142N>Ap.Gly48Argp.G48RO43488protein_codingdeleterious(0)probably_damaging(0.99)TCGA-AX-A1C4-01Endometriumuterine corpus endometrioid carcinomaFemale<65I/IIUnknownUnknownSD
AKR7A2SNVMissense_Mutationrs150666132c.472C>Tp.Arg158Trpp.R158WO43488protein_codingdeleterious(0)possibly_damaging(0.884)TCGA-B5-A11E-01Endometriumuterine corpus endometrioid carcinomaFemale<65I/IIUnknownUnknownSD
AKR7A2SNVMissense_Mutationnovelc.884C>Ap.Ala295Aspp.A295DO43488protein_codingdeleterious(0)probably_damaging(0.938)TCGA-B5-A3FC-01Endometriumuterine corpus endometrioid carcinomaFemale<65I/IIUnknownUnknownSD
AKR7A2SNVMissense_Mutationc.835G>Ap.Ala279Thrp.A279TO43488protein_codingtolerated(0.06)benign(0.362)TCGA-D1-A0ZO-01Endometriumuterine corpus endometrioid carcinomaFemale>=65I/IIUnknownUnknownSD
AKR7A2SNVMissense_Mutationc.1012N>Ap.Ala338Thrp.A338TO43488protein_codingtolerated(0.39)benign(0.007)TCGA-D1-A103-01Endometriumuterine corpus endometrioid carcinomaFemale>=65I/IIUnknownUnknownSD
AKR7A2SNVMissense_Mutationnovelc.374N>Tp.Thr125Metp.T125MO43488protein_codingdeleterious(0.01)benign(0.098)TCGA-DF-A2KU-01Endometriumuterine corpus endometrioid carcinomaFemaleUnknownI/IIUnknownUnknownSD
Page: 1 2 3 

Top

Related drugs of malignant transformation related genes

check buttonIdentification of chemicals and drugs interact with genes involved in malignant transfromation
(DGIdb 4.0)
Entrez IDSymbolCategoryInteraction TypesDrug Claim NameDrug NamePMIDs
8574AKR7A2DRUGGABLE GENOME, ENZYMEdaunorubicinDAUNORUBICIN20837989
8574AKR7A2DRUGGABLE GENOME, ENZYMEdoxorubicinDOXORUBICIN20837989
Page: 1