
|
|||||
|
 | |
| |
| |
| |
| |
| |
|
Gene: AKR1D1 |
Gene summary for AKR1D1 |
| Gene information | Species | Human | Gene symbol | AKR1D1 | Gene ID | 6718 |
| Gene name | aldo-keto reductase family 1 member D1 | |
| Gene Alias | 3o5bred | |
| Cytomap | 7q33 | |
| Gene Type | protein-coding | GO ID | GO:0006066 | UniProtAcc | P51857 |
Top |
Malignant transformation analysis |
| Identification of the aberrant gene expression in precancerous and cancerous lesions by comparing the gene expression of stem-like cells in diseased tissues with normal stem cells |
| Entrez ID | Symbol | Replicates | Species | Organ | Tissue | Adj P-value | Log2FC | Malignancy |
| 6718 | AKR1D1 | S43 | Human | Liver | Cirrhotic | 4.36e-03 | -1.10e-01 | -0.0187 |
| 6718 | AKR1D1 | HCC1_Meng | Human | Liver | HCC | 7.11e-35 | -1.83e-02 | 0.0246 |
| 6718 | AKR1D1 | HCC2_Meng | Human | Liver | HCC | 1.02e-04 | -1.49e-01 | 0.0107 |
| 6718 | AKR1D1 | cirrhotic1 | Human | Liver | Cirrhotic | 2.24e-05 | -1.47e-01 | 0.0202 |
| 6718 | AKR1D1 | cirrhotic2 | Human | Liver | Cirrhotic | 1.02e-04 | -1.44e-01 | 0.0201 |
| 6718 | AKR1D1 | HCC2 | Human | Liver | HCC | 3.43e-07 | 1.13e+00 | 0.5341 |
| 6718 | AKR1D1 | HCC5 | Human | Liver | HCC | 7.80e-11 | 1.45e+00 | 0.4932 |
| 6718 | AKR1D1 | Pt14.d | Human | Liver | HCC | 2.24e-05 | -1.49e-01 | 0.0143 |
| 6718 | AKR1D1 | S016 | Human | Liver | HCC | 3.01e-02 | -1.49e-01 | 0.2243 |
| Page: 1 |
| Tissue | Expression Dynamics | Abbreviation |
| Liver | 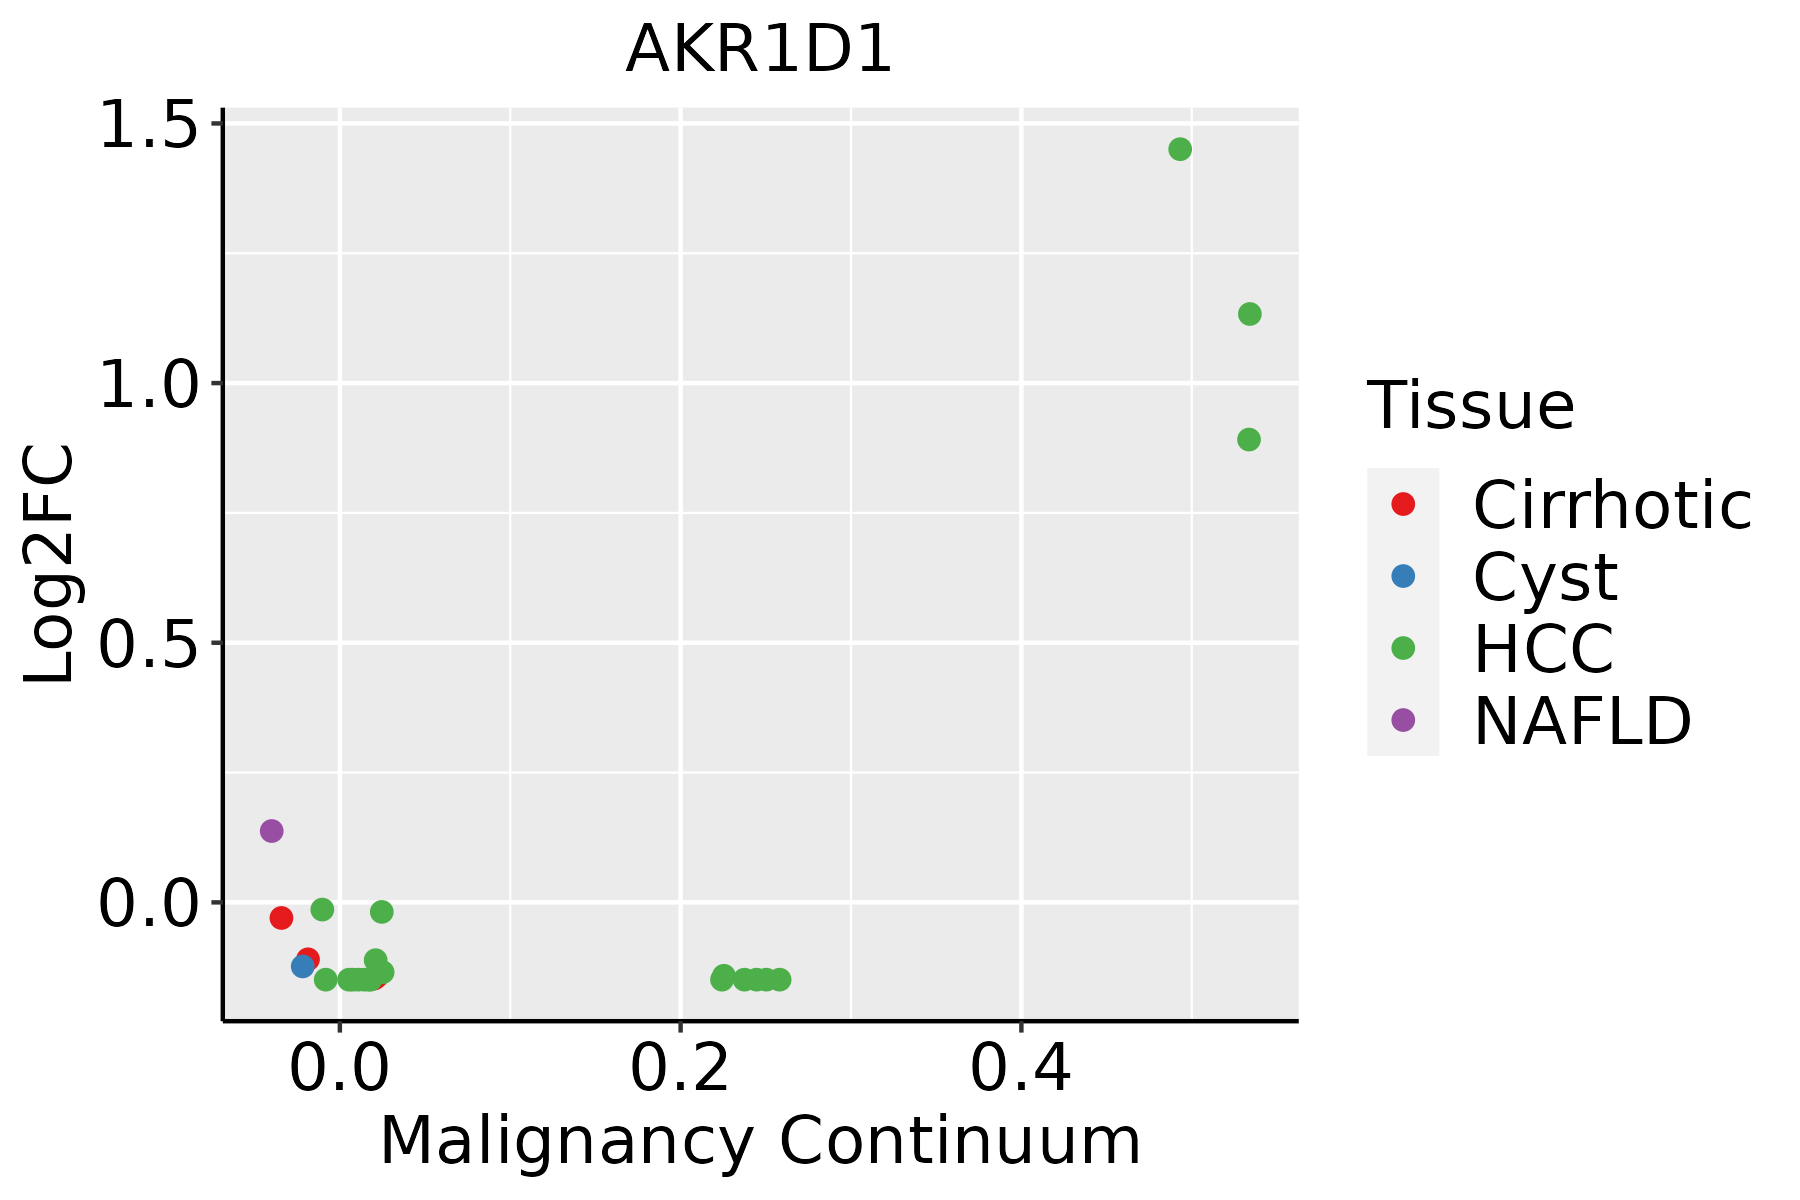 | HCC: Hepatocellular carcinoma |
| NAFLD: Non-alcoholic fatty liver disease |
| ∗log2FC in expression of this searched gene in stem-like cells from each diseased tissue sample relative to stem-like cells in normal samples in each tissue plotted against the malignancy continuum. Samples are colored based on if they are from different disease stage. |
Top |
Malignant transformation related pathway analysis |
| Find out the enriched GO biological processes and KEGG pathways involved in transition from healthy to precancer to cancer |
| Tissue | Disease Stage | Enriched GO biological Processes |
| Colorectum | AD |  |
| Colorectum | SER |  |
| Colorectum | MSS |  |
| Colorectum | MSI-H |  |
| Colorectum | FAP |  |
| ∗Top 15 enriched GO BP terms are showed in the bar plot of each disease state in each tissue. Each row represents a significant GO biological process which is colored according to the -log10(p.adjust). |
| Page: 1 2 3 4 5 6 7 8 9 |
| GO ID | Tissue | Disease Stage | Description | Gene Ratio | Bg Ratio | pvalue | p.adjust | Count |
| GO:190136111 | Liver | Cirrhotic | organic cyclic compound catabolic process | 213/4634 | 495/18723 | 1.58e-19 | 3.67e-17 | 213 |
| GO:000820211 | Liver | Cirrhotic | steroid metabolic process | 143/4634 | 319/18723 | 2.79e-15 | 3.18e-13 | 143 |
| GO:001605312 | Liver | Cirrhotic | organic acid biosynthetic process | 139/4634 | 316/18723 | 4.28e-14 | 3.83e-12 | 139 |
| GO:004639412 | Liver | Cirrhotic | carboxylic acid biosynthetic process | 137/4634 | 314/18723 | 1.40e-13 | 1.14e-11 | 137 |
| GO:19026521 | Liver | Cirrhotic | secondary alcohol metabolic process | 75/4634 | 147/18723 | 5.62e-12 | 3.91e-10 | 75 |
| GO:004428211 | Liver | Cirrhotic | small molecule catabolic process | 151/4634 | 376/18723 | 2.20e-11 | 1.34e-09 | 151 |
| GO:00082031 | Liver | Cirrhotic | cholesterol metabolic process | 70/4634 | 137/18723 | 2.59e-11 | 1.55e-09 | 70 |
| GO:00161251 | Liver | Cirrhotic | sterol metabolic process | 75/4634 | 152/18723 | 4.54e-11 | 2.61e-09 | 75 |
| GO:000606612 | Liver | Cirrhotic | alcohol metabolic process | 141/4634 | 353/18723 | 1.57e-10 | 8.03e-09 | 141 |
| GO:001605411 | Liver | Cirrhotic | organic acid catabolic process | 104/4634 | 240/18723 | 1.91e-10 | 9.53e-09 | 104 |
| GO:004639511 | Liver | Cirrhotic | carboxylic acid catabolic process | 102/4634 | 236/18723 | 3.41e-10 | 1.63e-08 | 102 |
| GO:007233011 | Liver | Cirrhotic | monocarboxylic acid biosynthetic process | 93/4634 | 214/18723 | 1.43e-09 | 6.16e-08 | 93 |
| GO:00066941 | Liver | Cirrhotic | steroid biosynthetic process | 77/4634 | 173/18723 | 1.02e-08 | 3.91e-07 | 77 |
| GO:007232911 | Liver | Cirrhotic | monocarboxylic acid catabolic process | 56/4634 | 122/18723 | 2.87e-07 | 7.01e-06 | 56 |
| GO:001604212 | Liver | Cirrhotic | lipid catabolic process | 112/4634 | 320/18723 | 2.31e-05 | 3.03e-04 | 112 |
| GO:19016171 | Liver | Cirrhotic | organic hydroxy compound biosynthetic process | 81/4634 | 237/18723 | 6.73e-04 | 5.06e-03 | 81 |
| GO:00082061 | Liver | Cirrhotic | bile acid metabolic process | 22/4634 | 49/18723 | 1.64e-03 | 1.05e-02 | 22 |
| GO:004244511 | Liver | Cirrhotic | hormone metabolic process | 73/4634 | 218/18723 | 2.22e-03 | 1.36e-02 | 73 |
| GO:0008209 | Liver | Cirrhotic | androgen metabolic process | 15/4634 | 30/18723 | 2.45e-03 | 1.47e-02 | 15 |
| GO:00066991 | Liver | Cirrhotic | bile acid biosynthetic process | 17/4634 | 36/18723 | 2.82e-03 | 1.63e-02 | 17 |
| Page: 1 2 |
| Pathway ID | Tissue | Disease Stage | Description | Gene Ratio | Bg Ratio | pvalue | p.adjust | qvalue | Count |
| hsa001202 | Liver | HCC | Primary bile acid biosynthesis | 14/4020 | 17/8465 | 3.49e-03 | 1.12e-02 | 6.22e-03 | 14 |
| hsa001203 | Liver | HCC | Primary bile acid biosynthesis | 14/4020 | 17/8465 | 3.49e-03 | 1.12e-02 | 6.22e-03 | 14 |
| Page: 1 |
Top |
Cell-cell communication analysis |
| Identification of potential cell-cell interactions between two cell types and their ligand-receptor pairs for different disease states |
| Ligand | Receptor | LRpair | Pathway | Tissue | Disease Stage |
| Page: 1 |
Top |
Single-cell gene regulatory network inference analysis |
| Find out the significant the regulons (TFs) and the target genes of each regulon across cell types for different disease states |
| TF | Cell Type | Tissue | Disease Stage | Target Gene | RSS | Regulon Activity |
| ∗The dot plots of a searched regulon are shown for all cell subpopulations in each disease state of each tissue based on the regulon specific score inferred using pySCENIC and by calculating the average expression. |
| Page: 1 |
Top |
Somatic mutation of malignant transformation related genes |
| Annotation of somatic variants for genes involved in malignant transformation |
| Hugo Symbol | Variant Class | Variant Classification | dbSNP RS | HGVSc | HGVSp | HGVSp Short | SWISSPROT | BIOTYPE | SIFT | PolyPhen | Tumor Sample Barcode | Tissue | Histology | Sex | Age | Stage | Therapy Types | Drugs | Outcome |
| AKR1D1 | SNV | Missense_Mutation | rs867480105 | c.295C>T | p.Arg99Cys | p.R99C | P51857 | protein_coding | deleterious(0) | probably_damaging(0.941) | TCGA-E2-A1LH-01 | Breast | breast invasive carcinoma | Female | <65 | I/II | Chemotherapy | adriamycin | SD |
| AKR1D1 | insertion | Frame_Shift_Ins | novel | c.446_447insTCTCCCTCATTCCCACCACCCCACCTCATTTCCAAGCCAA | p.Thr150LeufsTer36 | p.T150Lfs*36 | P51857 | protein_coding | TCGA-A8-A09E-01 | Breast | breast invasive carcinoma | Female | >=65 | III/IV | Hormone Therapy | anastrozole | SD | ||
| AKR1D1 | SNV | Missense_Mutation | novel | c.145T>C | p.Tyr49His | p.Y49H | P51857 | protein_coding | deleterious(0) | probably_damaging(0.996) | TCGA-2W-A8YY-01 | Cervix | cervical & endocervical cancer | Female | <65 | I/II | Chemotherapy | cisplatin | CR |
| AKR1D1 | SNV | Missense_Mutation | c.40N>A | p.Asp14Asn | p.D14N | P51857 | protein_coding | deleterious(0.01) | benign(0.224) | TCGA-EA-A6QX-01 | Cervix | cervical & endocervical cancer | Female | <65 | III/IV | Unknown | Unknown | SD | |
| AKR1D1 | SNV | Missense_Mutation | c.257N>C | p.Gly86Ala | p.G86A | P51857 | protein_coding | tolerated(0.05) | possibly_damaging(0.603) | TCGA-IR-A3LK-01 | Cervix | cervical & endocervical cancer | Female | >=65 | I/II | Chemotherapy | cisplatin | PD | |
| AKR1D1 | SNV | Missense_Mutation | rs146935906 | c.944G>A | p.Arg315His | p.R315H | P51857 | protein_coding | tolerated(0.14) | benign(0.011) | TCGA-A6-5664-01 | Colorectum | colon adenocarcinoma | Male | >=65 | III/IV | Chemotherapy | fluorouracil | SD |
| AKR1D1 | SNV | Missense_Mutation | c.13G>A | p.Ala5Thr | p.A5T | P51857 | protein_coding | tolerated(0.15) | benign(0) | TCGA-A6-6653-01 | Colorectum | colon adenocarcinoma | Male | >=65 | I/II | Unknown | Unknown | SD | |
| AKR1D1 | SNV | Missense_Mutation | rs148732404 | c.92C>T | p.Ser31Leu | p.S31L | P51857 | protein_coding | tolerated(0.2) | benign(0.003) | TCGA-CA-6717-01 | Colorectum | colon adenocarcinoma | Male | <65 | I/II | Chemotherapy | oxaliplatin | CR |
| AKR1D1 | SNV | Missense_Mutation | rs201752860 | c.149N>A | p.Arg50Gln | p.R50Q | P51857 | protein_coding | deleterious(0.03) | probably_damaging(0.991) | TCGA-G4-6586-01 | Colorectum | colon adenocarcinoma | Female | >=65 | I/II | Unknown | Unknown | SD |
| AKR1D1 | SNV | Missense_Mutation | rs148732404 | c.92C>T | p.Ser31Leu | p.S31L | P51857 | protein_coding | tolerated(0.2) | benign(0.003) | TCGA-F5-6814-01 | Colorectum | rectum adenocarcinoma | Male | <65 | I/II | Unknown | Unknown | SD |
| Page: 1 2 3 4 5 6 |
Top |
Related drugs of malignant transformation related genes |
| Identification of chemicals and drugs interact with genes involved in malignant transfromation |
| (DGIdb 4.0) |
| Entrez ID | Symbol | Category | Interaction Types | Drug Claim Name | Drug Name | PMIDs |
| 6718 | AKR1D1 | DRUGGABLE GENOME, ENZYME | cholic acid | |||
| 6718 | AKR1D1 | DRUGGABLE GENOME, ENZYME | FINASTERIDE | FINASTERIDE |
| Page: 1 |

Copyright 2023-Present -The University of Texas Health Science Center at Houston |