
|
|||||
|
 | |
| |
| |
| |
| |
| |
|
Gene: AKR1C4 |
Gene summary for AKR1C4 |
| Gene information | Species | Human | Gene symbol | AKR1C4 | Gene ID | 1109 |
| Gene name | aldo-keto reductase family 1 member C4 | |
| Gene Alias | 3-alpha-HSD | |
| Cytomap | 10p15.1 | |
| Gene Type | protein-coding | GO ID | GO:0001523 | UniProtAcc | P17516 |
Top |
Malignant transformation analysis |
| Identification of the aberrant gene expression in precancerous and cancerous lesions by comparing the gene expression of stem-like cells in diseased tissues with normal stem cells |
| Entrez ID | Symbol | Replicates | Species | Organ | Tissue | Adj P-value | Log2FC | Malignancy |
| 1109 | AKR1C4 | NAFLD1 | Human | Liver | NAFLD | 1.22e-07 | 5.80e-01 | -0.04 |
| 1109 | AKR1C4 | S43 | Human | Liver | Cirrhotic | 1.16e-04 | -6.87e-02 | -0.0187 |
| 1109 | AKR1C4 | HCC1_Meng | Human | Liver | HCC | 8.22e-102 | 1.43e+00 | 0.0246 |
| 1109 | AKR1C4 | HCC2_Meng | Human | Liver | HCC | 1.29e-03 | -1.65e-01 | 0.0107 |
| 1109 | AKR1C4 | cirrhotic2 | Human | Liver | Cirrhotic | 2.48e-04 | -1.59e-01 | 0.0201 |
| 1109 | AKR1C4 | HCC1 | Human | Liver | HCC | 7.39e-05 | 4.13e+00 | 0.5336 |
| 1109 | AKR1C4 | HCC2 | Human | Liver | HCC | 9.38e-39 | 5.18e+00 | 0.5341 |
| 1109 | AKR1C4 | Pt13.b | Human | Liver | HCC | 2.11e-08 | 1.51e-01 | 0.0251 |
| 1109 | AKR1C4 | Pt14.a | Human | Liver | HCC | 2.23e-04 | 3.46e-01 | 0.0169 |
| 1109 | AKR1C4 | Pt14.b | Human | Liver | HCC | 1.07e-20 | 7.41e-01 | 0.018 |
| 1109 | AKR1C4 | S014 | Human | Liver | HCC | 1.86e-06 | 6.61e-01 | 0.2254 |
| 1109 | AKR1C4 | S016 | Human | Liver | HCC | 2.21e-20 | 1.10e+00 | 0.2243 |
| 1109 | AKR1C4 | S027 | Human | Liver | HCC | 9.64e-13 | 1.94e+00 | 0.2446 |
| 1109 | AKR1C4 | S028 | Human | Liver | HCC | 3.37e-32 | 2.00e+00 | 0.2503 |
| 1109 | AKR1C4 | S029 | Human | Liver | HCC | 2.40e-38 | 2.55e+00 | 0.2581 |
| Page: 1 |
| Tissue | Expression Dynamics | Abbreviation |
| Liver | 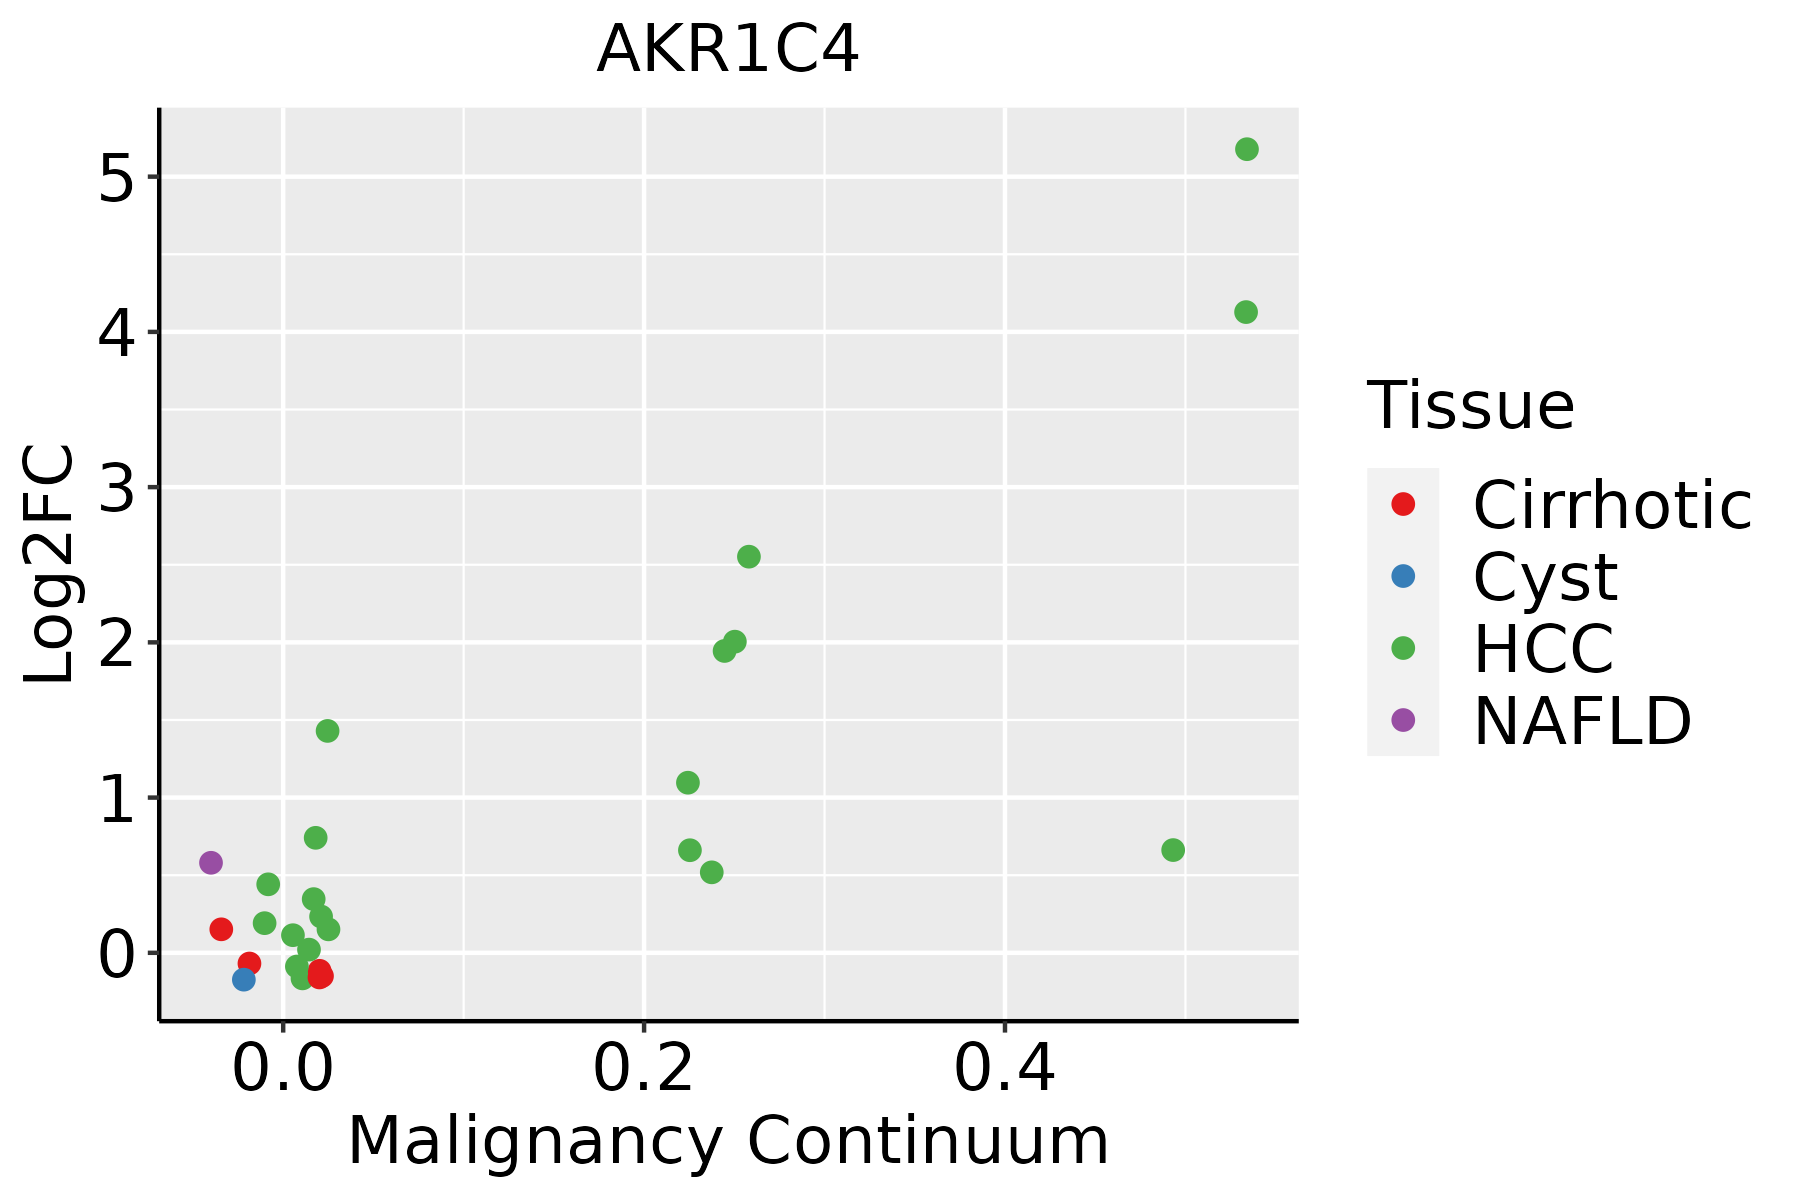 | HCC: Hepatocellular carcinoma |
| NAFLD: Non-alcoholic fatty liver disease |
| ∗log2FC in expression of this searched gene in stem-like cells from each diseased tissue sample relative to stem-like cells in normal samples in each tissue plotted against the malignancy continuum. Samples are colored based on if they are from different disease stage. |
Top |
Malignant transformation related pathway analysis |
| Find out the enriched GO biological processes and KEGG pathways involved in transition from healthy to precancer to cancer |
| Tissue | Disease Stage | Enriched GO biological Processes |
| Colorectum | AD |  |
| Colorectum | SER |  |
| Colorectum | MSS |  |
| Colorectum | MSI-H |  |
| Colorectum | FAP |  |
| ∗Top 15 enriched GO BP terms are showed in the bar plot of each disease state in each tissue. Each row represents a significant GO biological process which is colored according to the -log10(p.adjust). |
| Page: 1 2 3 4 5 6 7 8 9 |
| GO ID | Tissue | Disease Stage | Description | Gene Ratio | Bg Ratio | pvalue | p.adjust | Count |
| GO:00066316 | Liver | NAFLD | fatty acid metabolic process | 92/1882 | 390/18723 | 3.38e-15 | 3.29e-12 | 92 |
| GO:00160535 | Liver | NAFLD | organic acid biosynthetic process | 77/1882 | 316/18723 | 1.03e-13 | 6.69e-11 | 77 |
| GO:00463945 | Liver | NAFLD | carboxylic acid biosynthetic process | 75/1882 | 314/18723 | 6.37e-13 | 3.39e-10 | 75 |
| GO:00082023 | Liver | NAFLD | steroid metabolic process | 69/1882 | 319/18723 | 5.90e-10 | 1.28e-07 | 69 |
| GO:0008206 | Liver | NAFLD | bile acid metabolic process | 19/1882 | 49/18723 | 9.82e-08 | 7.76e-06 | 19 |
| GO:00108765 | Liver | NAFLD | lipid localization | 79/1882 | 448/18723 | 4.75e-07 | 2.92e-05 | 79 |
| GO:00723303 | Liver | NAFLD | monocarboxylic acid biosynthetic process | 46/1882 | 214/18723 | 5.06e-07 | 3.07e-05 | 46 |
| GO:00060917 | Liver | NAFLD | generation of precursor metabolites and energy | 84/1882 | 490/18723 | 7.03e-07 | 3.95e-05 | 84 |
| GO:00068694 | Liver | NAFLD | lipid transport | 71/1882 | 398/18723 | 1.16e-06 | 5.59e-05 | 71 |
| GO:0006699 | Liver | NAFLD | bile acid biosynthetic process | 14/1882 | 36/18723 | 4.59e-06 | 1.75e-04 | 14 |
| GO:00060666 | Liver | NAFLD | alcohol metabolic process | 62/1882 | 353/18723 | 9.01e-06 | 2.96e-04 | 62 |
| GO:0015850 | Liver | NAFLD | organic hydroxy compound transport | 50/1882 | 284/18723 | 6.01e-05 | 1.32e-03 | 50 |
| GO:00066943 | Liver | NAFLD | steroid biosynthetic process | 34/1882 | 173/18723 | 1.01e-04 | 2.02e-03 | 34 |
| GO:00705425 | Liver | NAFLD | response to fatty acid | 16/1882 | 64/18723 | 4.61e-04 | 6.74e-03 | 16 |
| GO:00335596 | Liver | NAFLD | unsaturated fatty acid metabolic process | 24/1882 | 116/18723 | 4.64e-04 | 6.74e-03 | 24 |
| GO:0015721 | Liver | NAFLD | bile acid and bile salt transport | 10/1882 | 30/18723 | 4.67e-04 | 6.74e-03 | 10 |
| GO:01202545 | Liver | NAFLD | olefinic compound metabolic process | 28/1882 | 153/18723 | 1.28e-03 | 1.45e-02 | 28 |
| GO:00424452 | Liver | NAFLD | hormone metabolic process | 36/1882 | 218/18723 | 1.98e-03 | 1.98e-02 | 36 |
| GO:00421803 | Liver | NAFLD | cellular ketone metabolic process | 35/1882 | 211/18723 | 2.09e-03 | 2.06e-02 | 35 |
| GO:00713986 | Liver | NAFLD | cellular response to fatty acid | 10/1882 | 38/18723 | 3.49e-03 | 3.00e-02 | 10 |
| Page: 1 2 3 4 |
| Pathway ID | Tissue | Disease Stage | Description | Gene Ratio | Bg Ratio | pvalue | p.adjust | qvalue | Count |
| hsa00120 | Liver | NAFLD | Primary bile acid biosynthesis | 9/1043 | 17/8465 | 6.10e-05 | 1.33e-03 | 1.07e-03 | 9 |
| hsa0520814 | Liver | NAFLD | Chemical carcinogenesis - reactive oxygen species | 44/1043 | 223/8465 | 9.22e-04 | 1.31e-02 | 1.06e-02 | 44 |
| hsa001201 | Liver | NAFLD | Primary bile acid biosynthesis | 9/1043 | 17/8465 | 6.10e-05 | 1.33e-03 | 1.07e-03 | 9 |
| hsa0520815 | Liver | NAFLD | Chemical carcinogenesis - reactive oxygen species | 44/1043 | 223/8465 | 9.22e-04 | 1.31e-02 | 1.06e-02 | 44 |
| hsa0520822 | Liver | Cirrhotic | Chemical carcinogenesis - reactive oxygen species | 121/2530 | 223/8465 | 1.35e-14 | 4.08e-13 | 2.52e-13 | 121 |
| hsa0520832 | Liver | Cirrhotic | Chemical carcinogenesis - reactive oxygen species | 121/2530 | 223/8465 | 1.35e-14 | 4.08e-13 | 2.52e-13 | 121 |
| hsa0520842 | Liver | HCC | Chemical carcinogenesis - reactive oxygen species | 167/4020 | 223/8465 | 2.85e-17 | 1.91e-15 | 1.06e-15 | 167 |
| hsa001202 | Liver | HCC | Primary bile acid biosynthesis | 14/4020 | 17/8465 | 3.49e-03 | 1.12e-02 | 6.22e-03 | 14 |
| hsa0520852 | Liver | HCC | Chemical carcinogenesis - reactive oxygen species | 167/4020 | 223/8465 | 2.85e-17 | 1.91e-15 | 1.06e-15 | 167 |
| hsa001203 | Liver | HCC | Primary bile acid biosynthesis | 14/4020 | 17/8465 | 3.49e-03 | 1.12e-02 | 6.22e-03 | 14 |
| Page: 1 |
Top |
Cell-cell communication analysis |
| Identification of potential cell-cell interactions between two cell types and their ligand-receptor pairs for different disease states |
| Ligand | Receptor | LRpair | Pathway | Tissue | Disease Stage |
| Page: 1 |
Top |
Single-cell gene regulatory network inference analysis |
| Find out the significant the regulons (TFs) and the target genes of each regulon across cell types for different disease states |
| TF | Cell Type | Tissue | Disease Stage | Target Gene | RSS | Regulon Activity |
| ∗The dot plots of a searched regulon are shown for all cell subpopulations in each disease state of each tissue based on the regulon specific score inferred using pySCENIC and by calculating the average expression. |
| Page: 1 |
Top |
Somatic mutation of malignant transformation related genes |
| Annotation of somatic variants for genes involved in malignant transformation |
| Hugo Symbol | Variant Class | Variant Classification | dbSNP RS | HGVSc | HGVSp | HGVSp Short | SWISSPROT | BIOTYPE | SIFT | PolyPhen | Tumor Sample Barcode | Tissue | Histology | Sex | Age | Stage | Therapy Types | Drugs | Outcome |
| AKR1C4 | SNV | Missense_Mutation | rs201966709 | c.462N>G | p.Cys154Trp | p.C154W | P17516 | protein_coding | deleterious(0) | probably_damaging(0.999) | TCGA-A2-A0YJ-01 | Breast | breast invasive carcinoma | Female | <65 | III/IV | Chemotherapy | cytoxan | PD |
| AKR1C4 | SNV | Missense_Mutation | rs781957701 | c.473G>C | p.Gly158Ala | p.G158A | P17516 | protein_coding | deleterious(0.01) | probably_damaging(0.99) | TCGA-A8-A07R-01 | Breast | breast invasive carcinoma | Female | >=65 | III/IV | Ancillary | zoledronic | SD |
| AKR1C4 | SNV | Missense_Mutation | c.721N>A | p.Leu241Ile | p.L241I | P17516 | protein_coding | tolerated(0.09) | possibly_damaging(0.506) | TCGA-AN-A046-01 | Breast | breast invasive carcinoma | Female | >=65 | I/II | Unknown | Unknown | SD | |
| AKR1C4 | SNV | Missense_Mutation | rs201966709 | c.462N>G | p.Cys154Trp | p.C154W | P17516 | protein_coding | deleterious(0) | probably_damaging(0.999) | TCGA-BH-A0C7-01 | Breast | breast invasive carcinoma | Female | <65 | I/II | Chemotherapy | adriamycin | CR |
| AKR1C4 | SNV | Missense_Mutation | rs201966709 | c.462N>G | p.Cys154Trp | p.C154W | P17516 | protein_coding | deleterious(0) | probably_damaging(0.999) | TCGA-BH-A0DE-01 | Breast | breast invasive carcinoma | Female | <65 | I/II | Unknown | Unknown | SD |
| AKR1C4 | SNV | Missense_Mutation | rs782129542 | c.668G>A | p.Arg223Gln | p.R223Q | P17516 | protein_coding | deleterious(0.01) | possibly_damaging(0.775) | TCGA-BH-A1FG-01 | Breast | breast invasive carcinoma | Female | >=65 | I/II | Unknown | Unknown | SD |
| AKR1C4 | SNV | Missense_Mutation | c.394N>C | p.Asp132His | p.D132H | P17516 | protein_coding | deleterious(0.01) | possibly_damaging(0.519) | TCGA-BH-A209-01 | Breast | breast invasive carcinoma | Female | >=65 | I/II | Unknown | Unknown | SD | |
| AKR1C4 | SNV | Missense_Mutation | c.240N>A | p.Phe80Leu | p.F80L | P17516 | protein_coding | deleterious(0) | probably_damaging(0.996) | TCGA-FU-A3HZ-01 | Cervix | cervical & endocervical cancer | Female | <65 | I/II | Chemotherapy | cisplatin | CR | |
| AKR1C4 | SNV | Missense_Mutation | rs529198618 | c.826N>T | p.Arg276Trp | p.R276W | P17516 | protein_coding | deleterious(0.04) | possibly_damaging(0.651) | TCGA-AA-3984-01 | Colorectum | colon adenocarcinoma | Female | <65 | I/II | Unknown | Unknown | SD |
| AKR1C4 | SNV | Missense_Mutation | rs531165422 | c.380N>T | p.Thr127Met | p.T127M | P17516 | protein_coding | deleterious(0) | benign(0.436) | TCGA-AA-A00O-01 | Colorectum | colon adenocarcinoma | Female | >=65 | III/IV | Unknown | Unknown | SD |
| Page: 1 2 3 4 5 |
Top |
Related drugs of malignant transformation related genes |
| Identification of chemicals and drugs interact with genes involved in malignant transfromation |
| (DGIdb 4.0) |
| Entrez ID | Symbol | Category | Interaction Types | Drug Claim Name | Drug Name | PMIDs |
| 1109 | AKR1C4 | DRUGGABLE GENOME, ENZYME | daunorubicin | DAUNORUBICIN | 20837989 | |
| 1109 | AKR1C4 | DRUGGABLE GENOME, ENZYME | exemestane | EXEMESTANE | 27111237 |
| Page: 1 |

Copyright 2023-Present -The University of Texas Health Science Center at Houston |