
|
|||||
|
 | |
| |
| |
| |
| |
| |
|
Gene: AKR1C3 |
Gene summary for AKR1C3 |
| Gene information | Species | Human | Gene symbol | AKR1C3 | Gene ID | 8644 |
| Gene name | aldo-keto reductase family 1 member C3 | |
| Gene Alias | DD3 | |
| Cytomap | 10p15.1 | |
| Gene Type | protein-coding | GO ID | GO:0000003 | UniProtAcc | A0A0A0MSS8 |
Top |
Malignant transformation analysis |
| Identification of the aberrant gene expression in precancerous and cancerous lesions by comparing the gene expression of stem-like cells in diseased tissues with normal stem cells |
| Entrez ID | Symbol | Replicates | Species | Organ | Tissue | Adj P-value | Log2FC | Malignancy |
| 8644 | AKR1C3 | GSM4909281 | Human | Breast | IDC | 1.08e-15 | -5.66e-01 | 0.21 |
| 8644 | AKR1C3 | GSM4909282 | Human | Breast | IDC | 1.21e-06 | -4.80e-01 | -0.0288 |
| 8644 | AKR1C3 | GSM4909285 | Human | Breast | IDC | 1.55e-11 | -2.14e-01 | 0.21 |
| 8644 | AKR1C3 | GSM4909286 | Human | Breast | IDC | 1.08e-15 | -5.66e-01 | 0.1081 |
| 8644 | AKR1C3 | GSM4909287 | Human | Breast | IDC | 3.37e-02 | -3.44e-01 | 0.2057 |
| 8644 | AKR1C3 | GSM4909289 | Human | Breast | IDC | 2.83e-02 | -5.66e-01 | 0.1064 |
| 8644 | AKR1C3 | GSM4909290 | Human | Breast | IDC | 6.00e-04 | -3.42e-01 | 0.2096 |
| 8644 | AKR1C3 | GSM4909291 | Human | Breast | IDC | 7.58e-10 | -5.66e-01 | 0.1753 |
| 8644 | AKR1C3 | GSM4909293 | Human | Breast | IDC | 2.47e-12 | -5.60e-01 | 0.1581 |
| 8644 | AKR1C3 | GSM4909294 | Human | Breast | IDC | 2.04e-13 | -5.39e-01 | 0.2022 |
| 8644 | AKR1C3 | GSM4909295 | Human | Breast | IDC | 1.34e-07 | -5.66e-01 | 0.0898 |
| 8644 | AKR1C3 | GSM4909296 | Human | Breast | IDC | 1.08e-15 | -5.61e-01 | 0.1524 |
| 8644 | AKR1C3 | GSM4909297 | Human | Breast | IDC | 5.65e-11 | -5.57e-01 | 0.1517 |
| 8644 | AKR1C3 | GSM4909298 | Human | Breast | IDC | 1.34e-08 | -5.03e-01 | 0.1551 |
| 8644 | AKR1C3 | GSM4909299 | Human | Breast | IDC | 1.07e-04 | -4.25e-01 | 0.035 |
| 8644 | AKR1C3 | GSM4909301 | Human | Breast | IDC | 2.06e-14 | -5.64e-01 | 0.1577 |
| 8644 | AKR1C3 | GSM4909302 | Human | Breast | IDC | 1.91e-14 | -5.57e-01 | 0.1545 |
| 8644 | AKR1C3 | GSM4909304 | Human | Breast | IDC | 4.79e-11 | -5.49e-01 | 0.1636 |
| 8644 | AKR1C3 | GSM4909305 | Human | Breast | IDC | 1.05e-03 | -4.39e-01 | 0.0436 |
| 8644 | AKR1C3 | GSM4909306 | Human | Breast | IDC | 1.82e-10 | -5.33e-01 | 0.1564 |
| Page: 1 2 3 4 5 6 7 8 9 10 |
| Tissue | Expression Dynamics | Abbreviation |
| Breast |  | IDC: Invasive ductal carcinoma |
| DCIS: Ductal carcinoma in situ | ||
| Precancer(BRCA1-mut): Precancerous lesion from BRCA1 mutation carriers | ||
| Colorectum (GSE201348) |  | FAP: Familial adenomatous polyposis |
| CRC: Colorectal cancer | ||
| Colorectum (HTA11) |  | AD: Adenomas |
| SER: Sessile serrated lesions | ||
| MSI-H: Microsatellite-high colorectal cancer | ||
| MSS: Microsatellite stable colorectal cancer | ||
| Esophagus | 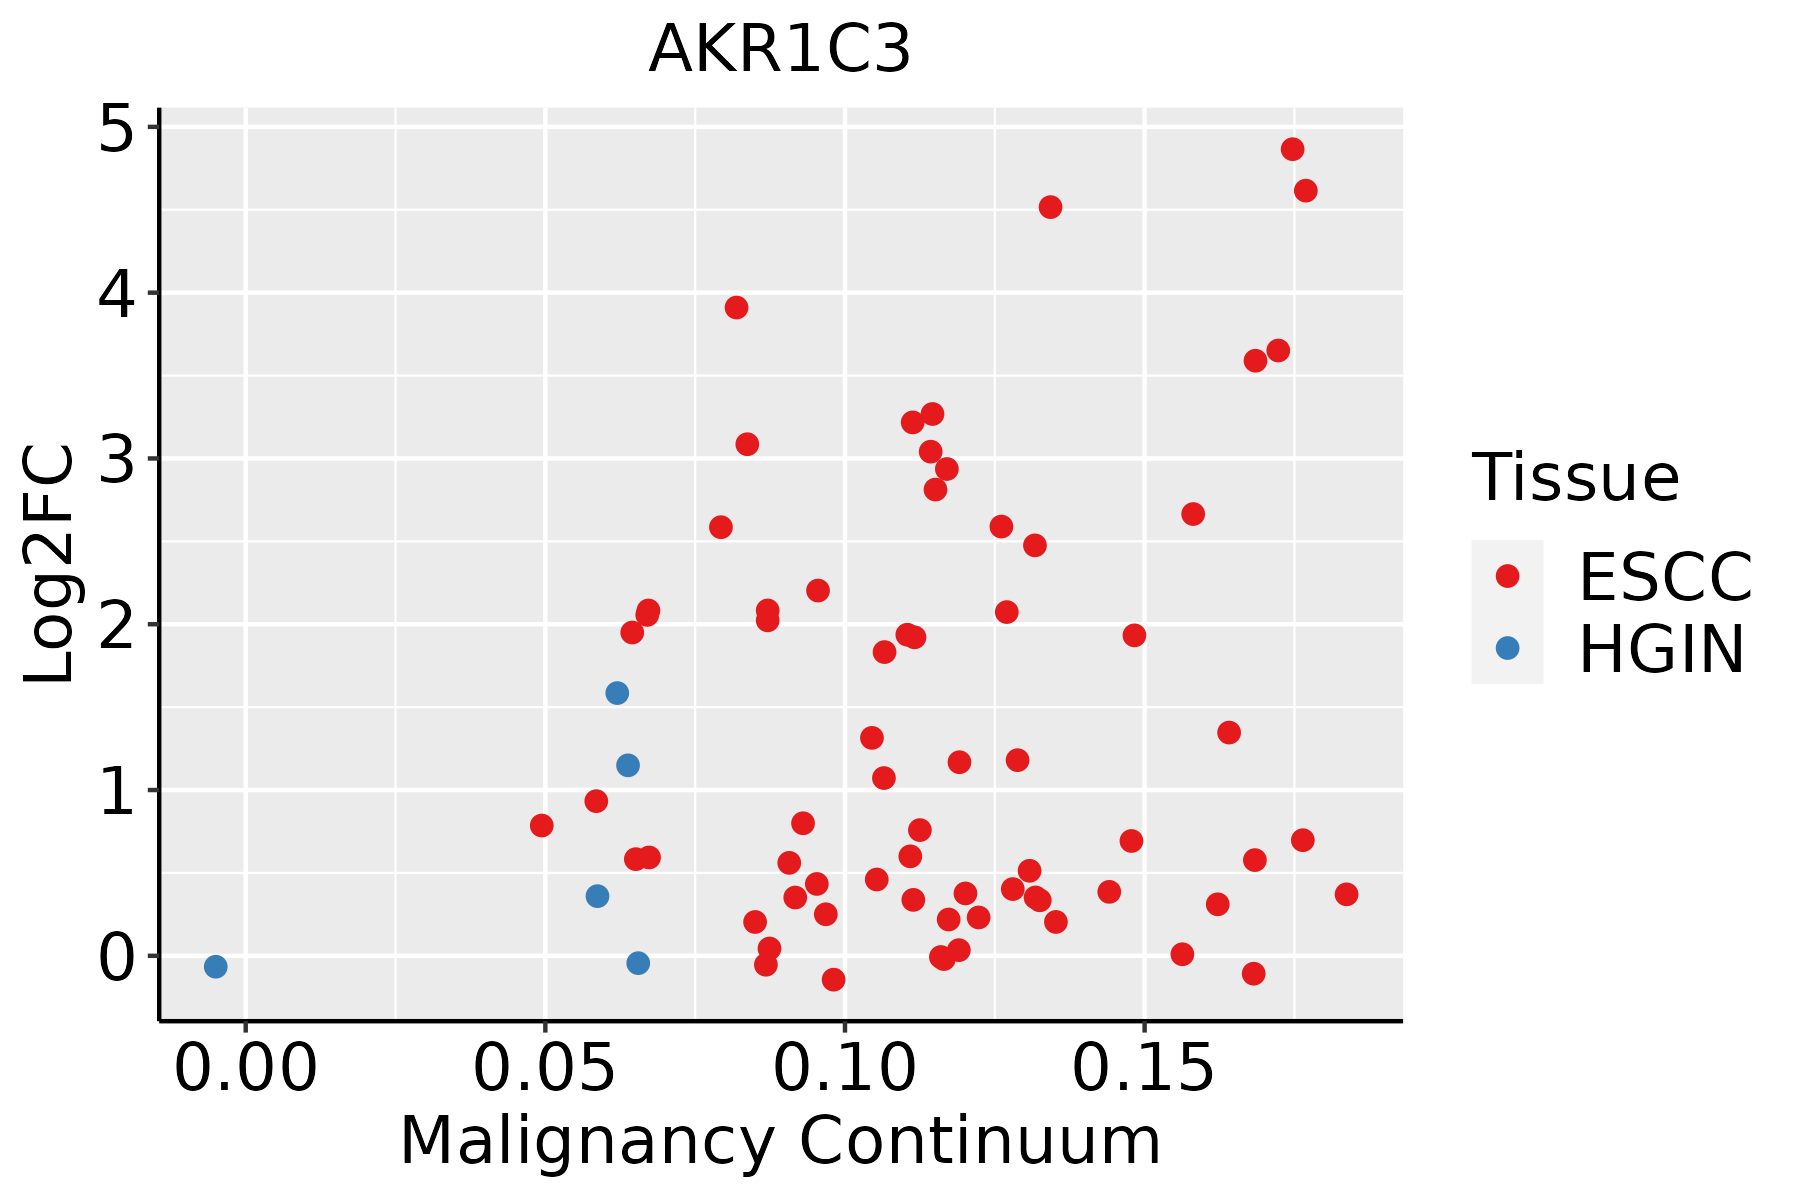 | ESCC: Esophageal squamous cell carcinoma |
| HGIN: High-grade intraepithelial neoplasias | ||
| LGIN: Low-grade intraepithelial neoplasias | ||
| GC |  | CAG: Chronic atrophic gastritis |
| CAG with IM: Chronic atrophic gastritis with intestinal metaplasia | ||
| CSG: Chronic superficial gastritis | ||
| GC: Gastric cancer | ||
| SIM: Severe intestinal metaplasia | ||
| WIM: Wild intestinal metaplasia | ||
| Liver |  | HCC: Hepatocellular carcinoma |
| NAFLD: Non-alcoholic fatty liver disease | ||
| Oral Cavity | 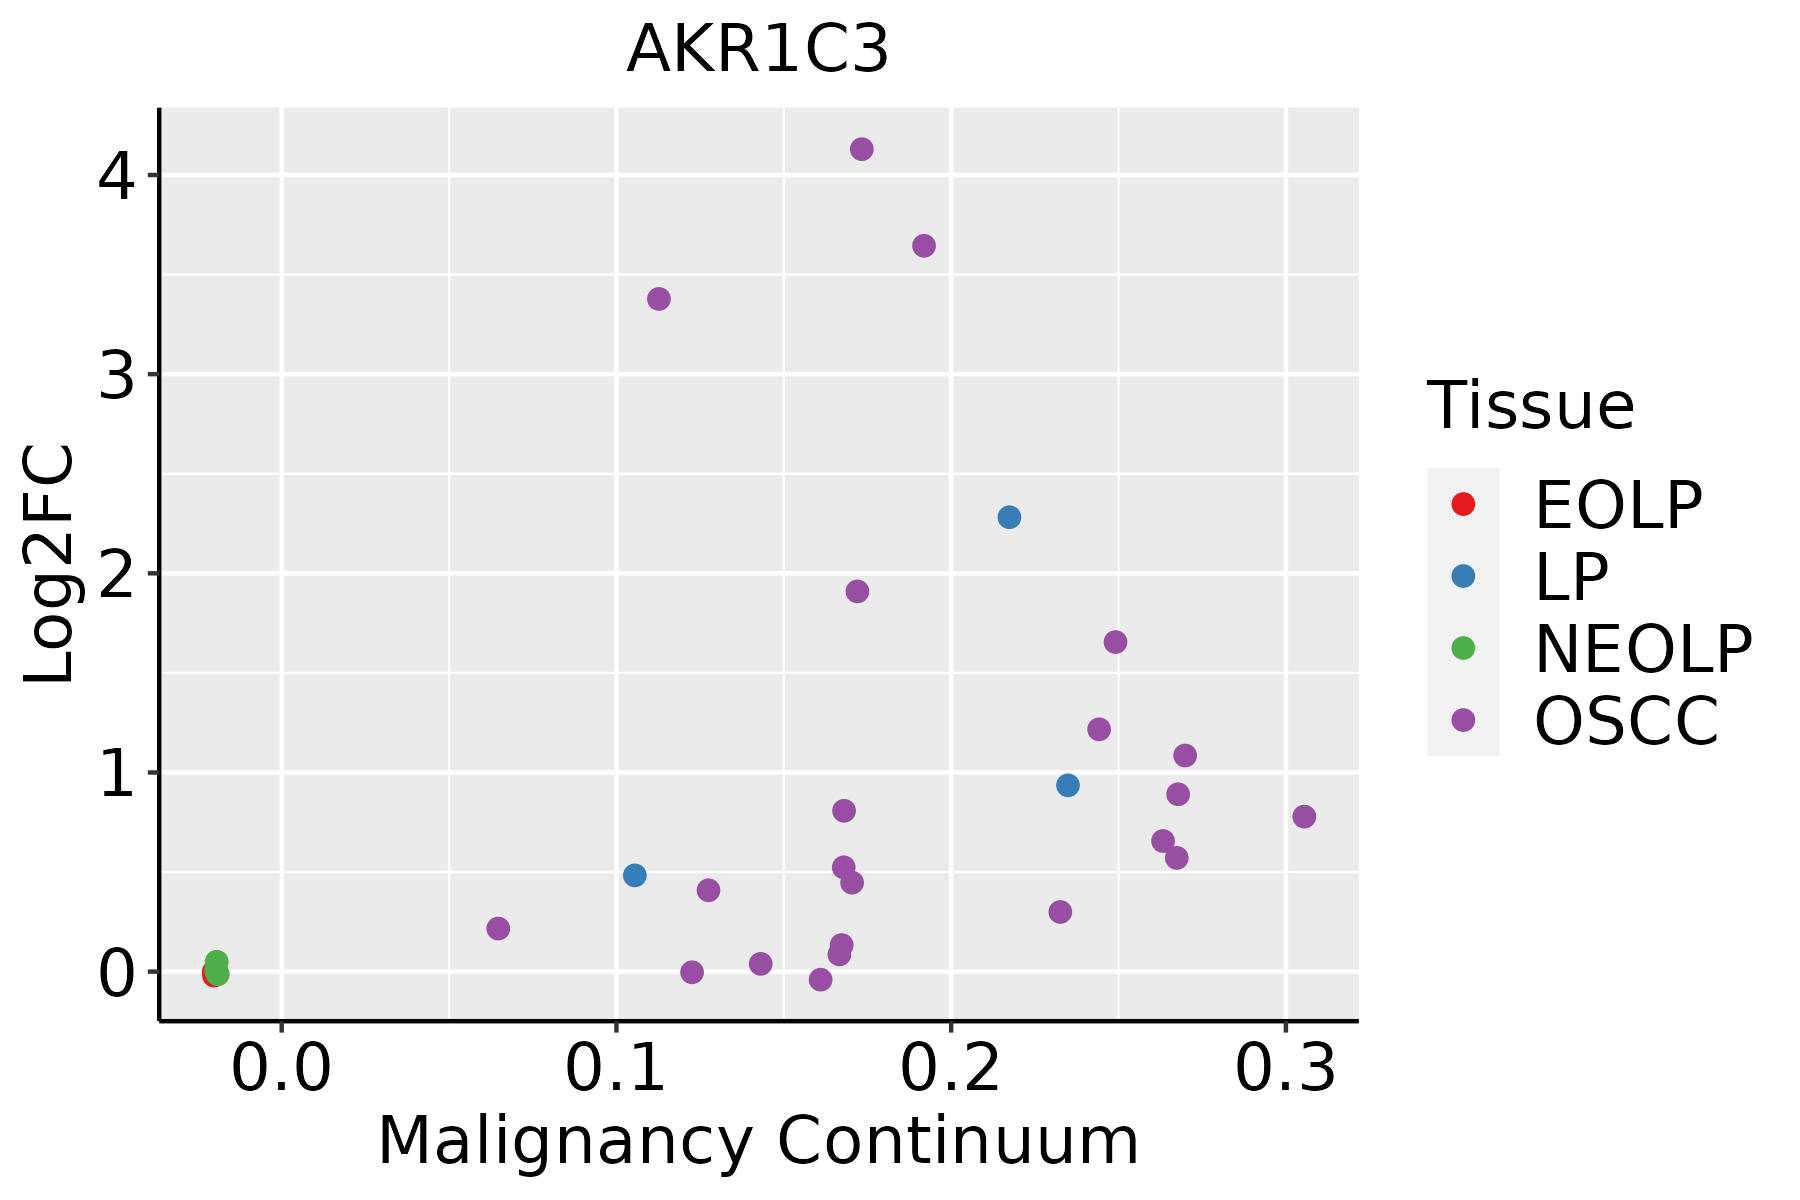 | EOLP: Erosive Oral lichen planus |
| LP: leukoplakia | ||
| NEOLP: Non-erosive oral lichen planus | ||
| OSCC: Oral squamous cell carcinoma | ||
| Skin |  | AK: Actinic keratosis |
| cSCC: Cutaneous squamous cell carcinoma | ||
| SCCIS:squamous cell carcinoma in situ | ||
| Thyroid | 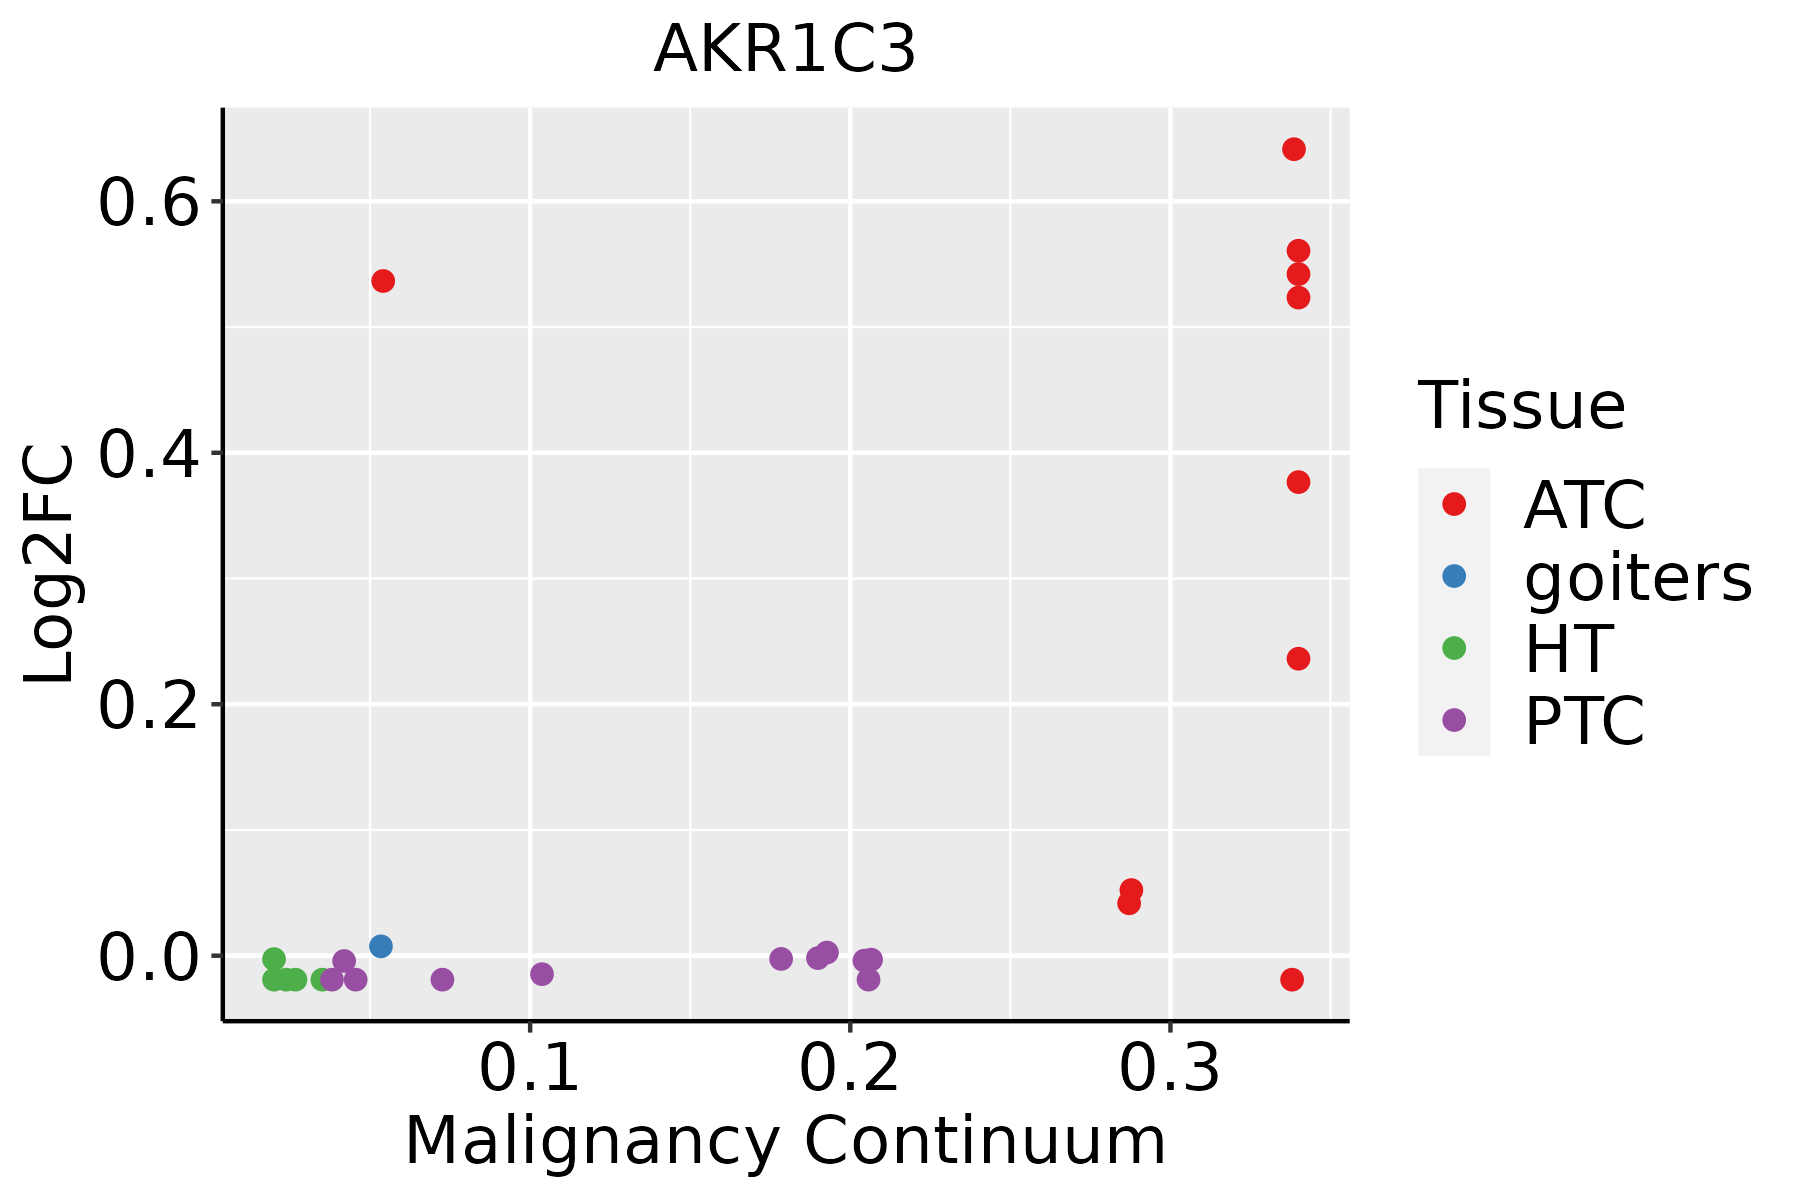 | ATC: Anaplastic thyroid cancer |
| HT: Hashimoto's thyroiditis | ||
| PTC: Papillary thyroid cancer |
| ∗log2FC in expression of this searched gene in stem-like cells from each diseased tissue sample relative to stem-like cells in normal samples in each tissue plotted against the malignancy continuum. Samples are colored based on if they are from different disease stage. |
Top |
Malignant transformation related pathway analysis |
| Find out the enriched GO biological processes and KEGG pathways involved in transition from healthy to precancer to cancer |
| Tissue | Disease Stage | Enriched GO biological Processes |
| Colorectum | AD |  |
| Colorectum | SER |  |
| Colorectum | MSS |  |
| Colorectum | MSI-H |  |
| Colorectum | FAP |  |
| ∗Top 15 enriched GO BP terms are showed in the bar plot of each disease state in each tissue. Each row represents a significant GO biological process which is colored according to the -log10(p.adjust). |
| Page: 1 2 3 4 5 6 7 8 9 |
| GO ID | Tissue | Disease Stage | Description | Gene Ratio | Bg Ratio | pvalue | p.adjust | Count |
| GO:00069799 | Breast | Precancer | response to oxidative stress | 70/1080 | 446/18723 | 1.59e-14 | 4.26e-12 | 70 |
| GO:00485459 | Breast | Precancer | response to steroid hormone | 53/1080 | 339/18723 | 3.07e-11 | 3.66e-09 | 53 |
| GO:00621979 | Breast | Precancer | cellular response to chemical stress | 51/1080 | 337/18723 | 2.40e-10 | 2.34e-08 | 51 |
| GO:00003029 | Breast | Precancer | response to reactive oxygen species | 38/1080 | 222/18723 | 1.47e-09 | 1.23e-07 | 38 |
| GO:00319608 | Breast | Precancer | response to corticosteroid | 30/1080 | 167/18723 | 2.50e-08 | 1.65e-06 | 30 |
| GO:00345999 | Breast | Precancer | cellular response to oxidative stress | 42/1080 | 288/18723 | 2.78e-08 | 1.79e-06 | 42 |
| GO:00100389 | Breast | Precancer | response to metal ion | 47/1080 | 373/18723 | 3.88e-07 | 1.79e-05 | 47 |
| GO:00713838 | Breast | Precancer | cellular response to steroid hormone stimulus | 28/1080 | 204/18723 | 1.78e-05 | 4.26e-04 | 28 |
| GO:00466868 | Breast | Precancer | response to cadmium ion | 14/1080 | 68/18723 | 2.74e-05 | 6.21e-04 | 14 |
| GO:00346149 | Breast | Precancer | cellular response to reactive oxygen species | 23/1080 | 155/18723 | 2.82e-05 | 6.31e-04 | 23 |
| GO:00725938 | Breast | Precancer | reactive oxygen species metabolic process | 30/1080 | 239/18723 | 5.13e-05 | 1.07e-03 | 30 |
| GO:00316679 | Breast | Precancer | response to nutrient levels | 47/1080 | 474/18723 | 2.09e-04 | 3.27e-03 | 47 |
| GO:00486087 | Breast | Precancer | reproductive structure development | 43/1080 | 424/18723 | 2.36e-04 | 3.56e-03 | 43 |
| GO:00702933 | Breast | Precancer | renal absorption | 6/1080 | 17/18723 | 2.59e-04 | 3.83e-03 | 6 |
| GO:00085445 | Breast | Precancer | epidermis development | 35/1080 | 324/18723 | 2.71e-04 | 3.96e-03 | 35 |
| GO:00614587 | Breast | Precancer | reproductive system development | 43/1080 | 427/18723 | 2.75e-04 | 4.00e-03 | 43 |
| GO:00712767 | Breast | Precancer | cellular response to cadmium ion | 9/1080 | 40/18723 | 3.69e-04 | 5.03e-03 | 9 |
| GO:00712488 | Breast | Precancer | cellular response to metal ion | 24/1080 | 197/18723 | 4.35e-04 | 5.79e-03 | 24 |
| GO:19040193 | Breast | Precancer | epithelial cell apoptotic process | 17/1080 | 121/18723 | 5.76e-04 | 7.28e-03 | 17 |
| GO:00712418 | Breast | Precancer | cellular response to inorganic substance | 26/1080 | 226/18723 | 6.23e-04 | 7.78e-03 | 26 |
| Page: 1 2 3 4 5 6 7 8 9 10 11 12 13 14 15 16 17 18 19 20 21 22 23 24 25 26 27 28 29 30 31 32 33 34 35 36 37 38 39 40 41 42 43 44 45 46 47 48 49 |
| Pathway ID | Tissue | Disease Stage | Description | Gene Ratio | Bg Ratio | pvalue | p.adjust | qvalue | Count |
| hsa0520818 | Breast | Precancer | Chemical carcinogenesis - reactive oxygen species | 68/684 | 223/8465 | 3.61e-23 | 1.14e-21 | 8.73e-22 | 68 |
| hsa0520819 | Breast | Precancer | Chemical carcinogenesis - reactive oxygen species | 68/684 | 223/8465 | 3.61e-23 | 1.14e-21 | 8.73e-22 | 68 |
| hsa05208 | Colorectum | AD | Chemical carcinogenesis - reactive oxygen species | 126/2092 | 223/8465 | 1.01e-24 | 1.68e-22 | 1.07e-22 | 126 |
| hsa052081 | Colorectum | AD | Chemical carcinogenesis - reactive oxygen species | 126/2092 | 223/8465 | 1.01e-24 | 1.68e-22 | 1.07e-22 | 126 |
| hsa052082 | Colorectum | SER | Chemical carcinogenesis - reactive oxygen species | 103/1580 | 223/8465 | 1.60e-21 | 7.57e-20 | 5.50e-20 | 103 |
| hsa052083 | Colorectum | SER | Chemical carcinogenesis - reactive oxygen species | 103/1580 | 223/8465 | 1.60e-21 | 7.57e-20 | 5.50e-20 | 103 |
| hsa052084 | Colorectum | MSS | Chemical carcinogenesis - reactive oxygen species | 118/1875 | 223/8465 | 2.71e-24 | 4.54e-22 | 2.78e-22 | 118 |
| hsa052085 | Colorectum | MSS | Chemical carcinogenesis - reactive oxygen species | 118/1875 | 223/8465 | 2.71e-24 | 4.54e-22 | 2.78e-22 | 118 |
| hsa052086 | Colorectum | MSI-H | Chemical carcinogenesis - reactive oxygen species | 65/797 | 223/8465 | 1.78e-17 | 6.41e-16 | 5.37e-16 | 65 |
| hsa052087 | Colorectum | MSI-H | Chemical carcinogenesis - reactive oxygen species | 65/797 | 223/8465 | 1.78e-17 | 6.41e-16 | 5.37e-16 | 65 |
| hsa052088 | Colorectum | FAP | Chemical carcinogenesis - reactive oxygen species | 78/1404 | 223/8465 | 1.08e-11 | 1.80e-09 | 1.09e-09 | 78 |
| hsa052089 | Colorectum | FAP | Chemical carcinogenesis - reactive oxygen species | 78/1404 | 223/8465 | 1.08e-11 | 1.80e-09 | 1.09e-09 | 78 |
| hsa0520839 | Esophagus | HGIN | Chemical carcinogenesis - reactive oxygen species | 92/1383 | 223/8465 | 2.41e-19 | 9.83e-18 | 7.80e-18 | 92 |
| hsa05208115 | Esophagus | HGIN | Chemical carcinogenesis - reactive oxygen species | 92/1383 | 223/8465 | 2.41e-19 | 9.83e-18 | 7.80e-18 | 92 |
| hsa05208211 | Esophagus | ESCC | Chemical carcinogenesis - reactive oxygen species | 168/4205 | 223/8465 | 1.83e-15 | 6.81e-14 | 3.49e-14 | 168 |
| hsa05208310 | Esophagus | ESCC | Chemical carcinogenesis - reactive oxygen species | 168/4205 | 223/8465 | 1.83e-15 | 6.81e-14 | 3.49e-14 | 168 |
| hsa0520822 | Liver | Cirrhotic | Chemical carcinogenesis - reactive oxygen species | 121/2530 | 223/8465 | 1.35e-14 | 4.08e-13 | 2.52e-13 | 121 |
| hsa0520832 | Liver | Cirrhotic | Chemical carcinogenesis - reactive oxygen species | 121/2530 | 223/8465 | 1.35e-14 | 4.08e-13 | 2.52e-13 | 121 |
| hsa0520842 | Liver | HCC | Chemical carcinogenesis - reactive oxygen species | 167/4020 | 223/8465 | 2.85e-17 | 1.91e-15 | 1.06e-15 | 167 |
| hsa0520852 | Liver | HCC | Chemical carcinogenesis - reactive oxygen species | 167/4020 | 223/8465 | 2.85e-17 | 1.91e-15 | 1.06e-15 | 167 |
| Page: 1 2 |
Top |
Cell-cell communication analysis |
| Identification of potential cell-cell interactions between two cell types and their ligand-receptor pairs for different disease states |
| Ligand | Receptor | LRpair | Pathway | Tissue | Disease Stage |
| Page: 1 |
Top |
Single-cell gene regulatory network inference analysis |
| Find out the significant the regulons (TFs) and the target genes of each regulon across cell types for different disease states |
| TF | Cell Type | Tissue | Disease Stage | Target Gene | RSS | Regulon Activity |
| ∗The dot plots of a searched regulon are shown for all cell subpopulations in each disease state of each tissue based on the regulon specific score inferred using pySCENIC and by calculating the average expression. |
| Page: 1 |
Top |
Somatic mutation of malignant transformation related genes |
| Annotation of somatic variants for genes involved in malignant transformation |
| Hugo Symbol | Variant Class | Variant Classification | dbSNP RS | HGVSc | HGVSp | HGVSp Short | SWISSPROT | BIOTYPE | SIFT | PolyPhen | Tumor Sample Barcode | Tissue | Histology | Sex | Age | Stage | Therapy Types | Drugs | Outcome |
| AKR1C3 | SNV | Missense_Mutation | c.461G>T | p.Cys154Phe | p.C154F | P42330 | protein_coding | deleterious(0) | probably_damaging(0.993) | TCGA-AR-A0TS-01 | Breast | breast invasive carcinoma | Female | <65 | I/II | Chemotherapy | doxorubicin | SD | |
| AKR1C3 | SNV | Missense_Mutation | rs201818208 | c.462T>G | p.Cys154Trp | p.C154W | P42330 | protein_coding | deleterious(0) | probably_damaging(0.999) | TCGA-B6-A0WS-01 | Breast | breast invasive carcinoma | Female | <65 | I/II | Unknown | Unknown | SD |
| AKR1C3 | SNV | Missense_Mutation | rs201818208 | c.462N>G | p.Cys154Trp | p.C154W | P42330 | protein_coding | deleterious(0) | probably_damaging(0.999) | TCGA-BH-A0C7-01 | Breast | breast invasive carcinoma | Female | <65 | I/II | Chemotherapy | adriamycin | CR |
| AKR1C3 | SNV | Missense_Mutation | rs201818208 | c.462N>G | p.Cys154Trp | p.C154W | P42330 | protein_coding | deleterious(0) | probably_damaging(0.999) | TCGA-BH-A0DE-01 | Breast | breast invasive carcinoma | Female | <65 | I/II | Unknown | Unknown | SD |
| AKR1C3 | insertion | Nonsense_Mutation | novel | c.58_59insCACTTCAGTTATATCGTTCAGCTCCAAAATTTGTTT | p.Gly20delinsAlaLeuGlnLeuTyrArgSerAlaProLysPheValTer | p.G20delinsALQLYRSAPKFV* | P42330 | protein_coding | TCGA-A8-A07G-01 | Breast | breast invasive carcinoma | Female | >=65 | I/II | Chemotherapy | 5-fluorouracil | CR | ||
| AKR1C3 | insertion | Frame_Shift_Ins | novel | c.220_221insGAGAC | p.Val74GlyfsTer3 | p.V74Gfs*3 | P42330 | protein_coding | TCGA-BH-A0HF-01 | Breast | breast invasive carcinoma | Female | >=65 | I/II | Hormone Therapy | arimidex | SD | ||
| AKR1C3 | SNV | Missense_Mutation | novel | c.41A>G | p.His14Arg | p.H14R | protein_coding | tolerated(0.06) | benign(0.013) | TCGA-AA-3877-01 | Colorectum | colon adenocarcinoma | Female | >=65 | I/II | Unknown | Unknown | SD | |
| AKR1C3 | SNV | Missense_Mutation | novel | c.25N>C | p.Lys9Gln | p.K9Q | P42330 | protein_coding | tolerated(0.1) | benign(0.003) | TCGA-CA-6717-01 | Colorectum | colon adenocarcinoma | Male | <65 | I/II | Chemotherapy | oxaliplatin | CR |
| AKR1C3 | SNV | Missense_Mutation | rs782497370 | c.272G>A | p.Arg91Gln | p.R91Q | P42330 | protein_coding | tolerated(0.19) | benign(0.027) | TCGA-QG-A5Z2-01 | Colorectum | colon adenocarcinoma | Male | <65 | I/II | Unknown | Unknown | SD |
| AKR1C3 | SNV | Missense_Mutation | c.245N>A | p.Thr82Asn | p.T82N | P42330 | protein_coding | deleterious(0.01) | possibly_damaging(0.698) | TCGA-AG-A011-01 | Colorectum | rectum adenocarcinoma | Male | >=65 | I/II | Unknown | Unknown | SD |
| Page: 1 2 3 4 |
Top |
Related drugs of malignant transformation related genes |
| Identification of chemicals and drugs interact with genes involved in malignant transfromation |
| (DGIdb 4.0) |
| Entrez ID | Symbol | Category | Interaction Types | Drug Claim Name | Drug Name | PMIDs |
| 8644 | AKR1C3 | ENZYME, DRUGGABLE GENOME | ASP-9521 | |||
| 8644 | AKR1C3 | ENZYME, DRUGGABLE GENOME | docetaxel | DOCETAXEL | 23116553 | |
| 8644 | AKR1C3 | ENZYME, DRUGGABLE GENOME | INDOMETHACIN | INDOMETHACIN | 23432095 | |
| 8644 | AKR1C3 | ENZYME, DRUGGABLE GENOME | ANDROGENS | 10998348 | ||
| 8644 | AKR1C3 | ENZYME, DRUGGABLE GENOME | TESTOSTERONE | TESTOSTERONE | 10998348 | |
| 8644 | AKR1C3 | ENZYME, DRUGGABLE GENOME | Beta-naphthylacetic acids derivative 1 | |||
| 8644 | AKR1C3 | ENZYME, DRUGGABLE GENOME | N-(benzimidazolylcarbonyl)-piperidine derivative 1 | |||
| 8644 | AKR1C3 | ENZYME, DRUGGABLE GENOME | N-(naphthylamino)-benzoate derivative 1 | |||
| 8644 | AKR1C3 | ENZYME, DRUGGABLE GENOME | N-(benzimidazole/indole) benzoic acid derivative 2 | |||
| 8644 | AKR1C3 | ENZYME, DRUGGABLE GENOME | Nitrogen/sulfur-substituted estrene derivative 1 |
| Page: 1 2 3 4 |

Copyright 2023-Present -The University of Texas Health Science Center at Houston |