| Tissue | Expression Dynamics | Abbreviation |
| Cervix |  | CC: Cervix cancer |
| HSIL_HPV: HPV-infected high-grade squamous intraepithelial lesions |
| N_HPV: HPV-infected normal cervix |
| Esophagus |  | ESCC: Esophageal squamous cell carcinoma |
| HGIN: High-grade intraepithelial neoplasias |
| LGIN: Low-grade intraepithelial neoplasias |
| Liver |  | HCC: Hepatocellular carcinoma |
| NAFLD: Non-alcoholic fatty liver disease |
| Oral Cavity |  | EOLP: Erosive Oral lichen planus |
| LP: leukoplakia |
| NEOLP: Non-erosive oral lichen planus |
| OSCC: Oral squamous cell carcinoma |
| Skin | 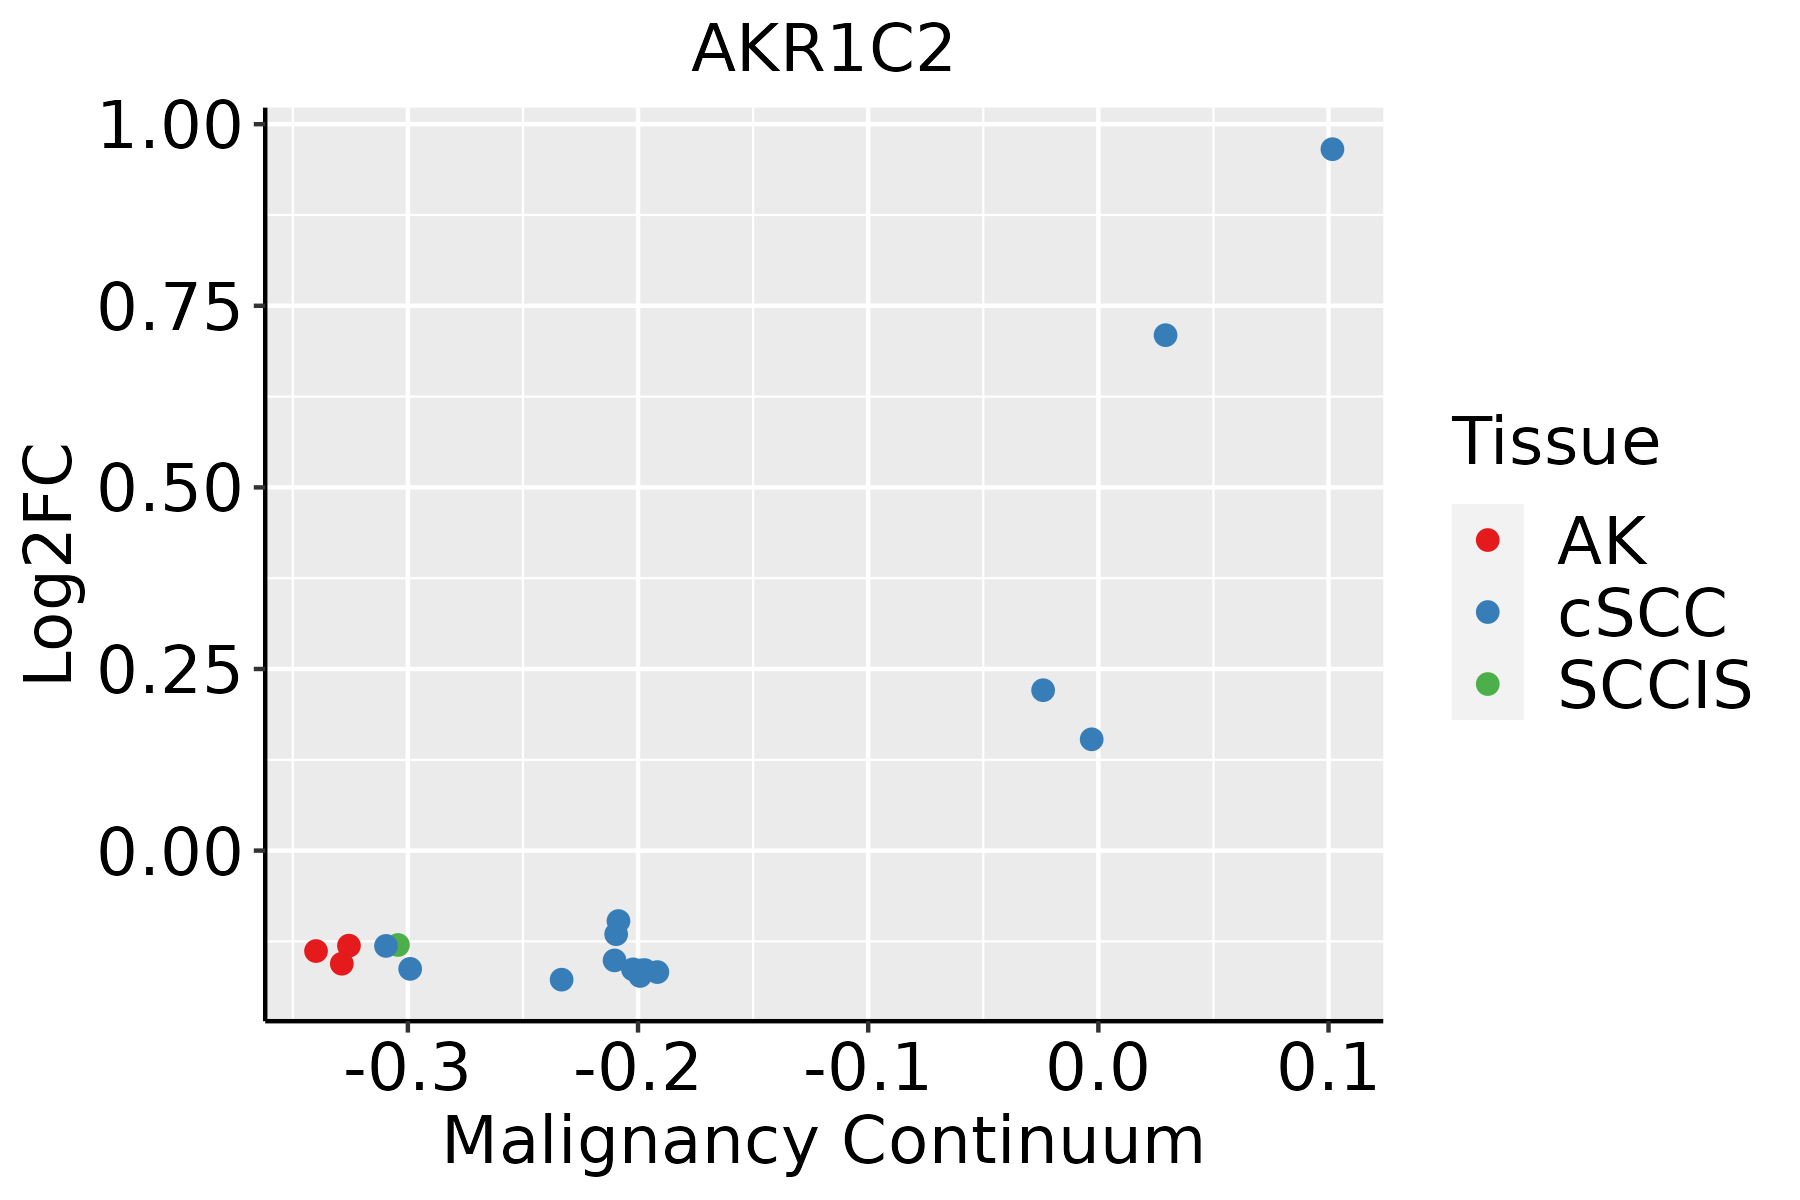 | AK: Actinic keratosis |
| cSCC: Cutaneous squamous cell carcinoma |
| SCCIS:squamous cell carcinoma in situ |
| GO ID | Tissue | Disease Stage | Description | Gene Ratio | Bg Ratio | pvalue | p.adjust | Count |
| GO:190165410 | Cervix | CC | response to ketone | 45/2311 | 194/18723 | 1.83e-05 | 3.44e-04 | 45 |
| GO:00518964 | Cervix | CC | regulation of protein kinase B signaling | 39/2311 | 185/18723 | 5.25e-04 | 5.10e-03 | 39 |
| GO:00518973 | Cervix | CC | positive regulation of protein kinase B signaling | 28/2311 | 120/18723 | 5.90e-04 | 5.59e-03 | 28 |
| GO:00434913 | Cervix | CC | protein kinase B signaling | 43/2311 | 211/18723 | 5.95e-04 | 5.60e-03 | 43 |
| GO:00973059 | Cervix | CC | response to alcohol | 46/2311 | 253/18723 | 4.40e-03 | 2.69e-02 | 46 |
| GO:190165420 | Esophagus | HGIN | response to ketone | 48/2587 | 194/18723 | 3.17e-05 | 8.12e-04 | 48 |
| GO:00066929 | Esophagus | HGIN | prostanoid metabolic process | 17/2587 | 49/18723 | 1.84e-04 | 3.48e-03 | 17 |
| GO:00066939 | Esophagus | HGIN | prostaglandin metabolic process | 17/2587 | 49/18723 | 1.84e-04 | 3.48e-03 | 17 |
| GO:009730520 | Esophagus | HGIN | response to alcohol | 54/2587 | 253/18723 | 6.46e-04 | 8.87e-03 | 54 |
| GO:00306386 | Esophagus | HGIN | polyketide metabolic process | 6/2587 | 10/18723 | 8.81e-04 | 1.13e-02 | 6 |
| GO:00306476 | Esophagus | HGIN | aminoglycoside antibiotic metabolic process | 6/2587 | 10/18723 | 8.81e-04 | 1.13e-02 | 6 |
| GO:00445986 | Esophagus | HGIN | doxorubicin metabolic process | 6/2587 | 10/18723 | 8.81e-04 | 1.13e-02 | 6 |
| GO:19016614 | Esophagus | HGIN | quinone metabolic process | 13/2587 | 40/18723 | 2.04e-03 | 2.13e-02 | 13 |
| GO:190166112 | Esophagus | ESCC | quinone metabolic process | 34/8552 | 40/18723 | 3.00e-07 | 4.27e-06 | 34 |
| GO:00060668 | Esophagus | ESCC | alcohol metabolic process | 202/8552 | 353/18723 | 7.32e-06 | 7.26e-05 | 202 |
| GO:1901654111 | Esophagus | ESCC | response to ketone | 118/8552 | 194/18723 | 1.45e-05 | 1.31e-04 | 118 |
| GO:00066318 | Esophagus | ESCC | fatty acid metabolic process | 217/8552 | 390/18723 | 4.21e-05 | 3.39e-04 | 217 |
| GO:19016574 | Esophagus | ESCC | glycosyl compound metabolic process | 57/8552 | 88/18723 | 2.32e-04 | 1.44e-03 | 57 |
| GO:00421805 | Esophagus | ESCC | cellular ketone metabolic process | 120/8552 | 211/18723 | 6.70e-04 | 3.55e-03 | 120 |
| GO:19016556 | Esophagus | ESCC | cellular response to ketone | 59/8552 | 96/18723 | 1.32e-03 | 6.30e-03 | 59 |
| Pathway ID | Tissue | Disease Stage | Description | Gene Ratio | Bg Ratio | pvalue | p.adjust | qvalue | Count |
| hsa0520839 | Esophagus | HGIN | Chemical carcinogenesis - reactive oxygen species | 92/1383 | 223/8465 | 2.41e-19 | 9.83e-18 | 7.80e-18 | 92 |
| hsa05208115 | Esophagus | HGIN | Chemical carcinogenesis - reactive oxygen species | 92/1383 | 223/8465 | 2.41e-19 | 9.83e-18 | 7.80e-18 | 92 |
| hsa05208211 | Esophagus | ESCC | Chemical carcinogenesis - reactive oxygen species | 168/4205 | 223/8465 | 1.83e-15 | 6.81e-14 | 3.49e-14 | 168 |
| hsa05208310 | Esophagus | ESCC | Chemical carcinogenesis - reactive oxygen species | 168/4205 | 223/8465 | 1.83e-15 | 6.81e-14 | 3.49e-14 | 168 |
| hsa0520842 | Liver | HCC | Chemical carcinogenesis - reactive oxygen species | 167/4020 | 223/8465 | 2.85e-17 | 1.91e-15 | 1.06e-15 | 167 |
| hsa0520852 | Liver | HCC | Chemical carcinogenesis - reactive oxygen species | 167/4020 | 223/8465 | 2.85e-17 | 1.91e-15 | 1.06e-15 | 167 |
| hsa0520830 | Oral cavity | OSCC | Chemical carcinogenesis - reactive oxygen species | 150/3704 | 223/8465 | 6.45e-13 | 1.20e-11 | 6.11e-12 | 150 |
| hsa05208114 | Oral cavity | OSCC | Chemical carcinogenesis - reactive oxygen species | 150/3704 | 223/8465 | 6.45e-13 | 1.20e-11 | 6.11e-12 | 150 |
| hsa05208210 | Oral cavity | LP | Chemical carcinogenesis - reactive oxygen species | 119/2418 | 223/8465 | 3.00e-15 | 8.32e-14 | 5.37e-14 | 119 |
| hsa0520838 | Oral cavity | LP | Chemical carcinogenesis - reactive oxygen species | 119/2418 | 223/8465 | 3.00e-15 | 8.32e-14 | 5.37e-14 | 119 |
| Hugo Symbol | Variant Class | Variant Classification | dbSNP RS | HGVSc | HGVSp | HGVSp Short | SWISSPROT | BIOTYPE | SIFT | PolyPhen | Tumor Sample Barcode | Tissue | Histology | Sex | Age | Stage | Therapy Types | Drugs | Outcome |
| AKR1C2 | SNV | Missense_Mutation | rs782255440 | c.139C>T | p.His47Tyr | p.H47Y | P52895 | protein_coding | deleterious(0.02) | benign(0.001) | TCGA-5L-AAT1-01 | Breast | breast invasive carcinoma | Female | <65 | III/IV | Hormone Therapy | letrozol | SD |
| AKR1C2 | SNV | Missense_Mutation | | c.580C>G | p.His194Asp | p.H194D | P52895 | protein_coding | deleterious(0) | probably_damaging(0.994) | TCGA-A2-A0YK-01 | Breast | breast invasive carcinoma | Female | <65 | I/II | Chemotherapy | cytoxan | SD |
| AKR1C2 | SNV | Missense_Mutation | | c.362N>T | p.Ser121Phe | p.S121F | P52895 | protein_coding | tolerated(0.06) | possibly_damaging(0.597) | TCGA-D8-A1XA-01 | Breast | breast invasive carcinoma | Female | <65 | I/II | Unknown | Unknown | SD |
| AKR1C2 | SNV | Missense_Mutation | | c.504N>G | p.Phe168Leu | p.F168L | P52895 | protein_coding | deleterious(0.01) | probably_damaging(0.999) | TCGA-C5-A7UE-01 | Cervix | cervical & endocervical cancer | Female | <65 | I/II | Chemotherapy | cisplatin | SD |
| AKR1C2 | SNV | Missense_Mutation | rs781814762 | c.197N>A | p.Arg66Gln | p.R66Q | P52895 | protein_coding | tolerated(0.15) | benign(0.055) | TCGA-A5-A2K5-01 | Endometrium | uterine corpus endometrioid carcinoma | Female | >=65 | I/II | Unknown | Unknown | SD |
| AKR1C2 | SNV | Missense_Mutation | rs782385243 | c.749N>A | p.Arg250Gln | p.R250Q | P52895 | protein_coding | tolerated(0.23) | benign(0.044) | TCGA-AX-A063-01 | Endometrium | uterine corpus endometrioid carcinoma | Female | <65 | I/II | Unknown | Unknown | SD |
| AKR1C2 | SNV | Missense_Mutation | novel | c.55C>A | p.Leu19Met | p.L19M | P52895 | protein_coding | deleterious(0.02) | probably_damaging(0.921) | TCGA-AX-A2HC-01 | Endometrium | uterine corpus endometrioid carcinoma | Female | <65 | III/IV | Chemotherapy | paclitaxel | PD |
| AKR1C2 | SNV | Missense_Mutation | | c.394N>T | p.Asp132Tyr | p.D132Y | P52895 | protein_coding | deleterious(0.01) | probably_damaging(0.965) | TCGA-B5-A0JY-01 | Endometrium | uterine corpus endometrioid carcinoma | Female | <65 | III/IV | Chemotherapy | doxorubicin | SD |
| AKR1C2 | SNV | Missense_Mutation | novel | c.627N>C | p.Lys209Asn | p.K209N | P52895 | protein_coding | tolerated(0.14) | benign(0.062) | TCGA-B5-A1MR-01 | Endometrium | uterine corpus endometrioid carcinoma | Female | >=65 | III/IV | Unknown | Unknown | SD |
| AKR1C2 | SNV | Missense_Mutation | novel | c.325N>A | p.Asp109Asn | p.D109N | P52895 | protein_coding | tolerated(0.07) | benign(0.358) | TCGA-B5-A3FA-01 | Endometrium | uterine corpus endometrioid carcinoma | Female | >=65 | I/II | Unknown | Unknown | SD |


