
|
|||||
|
 | |
| |
| |
| |
| |
| |
|
Gene: AKR1C1 |
Gene summary for AKR1C1 |
| Gene information | Species | Human | Gene symbol | AKR1C1 | Gene ID | 1645 |
| Gene name | aldo-keto reductase family 1 member C1 | |
| Gene Alias | 2-ALPHA-HSD | |
| Cytomap | 10p15.1 | |
| Gene Type | protein-coding | GO ID | GO:0001523 | UniProtAcc | Q04828 |
Top |
Malignant transformation analysis |
| Identification of the aberrant gene expression in precancerous and cancerous lesions by comparing the gene expression of stem-like cells in diseased tissues with normal stem cells |
| Entrez ID | Symbol | Replicates | Species | Organ | Tissue | Adj P-value | Log2FC | Malignancy |
| 1645 | AKR1C1 | LZE2D | Human | Esophagus | HGIN | 2.64e-07 | 2.00e+00 | 0.0642 |
| 1645 | AKR1C1 | LZE2T | Human | Esophagus | ESCC | 1.29e-16 | 3.90e+00 | 0.082 |
| 1645 | AKR1C1 | LZE4T | Human | Esophagus | ESCC | 4.38e-54 | 4.11e+00 | 0.0811 |
| 1645 | AKR1C1 | LZE5T | Human | Esophagus | ESCC | 4.85e-02 | 1.77e+00 | 0.0514 |
| 1645 | AKR1C1 | LZE7T | Human | Esophagus | ESCC | 1.08e-18 | 2.46e+00 | 0.0667 |
| 1645 | AKR1C1 | LZE21D1 | Human | Esophagus | HGIN | 1.59e-09 | 1.90e+00 | 0.0632 |
| 1645 | AKR1C1 | LZE22T | Human | Esophagus | ESCC | 9.96e-04 | 1.82e+00 | 0.068 |
| 1645 | AKR1C1 | LZE24T | Human | Esophagus | ESCC | 8.63e-23 | 1.61e+00 | 0.0596 |
| 1645 | AKR1C1 | LZE21T | Human | Esophagus | ESCC | 4.01e-18 | 3.07e+00 | 0.0655 |
| 1645 | AKR1C1 | LZE6T | Human | Esophagus | ESCC | 9.30e-04 | -3.42e-01 | 0.0845 |
| 1645 | AKR1C1 | P2T-E | Human | Esophagus | ESCC | 6.34e-03 | -3.71e-01 | 0.1177 |
| 1645 | AKR1C1 | P4T-E | Human | Esophagus | ESCC | 1.15e-42 | 2.62e+00 | 0.1323 |
| 1645 | AKR1C1 | P5T-E | Human | Esophagus | ESCC | 1.83e-04 | -3.26e-01 | 0.1327 |
| 1645 | AKR1C1 | P8T-E | Human | Esophagus | ESCC | 1.56e-06 | 8.58e-01 | 0.0889 |
| 1645 | AKR1C1 | P9T-E | Human | Esophagus | ESCC | 9.31e-76 | 4.76e+00 | 0.1131 |
| 1645 | AKR1C1 | P12T-E | Human | Esophagus | ESCC | 7.01e-32 | 2.70e+00 | 0.1122 |
| 1645 | AKR1C1 | P15T-E | Human | Esophagus | ESCC | 1.55e-74 | 3.97e+00 | 0.1149 |
| 1645 | AKR1C1 | P20T-E | Human | Esophagus | ESCC | 1.40e-14 | 1.20e+00 | 0.1124 |
| 1645 | AKR1C1 | P21T-E | Human | Esophagus | ESCC | 2.50e-42 | 2.36e+00 | 0.1617 |
| 1645 | AKR1C1 | P22T-E | Human | Esophagus | ESCC | 4.98e-92 | 2.82e+00 | 0.1236 |
| Page: 1 2 3 4 5 6 |
| Tissue | Expression Dynamics | Abbreviation |
| Esophagus |  | ESCC: Esophageal squamous cell carcinoma |
| HGIN: High-grade intraepithelial neoplasias | ||
| LGIN: Low-grade intraepithelial neoplasias | ||
| GC |  | CAG: Chronic atrophic gastritis |
| CAG with IM: Chronic atrophic gastritis with intestinal metaplasia | ||
| CSG: Chronic superficial gastritis | ||
| GC: Gastric cancer | ||
| SIM: Severe intestinal metaplasia | ||
| WIM: Wild intestinal metaplasia | ||
| Liver | 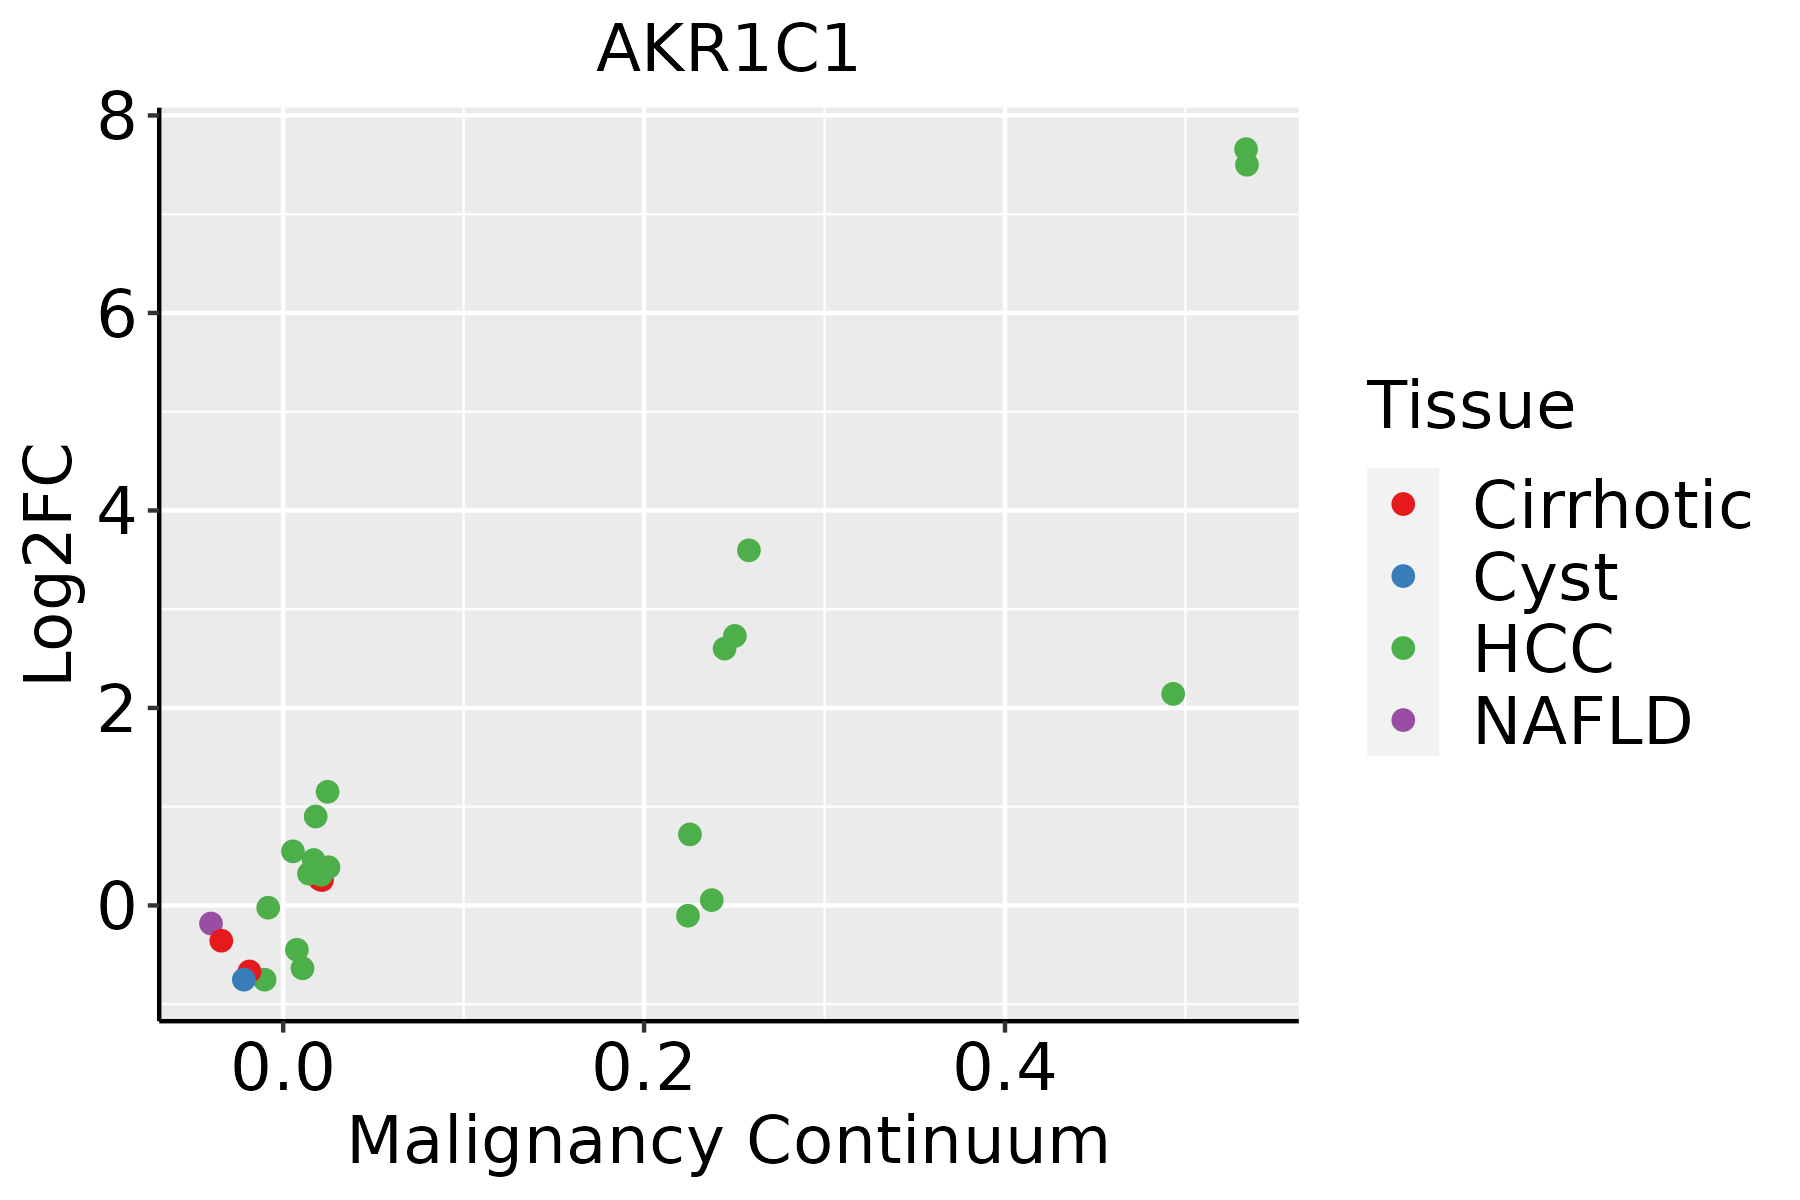 | HCC: Hepatocellular carcinoma |
| NAFLD: Non-alcoholic fatty liver disease | ||
| Oral Cavity | 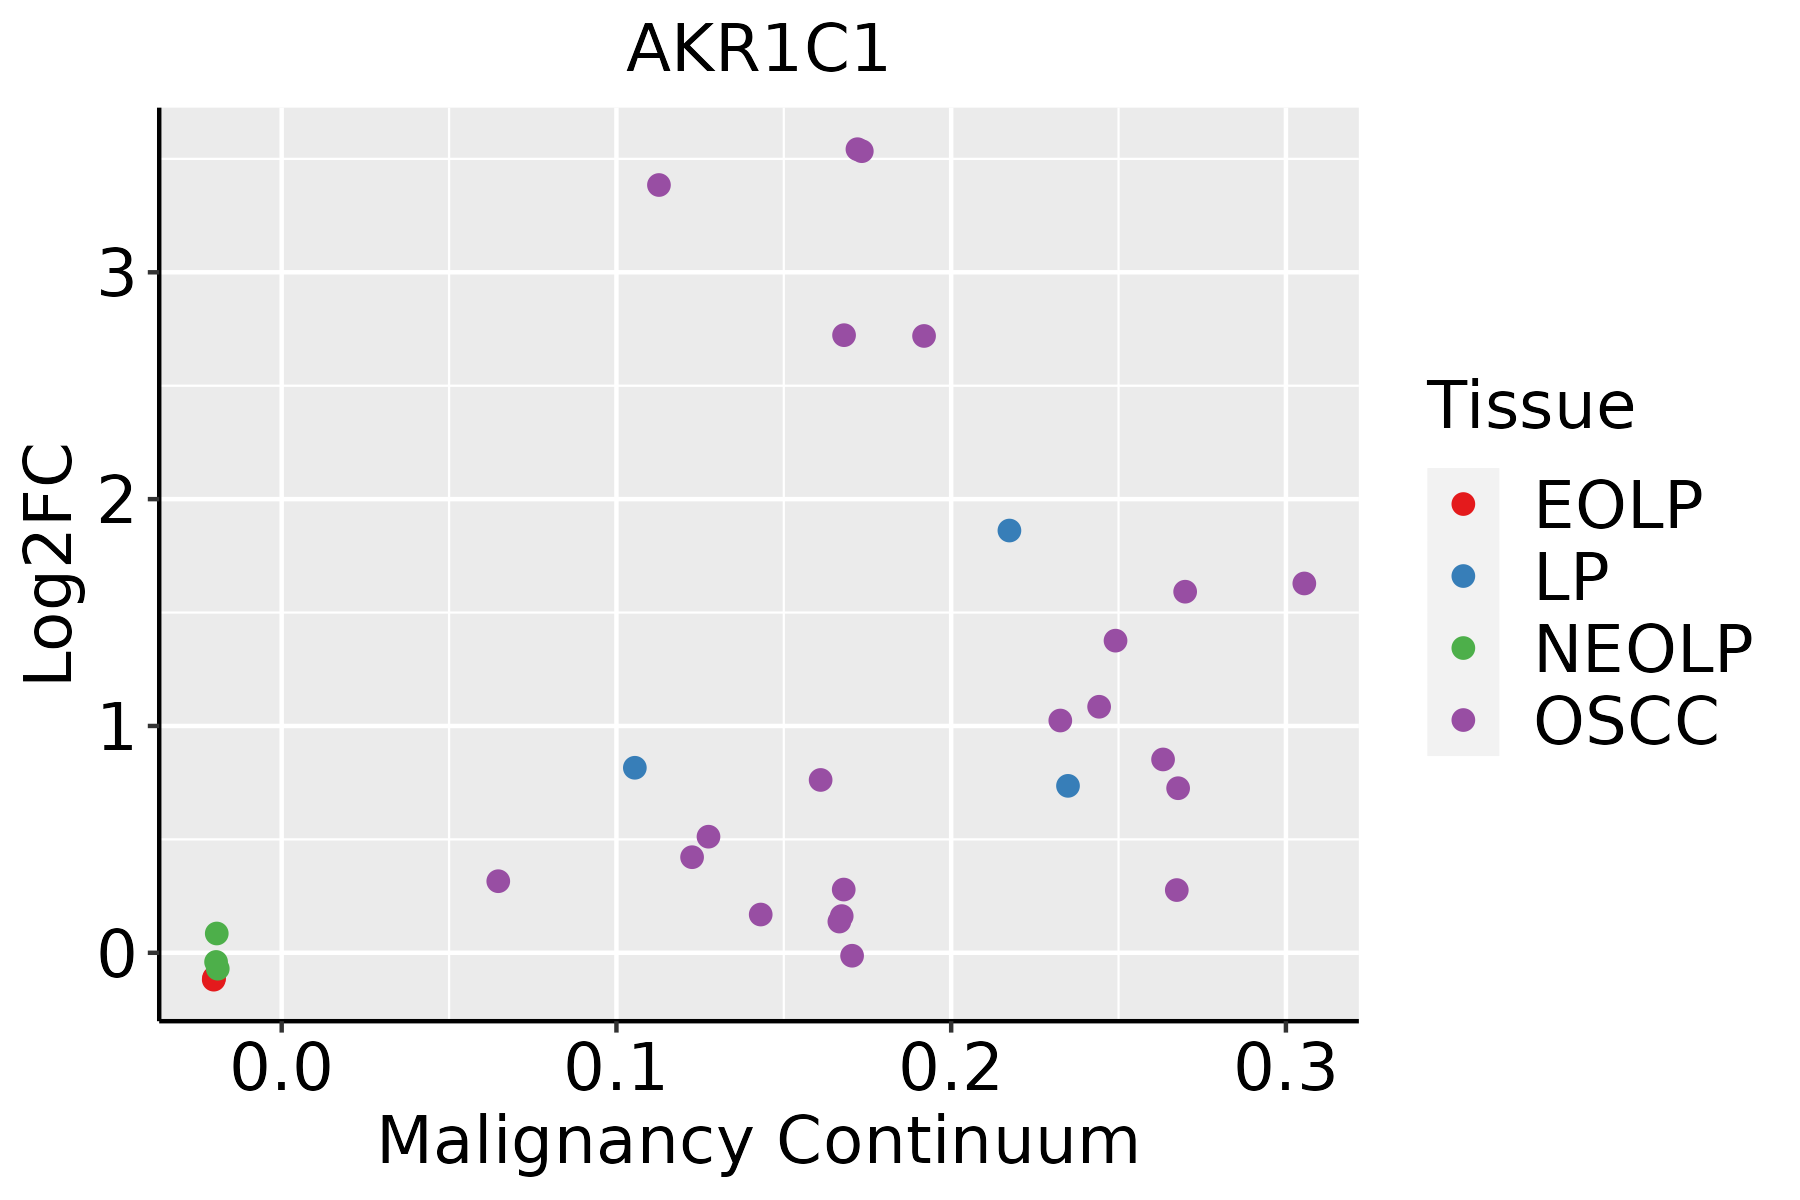 | EOLP: Erosive Oral lichen planus |
| LP: leukoplakia | ||
| NEOLP: Non-erosive oral lichen planus | ||
| OSCC: Oral squamous cell carcinoma | ||
| Skin |  | AK: Actinic keratosis |
| cSCC: Cutaneous squamous cell carcinoma | ||
| SCCIS:squamous cell carcinoma in situ | ||
| Thyroid | 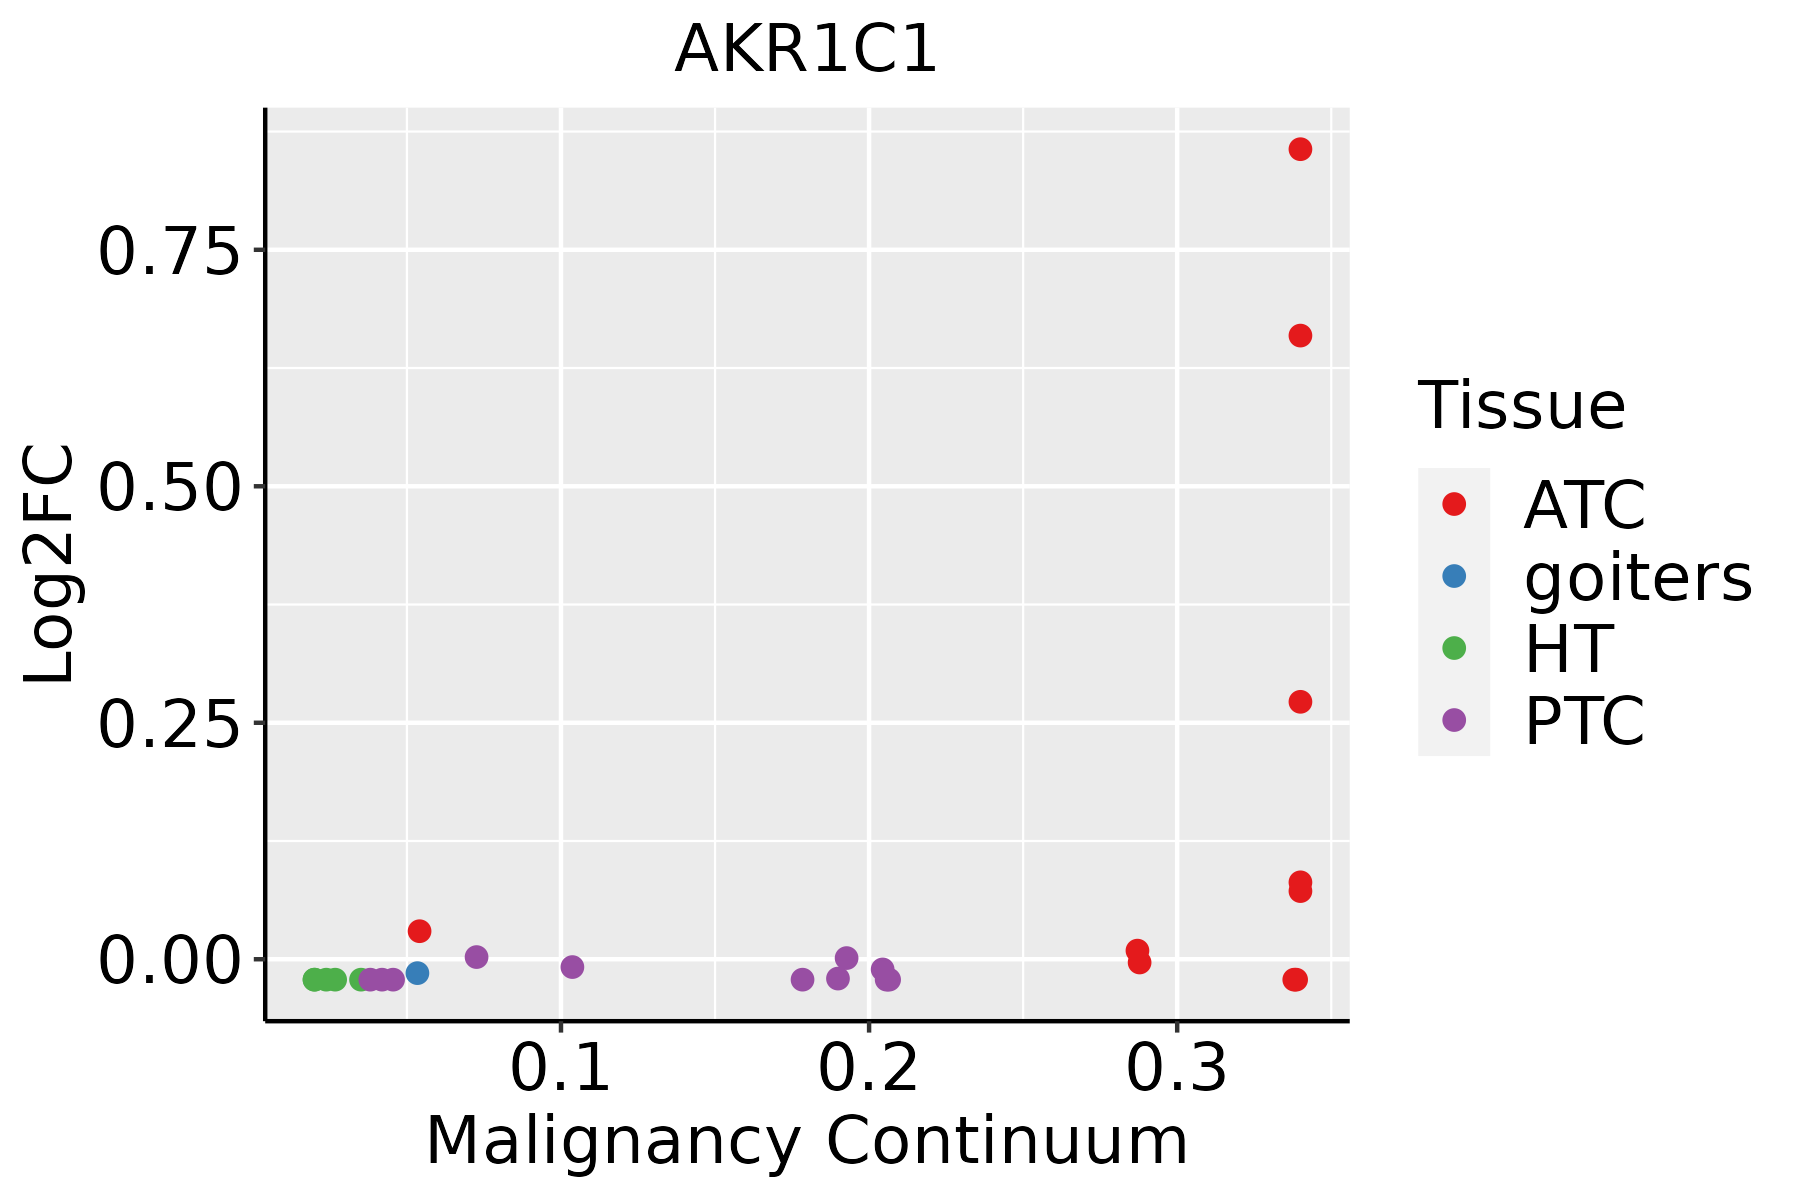 | ATC: Anaplastic thyroid cancer |
| HT: Hashimoto's thyroiditis | ||
| PTC: Papillary thyroid cancer |
| ∗log2FC in expression of this searched gene in stem-like cells from each diseased tissue sample relative to stem-like cells in normal samples in each tissue plotted against the malignancy continuum. Samples are colored based on if they are from different disease stage. |
Top |
Malignant transformation related pathway analysis |
| Find out the enriched GO biological processes and KEGG pathways involved in transition from healthy to precancer to cancer |
| Tissue | Disease Stage | Enriched GO biological Processes |
| Colorectum | AD |  |
| Colorectum | SER |  |
| Colorectum | MSS |  |
| Colorectum | MSI-H |  |
| Colorectum | FAP |  |
| ∗Top 15 enriched GO BP terms are showed in the bar plot of each disease state in each tissue. Each row represents a significant GO biological process which is colored according to the -log10(p.adjust). |
| Page: 1 2 3 4 5 6 7 8 9 |
| GO ID | Tissue | Disease Stage | Description | Gene Ratio | Bg Ratio | pvalue | p.adjust | Count |
| GO:00066929 | Esophagus | HGIN | prostanoid metabolic process | 17/2587 | 49/18723 | 1.84e-04 | 3.48e-03 | 17 |
| GO:00066939 | Esophagus | HGIN | prostaglandin metabolic process | 17/2587 | 49/18723 | 1.84e-04 | 3.48e-03 | 17 |
| GO:00306386 | Esophagus | HGIN | polyketide metabolic process | 6/2587 | 10/18723 | 8.81e-04 | 1.13e-02 | 6 |
| GO:00306476 | Esophagus | HGIN | aminoglycoside antibiotic metabolic process | 6/2587 | 10/18723 | 8.81e-04 | 1.13e-02 | 6 |
| GO:00445986 | Esophagus | HGIN | doxorubicin metabolic process | 6/2587 | 10/18723 | 8.81e-04 | 1.13e-02 | 6 |
| GO:19016614 | Esophagus | HGIN | quinone metabolic process | 13/2587 | 40/18723 | 2.04e-03 | 2.13e-02 | 13 |
| GO:190166112 | Esophagus | ESCC | quinone metabolic process | 34/8552 | 40/18723 | 3.00e-07 | 4.27e-06 | 34 |
| GO:200037718 | Esophagus | ESCC | regulation of reactive oxygen species metabolic process | 100/8552 | 157/18723 | 3.87e-06 | 4.17e-05 | 100 |
| GO:00060668 | Esophagus | ESCC | alcohol metabolic process | 202/8552 | 353/18723 | 7.32e-06 | 7.26e-05 | 202 |
| GO:00066318 | Esophagus | ESCC | fatty acid metabolic process | 217/8552 | 390/18723 | 4.21e-05 | 3.39e-04 | 217 |
| GO:000941020 | Esophagus | ESCC | response to xenobiotic stimulus | 253/8552 | 462/18723 | 4.55e-05 | 3.58e-04 | 253 |
| GO:007259318 | Esophagus | ESCC | reactive oxygen species metabolic process | 137/8552 | 239/18723 | 1.82e-04 | 1.16e-03 | 137 |
| GO:19016574 | Esophagus | ESCC | glycosyl compound metabolic process | 57/8552 | 88/18723 | 2.32e-04 | 1.44e-03 | 57 |
| GO:00421805 | Esophagus | ESCC | cellular ketone metabolic process | 120/8552 | 211/18723 | 6.70e-04 | 3.55e-03 | 120 |
| GO:00060818 | Esophagus | ESCC | cellular aldehyde metabolic process | 40/8552 | 60/18723 | 8.30e-04 | 4.28e-03 | 40 |
| GO:000669211 | Esophagus | ESCC | prostanoid metabolic process | 33/8552 | 49/18723 | 1.80e-03 | 8.26e-03 | 33 |
| GO:000669311 | Esophagus | ESCC | prostaglandin metabolic process | 33/8552 | 49/18723 | 1.80e-03 | 8.26e-03 | 33 |
| GO:003063813 | Esophagus | ESCC | polyketide metabolic process | 9/8552 | 10/18723 | 5.09e-03 | 1.92e-02 | 9 |
| GO:004459813 | Esophagus | ESCC | doxorubicin metabolic process | 9/8552 | 10/18723 | 5.09e-03 | 1.92e-02 | 9 |
| GO:00161373 | Esophagus | ESCC | glycoside metabolic process | 16/8552 | 22/18723 | 9.46e-03 | 3.28e-02 | 16 |
| Page: 1 2 3 4 5 6 7 8 9 10 11 12 13 14 15 16 17 |
| Pathway ID | Tissue | Disease Stage | Description | Gene Ratio | Bg Ratio | pvalue | p.adjust | qvalue | Count |
| hsa0520839 | Esophagus | HGIN | Chemical carcinogenesis - reactive oxygen species | 92/1383 | 223/8465 | 2.41e-19 | 9.83e-18 | 7.80e-18 | 92 |
| hsa05208115 | Esophagus | HGIN | Chemical carcinogenesis - reactive oxygen species | 92/1383 | 223/8465 | 2.41e-19 | 9.83e-18 | 7.80e-18 | 92 |
| hsa05208211 | Esophagus | ESCC | Chemical carcinogenesis - reactive oxygen species | 168/4205 | 223/8465 | 1.83e-15 | 6.81e-14 | 3.49e-14 | 168 |
| hsa05208310 | Esophagus | ESCC | Chemical carcinogenesis - reactive oxygen species | 168/4205 | 223/8465 | 1.83e-15 | 6.81e-14 | 3.49e-14 | 168 |
| hsa0520814 | Liver | NAFLD | Chemical carcinogenesis - reactive oxygen species | 44/1043 | 223/8465 | 9.22e-04 | 1.31e-02 | 1.06e-02 | 44 |
| hsa0520815 | Liver | NAFLD | Chemical carcinogenesis - reactive oxygen species | 44/1043 | 223/8465 | 9.22e-04 | 1.31e-02 | 1.06e-02 | 44 |
| hsa0520822 | Liver | Cirrhotic | Chemical carcinogenesis - reactive oxygen species | 121/2530 | 223/8465 | 1.35e-14 | 4.08e-13 | 2.52e-13 | 121 |
| hsa0520832 | Liver | Cirrhotic | Chemical carcinogenesis - reactive oxygen species | 121/2530 | 223/8465 | 1.35e-14 | 4.08e-13 | 2.52e-13 | 121 |
| hsa0520862 | Liver | Cyst | Chemical carcinogenesis - reactive oxygen species | 40/339 | 223/8465 | 4.80e-16 | 3.45e-14 | 2.85e-14 | 40 |
| hsa0520872 | Liver | Cyst | Chemical carcinogenesis - reactive oxygen species | 40/339 | 223/8465 | 4.80e-16 | 3.45e-14 | 2.85e-14 | 40 |
| hsa0520830 | Oral cavity | OSCC | Chemical carcinogenesis - reactive oxygen species | 150/3704 | 223/8465 | 6.45e-13 | 1.20e-11 | 6.11e-12 | 150 |
| hsa05208114 | Oral cavity | OSCC | Chemical carcinogenesis - reactive oxygen species | 150/3704 | 223/8465 | 6.45e-13 | 1.20e-11 | 6.11e-12 | 150 |
| hsa05208210 | Oral cavity | LP | Chemical carcinogenesis - reactive oxygen species | 119/2418 | 223/8465 | 3.00e-15 | 8.32e-14 | 5.37e-14 | 119 |
| hsa0520838 | Oral cavity | LP | Chemical carcinogenesis - reactive oxygen species | 119/2418 | 223/8465 | 3.00e-15 | 8.32e-14 | 5.37e-14 | 119 |
| hsa0520812 | Stomach | GC | Chemical carcinogenesis - reactive oxygen species | 65/708 | 223/8465 | 3.46e-20 | 2.72e-18 | 1.91e-18 | 65 |
| hsa00980 | Stomach | GC | Metabolism of xenobiotics by cytochrome P450 | 15/708 | 78/8465 | 1.77e-03 | 1.16e-02 | 8.15e-03 | 15 |
| hsa0520813 | Stomach | GC | Chemical carcinogenesis - reactive oxygen species | 65/708 | 223/8465 | 3.46e-20 | 2.72e-18 | 1.91e-18 | 65 |
| hsa009801 | Stomach | GC | Metabolism of xenobiotics by cytochrome P450 | 15/708 | 78/8465 | 1.77e-03 | 1.16e-02 | 8.15e-03 | 15 |
| hsa0520821 | Stomach | CAG with IM | Chemical carcinogenesis - reactive oxygen species | 65/640 | 223/8465 | 1.37e-22 | 1.09e-20 | 7.65e-21 | 65 |
| hsa0520831 | Stomach | CAG with IM | Chemical carcinogenesis - reactive oxygen species | 65/640 | 223/8465 | 1.37e-22 | 1.09e-20 | 7.65e-21 | 65 |
| Page: 1 2 |
Top |
Cell-cell communication analysis |
| Identification of potential cell-cell interactions between two cell types and their ligand-receptor pairs for different disease states |
| Ligand | Receptor | LRpair | Pathway | Tissue | Disease Stage |
| Page: 1 |
Top |
Single-cell gene regulatory network inference analysis |
| Find out the significant the regulons (TFs) and the target genes of each regulon across cell types for different disease states |
| TF | Cell Type | Tissue | Disease Stage | Target Gene | RSS | Regulon Activity |
| ∗The dot plots of a searched regulon are shown for all cell subpopulations in each disease state of each tissue based on the regulon specific score inferred using pySCENIC and by calculating the average expression. |
| Page: 1 |
Top |
Somatic mutation of malignant transformation related genes |
| Annotation of somatic variants for genes involved in malignant transformation |
| Hugo Symbol | Variant Class | Variant Classification | dbSNP RS | HGVSc | HGVSp | HGVSp Short | SWISSPROT | BIOTYPE | SIFT | PolyPhen | Tumor Sample Barcode | Tissue | Histology | Sex | Age | Stage | Therapy Types | Drugs | Outcome |
| AKR1C1 | SNV | Missense_Mutation | novel | c.152C>A | p.Ser51Tyr | p.S51Y | Q04828 | protein_coding | deleterious(0.02) | probably_damaging(0.941) | TCGA-5L-AAT1-01 | Breast | breast invasive carcinoma | Female | <65 | III/IV | Hormone Therapy | letrozol | SD |
| AKR1C1 | SNV | Missense_Mutation | c.520N>C | p.Glu174Gln | p.E174Q | Q04828 | protein_coding | deleterious(0) | possibly_damaging(0.666) | TCGA-A1-A0SI-01 | Breast | breast invasive carcinoma | Female | <65 | I/II | Unknown | Unknown | SD | |
| AKR1C1 | SNV | Missense_Mutation | novel | c.382N>A | p.Val128Met | p.V128M | Q04828 | protein_coding | tolerated(0.06) | benign(0.007) | TCGA-AR-A1AK-01 | Breast | breast invasive carcinoma | Female | >=65 | I/II | Hormone Therapy | anastrozole | SD |
| AKR1C1 | SNV | Missense_Mutation | c.820N>A | p.Glu274Lys | p.E274K | Q04828 | protein_coding | tolerated(0.23) | benign(0.078) | TCGA-BH-A0HP-01 | Breast | breast invasive carcinoma | Female | >=65 | III/IV | Chemotherapy | doxorubicin | SD | |
| AKR1C1 | SNV | Missense_Mutation | c.305C>T | p.Ser102Leu | p.S102L | Q04828 | protein_coding | deleterious(0) | probably_damaging(0.962) | TCGA-BH-A18G-01 | Breast | breast invasive carcinoma | Female | >=65 | I/II | Unknown | Unknown | SD | |
| AKR1C1 | SNV | Missense_Mutation | c.820N>C | p.Glu274Gln | p.E274Q | Q04828 | protein_coding | tolerated(0.06) | benign(0.135) | TCGA-C5-A1BQ-01 | Cervix | cervical & endocervical cancer | Female | >=65 | III/IV | Chemotherapy | cisplatin | CR | |
| AKR1C1 | SNV | Missense_Mutation | c.106N>C | p.Glu36Gln | p.E36Q | Q04828 | protein_coding | deleterious(0.04) | possibly_damaging(0.851) | TCGA-EA-A78R-01 | Cervix | cervical & endocervical cancer | Female | <65 | I/II | Unknown | Unknown | SD | |
| AKR1C1 | SNV | Missense_Mutation | c.164A>G | p.Tyr55Cys | p.Y55C | Q04828 | protein_coding | deleterious(0) | probably_damaging(0.999) | TCGA-AD-6964-01 | Colorectum | colon adenocarcinoma | Male | <65 | III/IV | Chemotherapy | folfox | PD | |
| AKR1C1 | SNV | Missense_Mutation | rs782138465 | c.826N>T | p.Arg276Cys | p.R276C | Q04828 | protein_coding | deleterious(0) | probably_damaging(0.995) | TCGA-CK-5913-01 | Colorectum | colon adenocarcinoma | Female | <65 | I/II | Unknown | Unknown | SD |
| AKR1C1 | SNV | Missense_Mutation | c.758N>T | p.Ala253Val | p.A253V | Q04828 | protein_coding | deleterious(0.01) | probably_damaging(0.981) | TCGA-G4-6588-01 | Colorectum | colon adenocarcinoma | Female | <65 | I/II | Unknown | Unknown | SD |
| Page: 1 2 3 4 |
Top |
Related drugs of malignant transformation related genes |
| Identification of chemicals and drugs interact with genes involved in malignant transfromation |
| (DGIdb 4.0) |
| Entrez ID | Symbol | Category | Interaction Types | Drug Claim Name | Drug Name | PMIDs |
| 1645 | AKR1C1 | DRUGGABLE GENOME, ENZYME | 2-(4-CHLOROBENZYLIDENE)CYCLOPENTANONE | CHEMBL562352 | 19237229 | |
| 1645 | AKR1C1 | DRUGGABLE GENOME, ENZYME | HUMAN CHORIONIC GONADOTROPIN | 436730 | ||
| 1645 | AKR1C1 | DRUGGABLE GENOME, ENZYME | ESTRONE | ESTRONE | 3859707 | |
| 1645 | AKR1C1 | DRUGGABLE GENOME, ENZYME | 3,5-DIBROMOSALICYLIC ACID | CHEMBL447448 | 19397269 | |
| 1645 | AKR1C1 | DRUGGABLE GENOME, ENZYME | 3,5-DICHLOROSALICYLIC ACID | CHEMBL449129 | 21414777 | |
| 1645 | AKR1C1 | DRUGGABLE GENOME, ENZYME | PROGESTERONE | PROGESTERONE | 6584862,12604236,3463506,2547059,6950669,3859707,179793,6288675 |
| Page: 1 |

Copyright 2023-Present -The University of Texas Health Science Center at Houston |