
|
|||||
|
 | |
| |
| |
| |
| |
| |
|
Gene: AKR1B10 |
Gene summary for AKR1B10 |
| Gene information | Species | Human | Gene symbol | AKR1B10 | Gene ID | 57016 |
| Gene name | aldo-keto reductase family 1 member B10 | |
| Gene Alias | AKR1B11 | |
| Cytomap | 7q33 | |
| Gene Type | protein-coding | GO ID | GO:0001523 | UniProtAcc | O60218 |
Top |
Malignant transformation analysis |
| Identification of the aberrant gene expression in precancerous and cancerous lesions by comparing the gene expression of stem-like cells in diseased tissues with normal stem cells |
| Entrez ID | Symbol | Replicates | Species | Organ | Tissue | Adj P-value | Log2FC | Malignancy |
| 57016 | AKR1B10 | HTA11_2487_2000001011 | Human | Colorectum | SER | 9.50e-18 | 8.12e-01 | -0.1808 |
| 57016 | AKR1B10 | HTA11_78_2000001011 | Human | Colorectum | AD | 6.44e-07 | 4.53e-01 | -0.1088 |
| 57016 | AKR1B10 | HTA11_347_2000001011 | Human | Colorectum | AD | 3.54e-09 | 3.43e-01 | -0.1954 |
| 57016 | AKR1B10 | HTA11_411_2000001011 | Human | Colorectum | SER | 7.88e-03 | 1.23e+00 | -0.2602 |
| 57016 | AKR1B10 | HTA11_83_2000001011 | Human | Colorectum | SER | 4.76e-09 | 6.12e-01 | -0.1526 |
| 57016 | AKR1B10 | HTA11_696_2000001011 | Human | Colorectum | AD | 2.57e-06 | 4.32e-01 | -0.1464 |
| 57016 | AKR1B10 | HTA11_2992_2000001011 | Human | Colorectum | SER | 5.74e-05 | 6.51e-01 | -0.1706 |
| 57016 | AKR1B10 | HTA11_5212_2000001011 | Human | Colorectum | AD | 4.69e-05 | 4.33e-01 | -0.2061 |
| 57016 | AKR1B10 | HTA11_6801_2000001011 | Human | Colorectum | SER | 3.72e-02 | 5.03e-01 | 0.0171 |
| 57016 | AKR1B10 | LZE2D | Human | Esophagus | HGIN | 1.47e-02 | 1.10e+00 | 0.0642 |
| 57016 | AKR1B10 | LZE2T | Human | Esophagus | ESCC | 2.60e-15 | 2.45e+00 | 0.082 |
| 57016 | AKR1B10 | LZE4T | Human | Esophagus | ESCC | 5.59e-39 | 2.76e+00 | 0.0811 |
| 57016 | AKR1B10 | LZE7T | Human | Esophagus | ESCC | 1.51e-04 | 6.93e-01 | 0.0667 |
| 57016 | AKR1B10 | LZE20T | Human | Esophagus | ESCC | 1.19e-03 | 3.11e-01 | 0.0662 |
| 57016 | AKR1B10 | LZE22T | Human | Esophagus | ESCC | 4.41e-05 | 1.99e+00 | 0.068 |
| 57016 | AKR1B10 | LZE21T | Human | Esophagus | ESCC | 9.04e-07 | 9.45e-01 | 0.0655 |
| 57016 | AKR1B10 | P1T-E | Human | Esophagus | ESCC | 1.26e-02 | 1.72e-01 | 0.0875 |
| 57016 | AKR1B10 | P4T-E | Human | Esophagus | ESCC | 7.56e-09 | 4.06e-01 | 0.1323 |
| 57016 | AKR1B10 | P9T-E | Human | Esophagus | ESCC | 5.05e-79 | 3.25e+00 | 0.1131 |
| 57016 | AKR1B10 | P10T-E | Human | Esophagus | ESCC | 4.83e-03 | -9.32e-03 | 0.116 |
| Page: 1 2 3 4 5 6 |
| Tissue | Expression Dynamics | Abbreviation |
| Colorectum (GSE201348) | 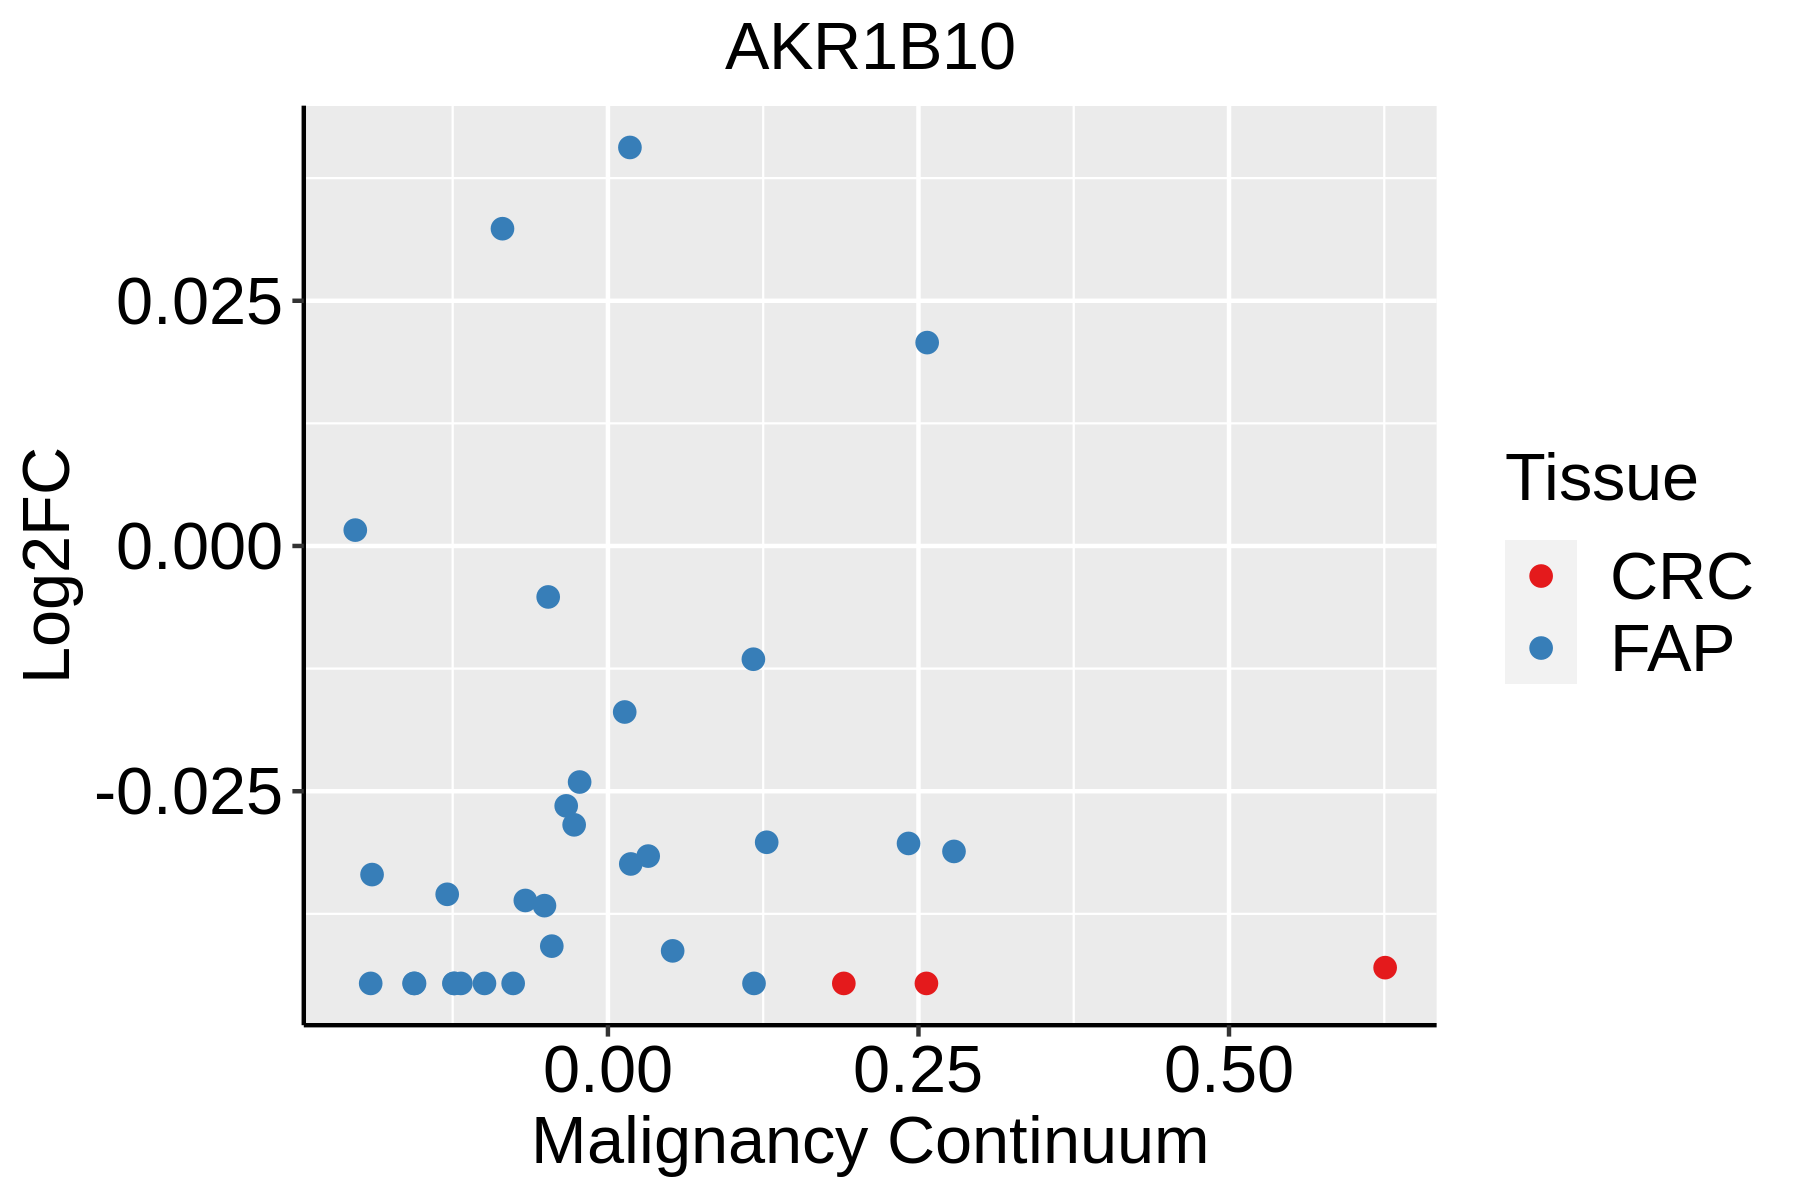 | FAP: Familial adenomatous polyposis |
| CRC: Colorectal cancer | ||
| Colorectum (HTA11) |  | AD: Adenomas |
| SER: Sessile serrated lesions | ||
| MSI-H: Microsatellite-high colorectal cancer | ||
| MSS: Microsatellite stable colorectal cancer | ||
| Esophagus | 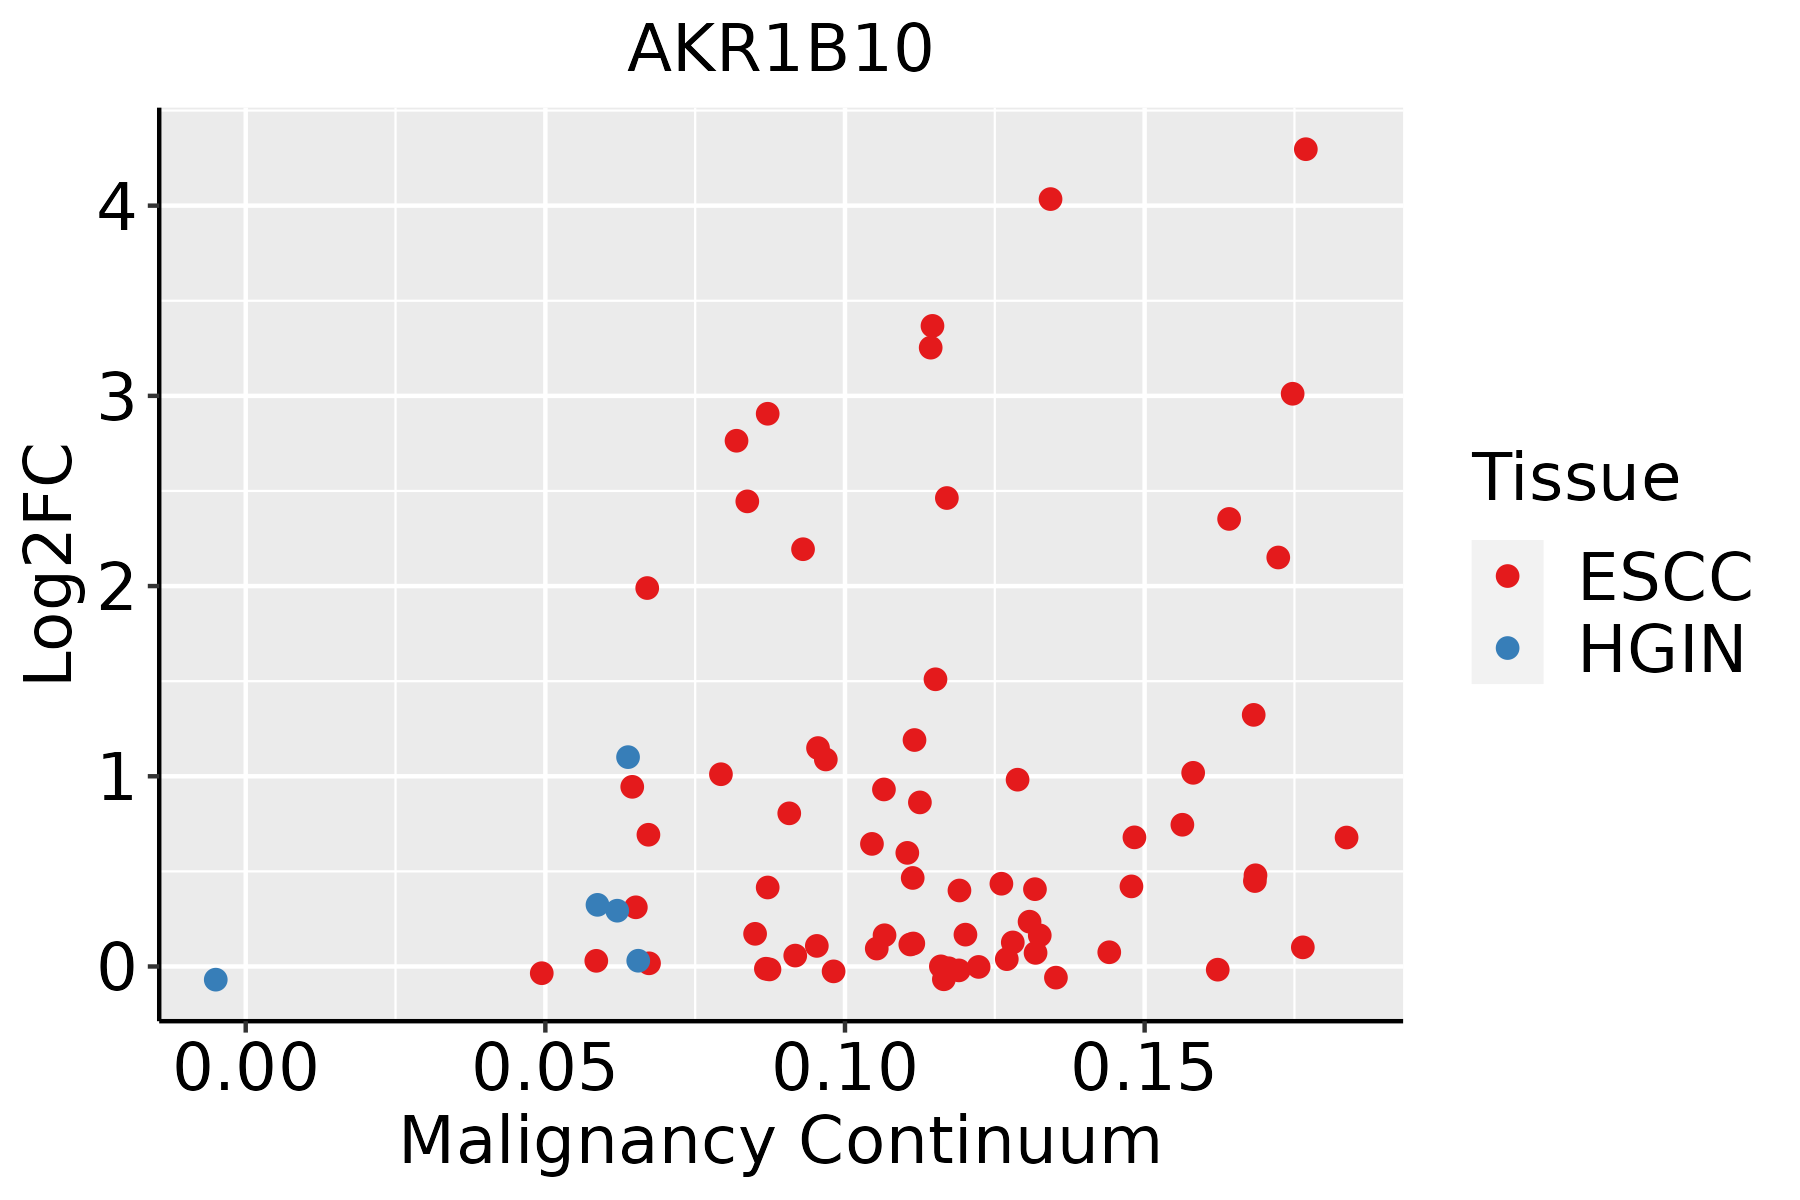 | ESCC: Esophageal squamous cell carcinoma |
| HGIN: High-grade intraepithelial neoplasias | ||
| LGIN: Low-grade intraepithelial neoplasias | ||
| GC | 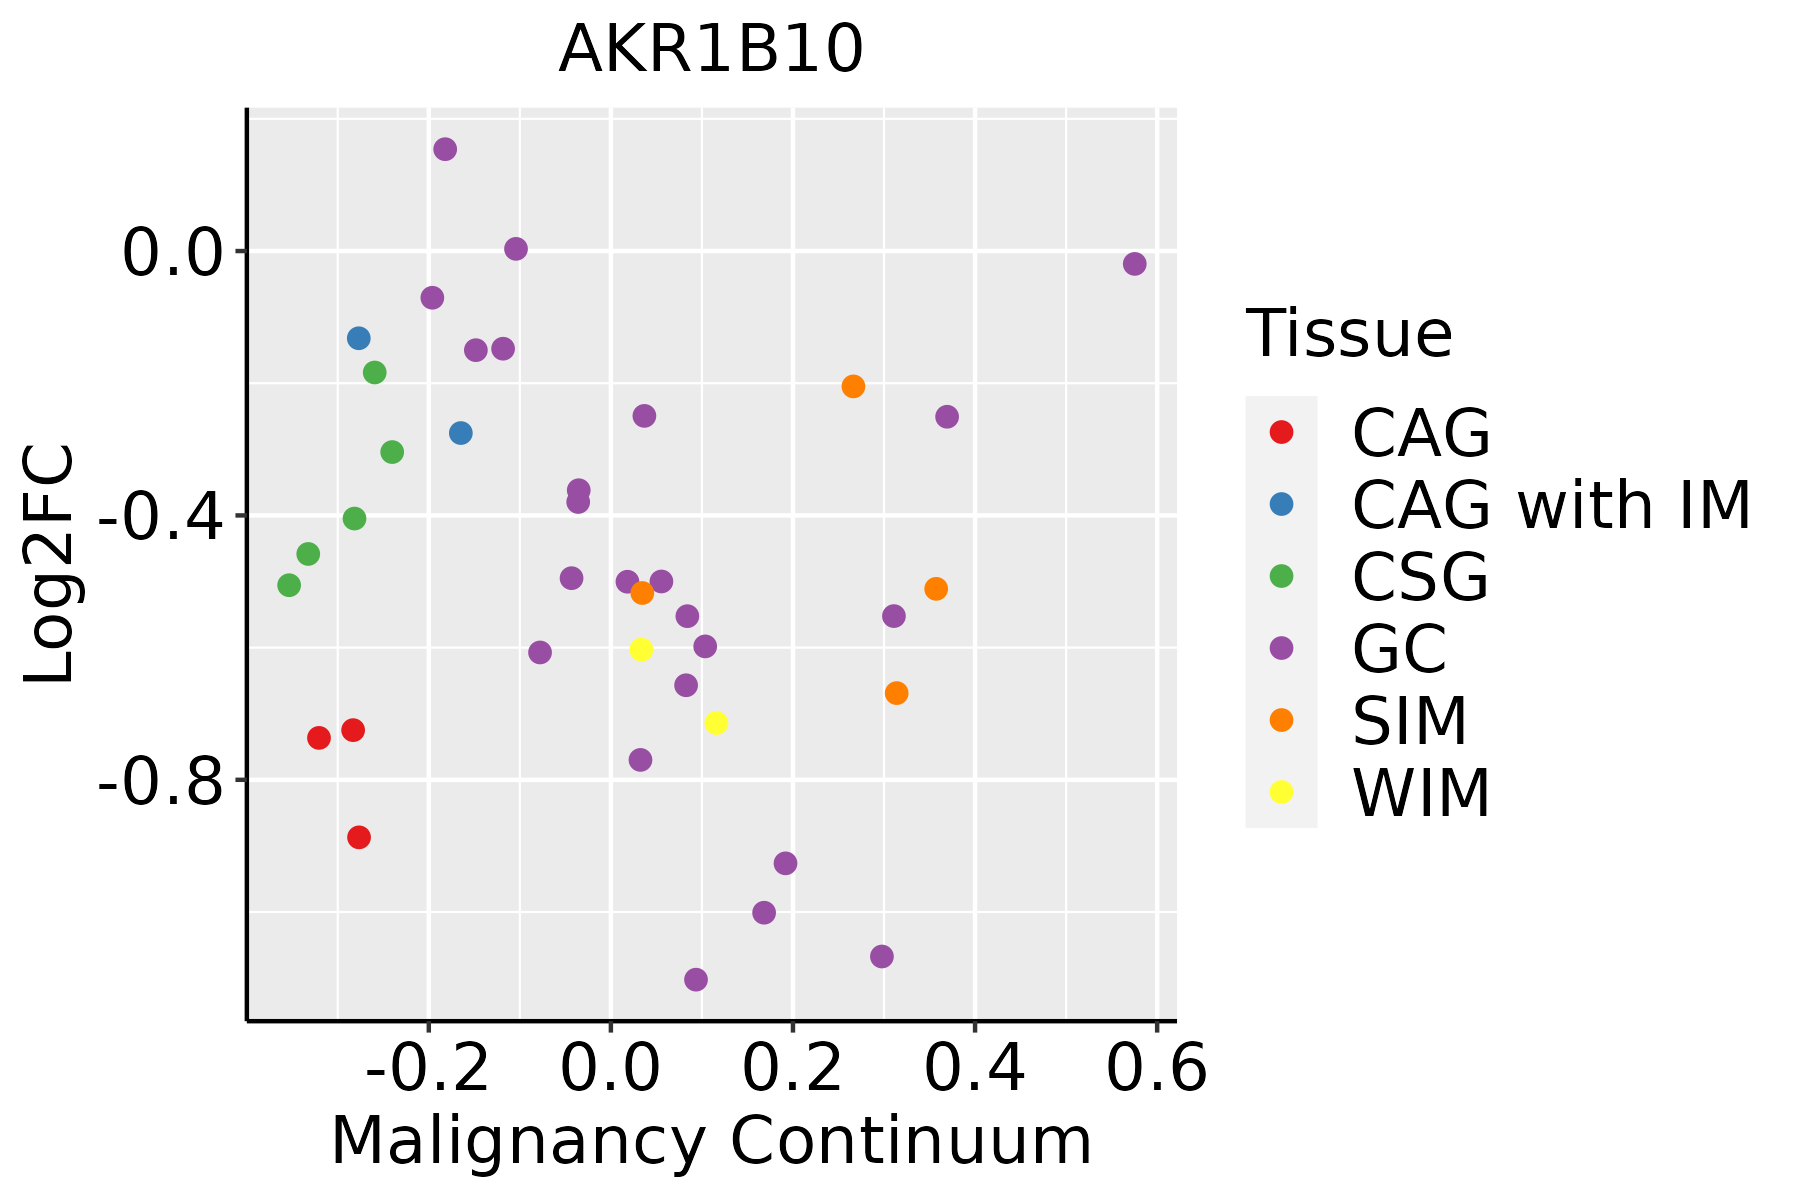 | CAG: Chronic atrophic gastritis |
| CAG with IM: Chronic atrophic gastritis with intestinal metaplasia | ||
| CSG: Chronic superficial gastritis | ||
| GC: Gastric cancer | ||
| SIM: Severe intestinal metaplasia | ||
| WIM: Wild intestinal metaplasia | ||
| Liver | 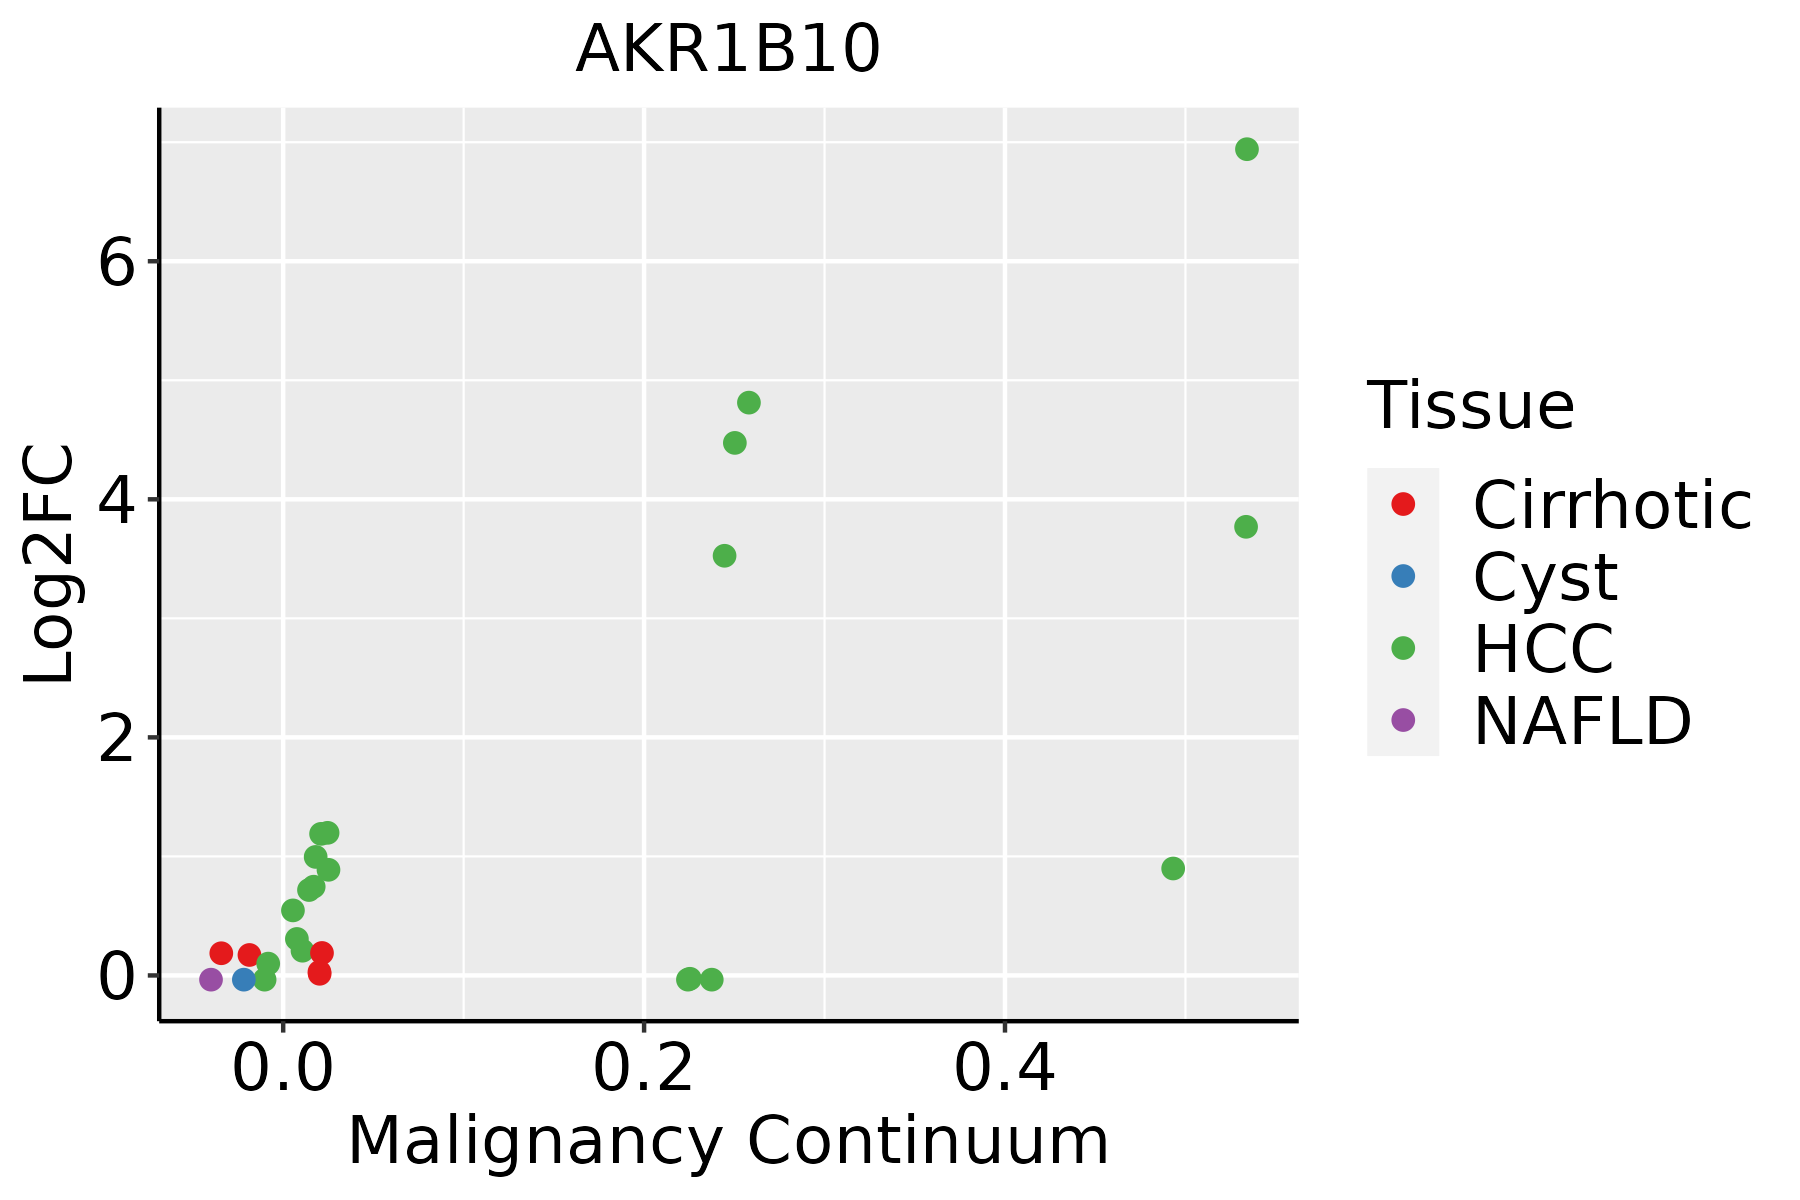 | HCC: Hepatocellular carcinoma |
| NAFLD: Non-alcoholic fatty liver disease | ||
| Oral Cavity | 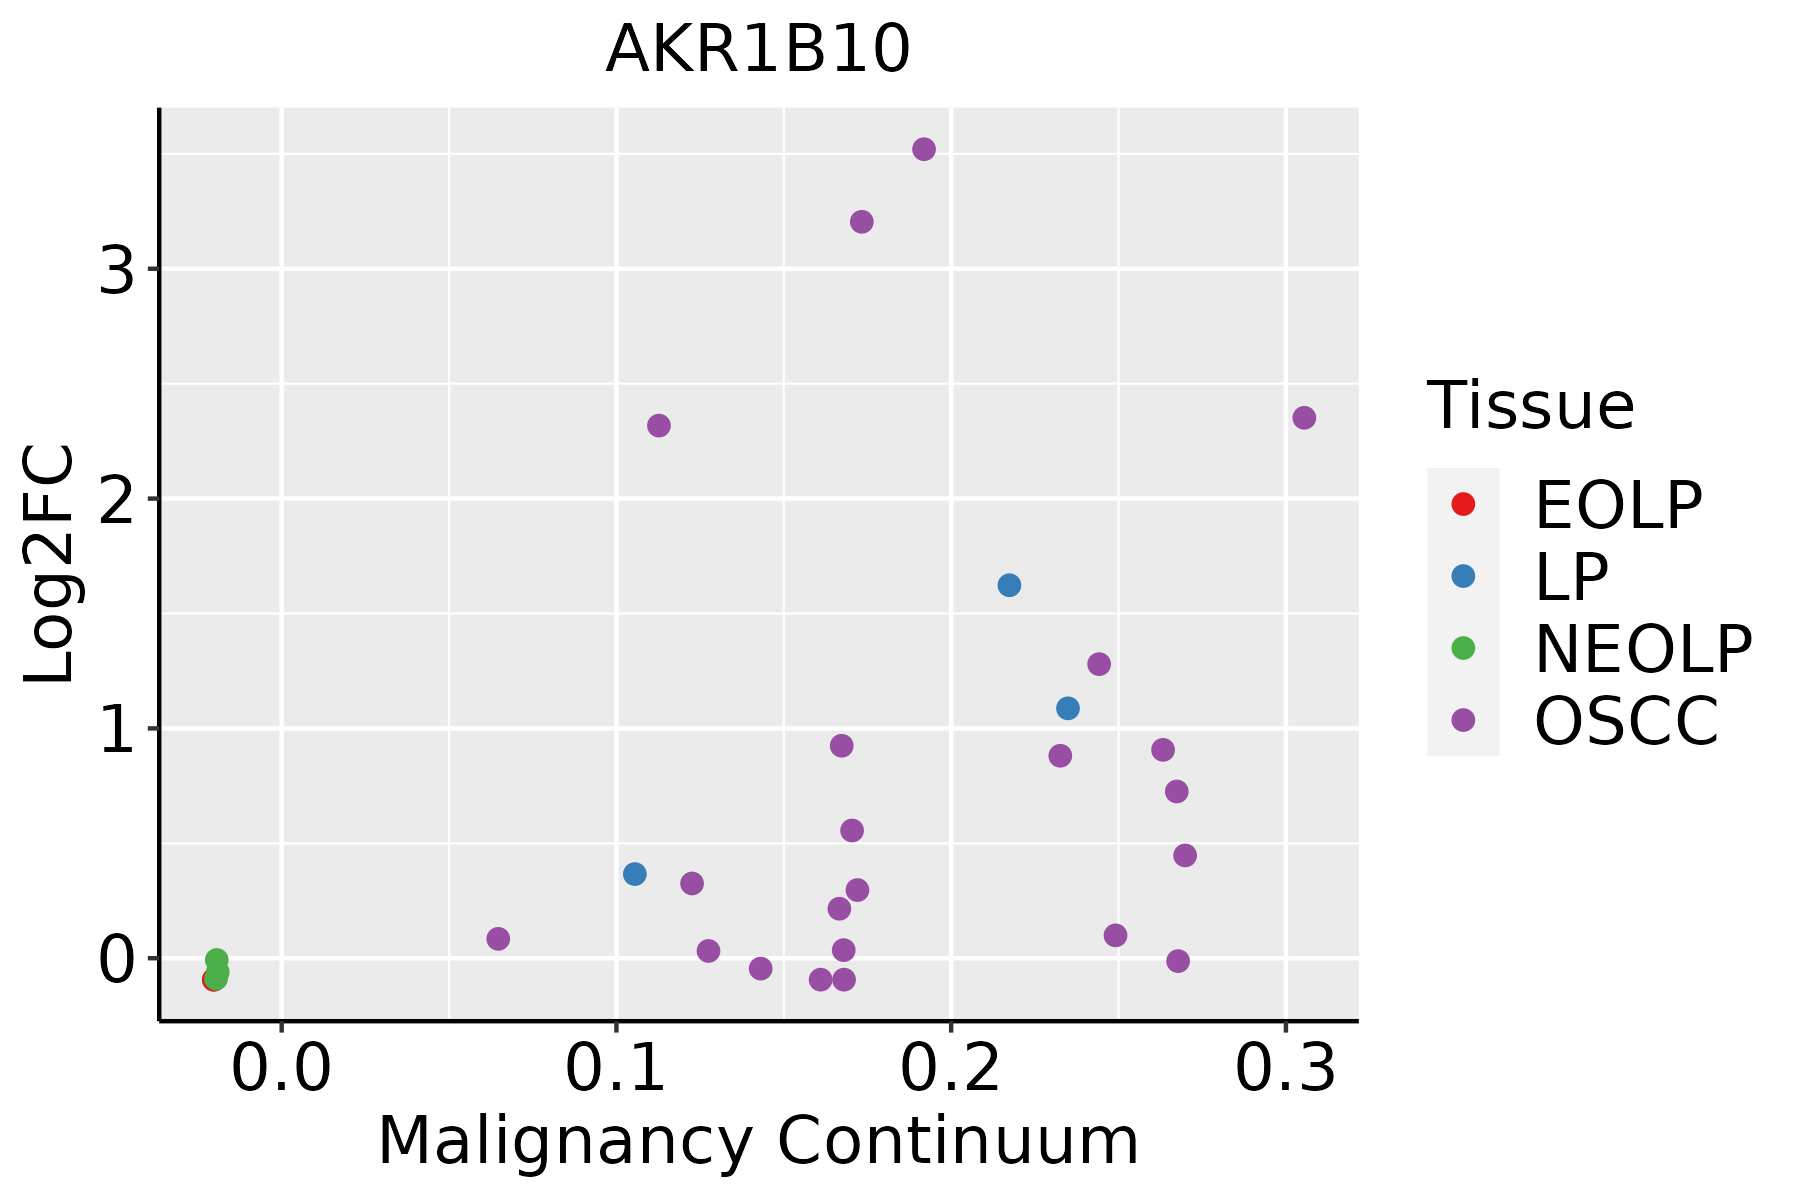 | EOLP: Erosive Oral lichen planus |
| LP: leukoplakia | ||
| NEOLP: Non-erosive oral lichen planus | ||
| OSCC: Oral squamous cell carcinoma | ||
| Skin | 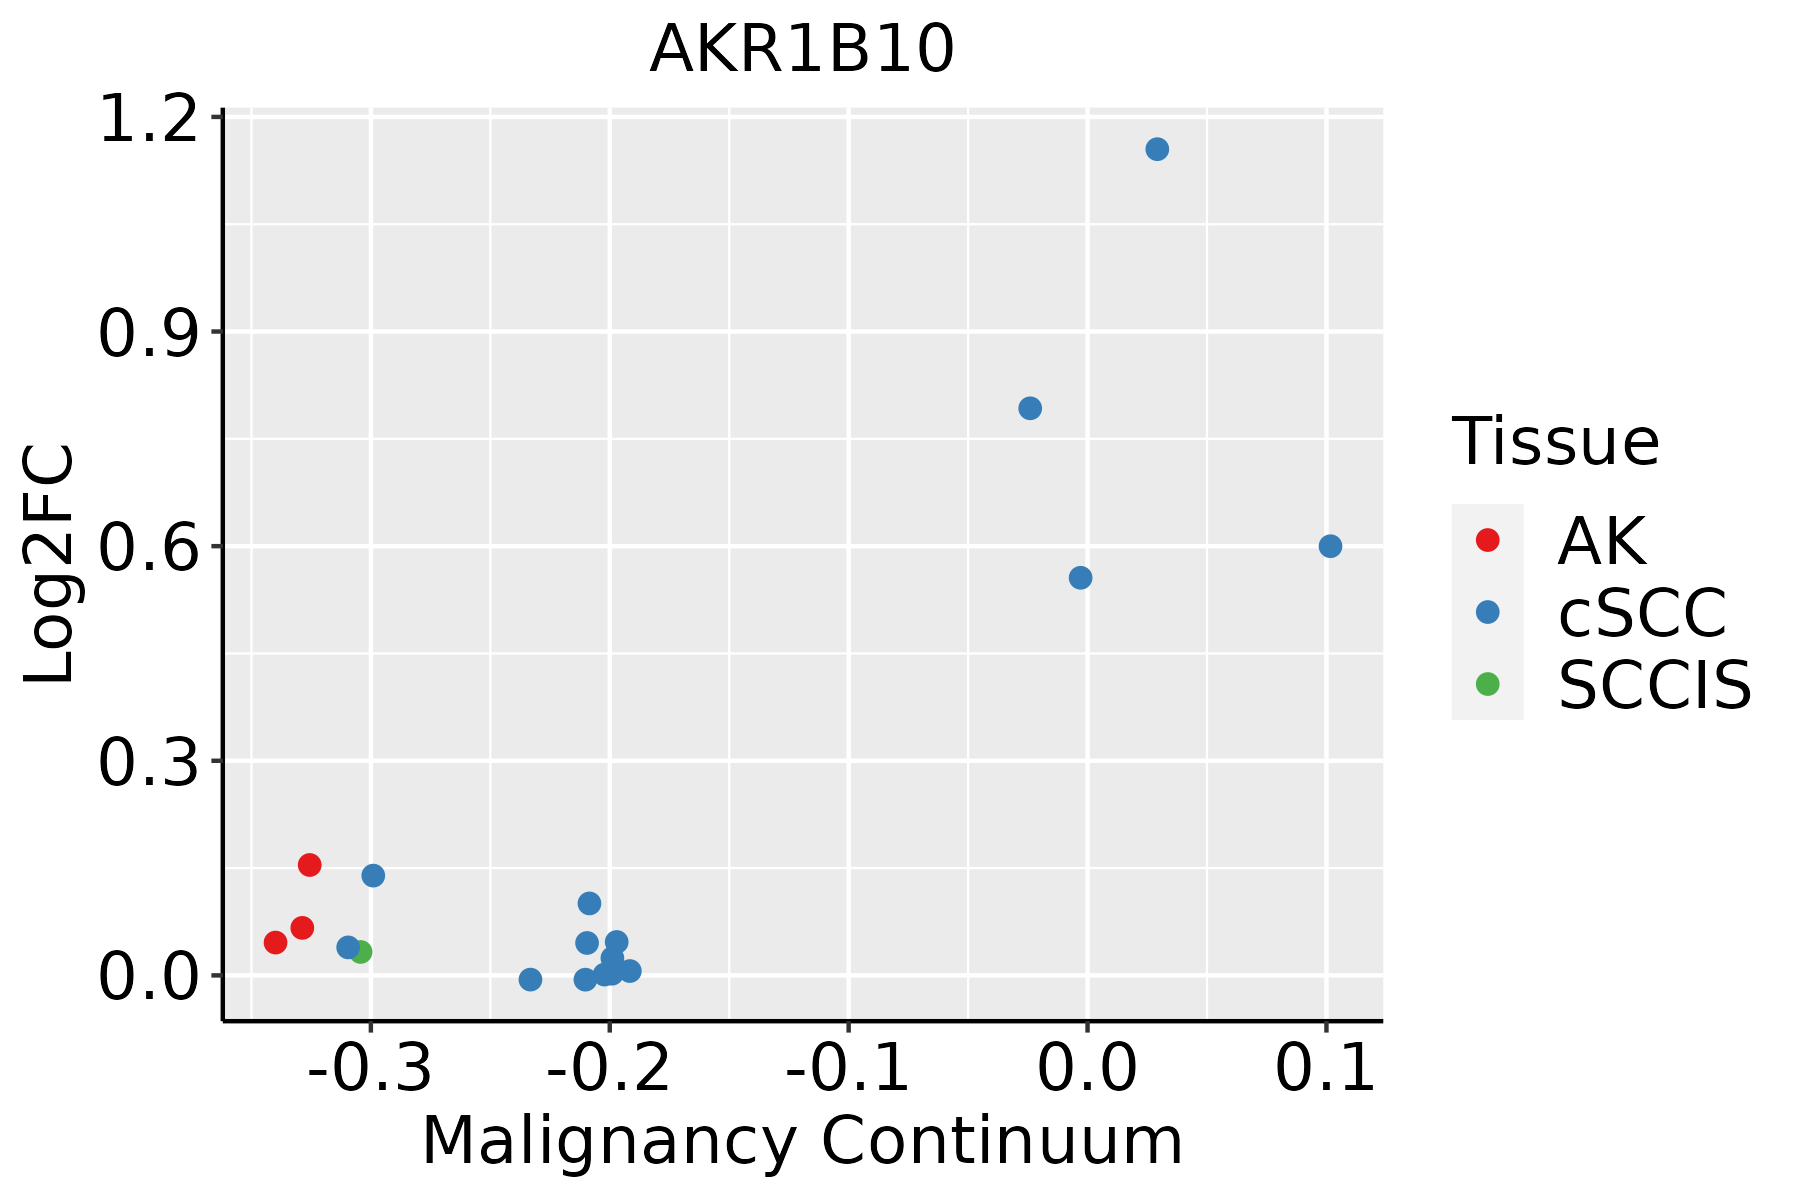 | AK: Actinic keratosis |
| cSCC: Cutaneous squamous cell carcinoma | ||
| SCCIS:squamous cell carcinoma in situ |
| ∗log2FC in expression of this searched gene in stem-like cells from each diseased tissue sample relative to stem-like cells in normal samples in each tissue plotted against the malignancy continuum. Samples are colored based on if they are from different disease stage. |
Top |
Malignant transformation related pathway analysis |
| Find out the enriched GO biological processes and KEGG pathways involved in transition from healthy to precancer to cancer |
| Tissue | Disease Stage | Enriched GO biological Processes |
| Colorectum | AD |  |
| Colorectum | SER |  |
| Colorectum | MSS |  |
| Colorectum | MSI-H |  |
| Colorectum | FAP |  |
| ∗Top 15 enriched GO BP terms are showed in the bar plot of each disease state in each tissue. Each row represents a significant GO biological process which is colored according to the -log10(p.adjust). |
| Page: 1 2 3 4 5 6 7 8 9 |
| GO ID | Tissue | Disease Stage | Description | Gene Ratio | Bg Ratio | pvalue | p.adjust | Count |
| GO:0044282 | Colorectum | AD | small molecule catabolic process | 118/3918 | 376/18723 | 1.05e-06 | 3.55e-05 | 118 |
| GO:0009636 | Colorectum | AD | response to toxic substance | 88/3918 | 262/18723 | 1.12e-06 | 3.72e-05 | 88 |
| GO:0006066 | Colorectum | AD | alcohol metabolic process | 106/3918 | 353/18723 | 3.02e-05 | 5.57e-04 | 106 |
| GO:0016042 | Colorectum | AD | lipid catabolic process | 97/3918 | 320/18723 | 4.31e-05 | 7.56e-04 | 97 |
| GO:0098754 | Colorectum | AD | detoxification | 53/3918 | 152/18723 | 4.63e-05 | 7.98e-04 | 53 |
| GO:0097237 | Colorectum | AD | cellular response to toxic substance | 44/3918 | 124/18723 | 1.24e-04 | 1.80e-03 | 44 |
| GO:1990748 | Colorectum | AD | cellular detoxification | 41/3918 | 116/18723 | 2.29e-04 | 2.97e-03 | 41 |
| GO:0044242 | Colorectum | AD | cellular lipid catabolic process | 66/3918 | 214/18723 | 3.96e-04 | 4.50e-03 | 66 |
| GO:0034310 | Colorectum | AD | primary alcohol catabolic process | 9/3918 | 15/18723 | 1.11e-03 | 1.01e-02 | 9 |
| GO:0034308 | Colorectum | AD | primary alcohol metabolic process | 35/3918 | 102/18723 | 1.16e-03 | 1.05e-02 | 35 |
| GO:0046164 | Colorectum | AD | alcohol catabolic process | 20/3918 | 55/18723 | 6.03e-03 | 3.78e-02 | 20 |
| GO:00096361 | Colorectum | SER | response to toxic substance | 71/2897 | 262/18723 | 8.63e-07 | 4.07e-05 | 71 |
| GO:00972371 | Colorectum | SER | cellular response to toxic substance | 40/2897 | 124/18723 | 2.28e-06 | 9.43e-05 | 40 |
| GO:00987541 | Colorectum | SER | detoxification | 46/2897 | 152/18723 | 3.02e-06 | 1.20e-04 | 46 |
| GO:19907481 | Colorectum | SER | cellular detoxification | 37/2897 | 116/18723 | 7.20e-06 | 2.48e-04 | 37 |
| GO:00160421 | Colorectum | SER | lipid catabolic process | 77/2897 | 320/18723 | 3.52e-05 | 9.18e-04 | 77 |
| GO:00442821 | Colorectum | SER | small molecule catabolic process | 87/2897 | 376/18723 | 5.31e-05 | 1.27e-03 | 87 |
| GO:00060661 | Colorectum | SER | alcohol metabolic process | 79/2897 | 353/18723 | 3.50e-04 | 5.50e-03 | 79 |
| GO:00343101 | Colorectum | SER | primary alcohol catabolic process | 8/2897 | 15/18723 | 7.51e-04 | 9.68e-03 | 8 |
| GO:00442421 | Colorectum | SER | cellular lipid catabolic process | 51/2897 | 214/18723 | 8.60e-04 | 1.05e-02 | 51 |
| Page: 1 2 3 4 5 6 7 8 9 10 |
| Pathway ID | Tissue | Disease Stage | Description | Gene Ratio | Bg Ratio | pvalue | p.adjust | qvalue | Count |
| hsa00051 | Colorectum | AD | Fructose and mannose metabolism | 17/2092 | 34/8465 | 1.25e-03 | 8.02e-03 | 5.12e-03 | 17 |
| hsa00561 | Colorectum | AD | Glycerolipid metabolism | 24/2092 | 63/8465 | 1.25e-02 | 4.54e-02 | 2.90e-02 | 24 |
| hsa000511 | Colorectum | AD | Fructose and mannose metabolism | 17/2092 | 34/8465 | 1.25e-03 | 8.02e-03 | 5.12e-03 | 17 |
| hsa005611 | Colorectum | AD | Glycerolipid metabolism | 24/2092 | 63/8465 | 1.25e-02 | 4.54e-02 | 2.90e-02 | 24 |
| hsa000512 | Esophagus | ESCC | Fructose and mannose metabolism | 24/4205 | 34/8465 | 1.09e-02 | 2.51e-02 | 1.29e-02 | 24 |
| hsa0005111 | Esophagus | ESCC | Fructose and mannose metabolism | 24/4205 | 34/8465 | 1.09e-02 | 2.51e-02 | 1.29e-02 | 24 |
| hsa005615 | Liver | HCC | Glycerolipid metabolism | 41/4020 | 63/8465 | 3.59e-03 | 1.12e-02 | 6.22e-03 | 41 |
| hsa0056112 | Liver | HCC | Glycerolipid metabolism | 41/4020 | 63/8465 | 3.59e-03 | 1.12e-02 | 6.22e-03 | 41 |
| hsa005614 | Stomach | GC | Glycerolipid metabolism | 12/708 | 63/8465 | 5.36e-03 | 3.01e-02 | 2.12e-02 | 12 |
| hsa0056111 | Stomach | GC | Glycerolipid metabolism | 12/708 | 63/8465 | 5.36e-03 | 3.01e-02 | 2.12e-02 | 12 |
| hsa0056121 | Stomach | SIM | Glycerolipid metabolism | 9/465 | 63/8465 | 7.07e-03 | 4.30e-02 | 3.45e-02 | 9 |
| hsa0056131 | Stomach | SIM | Glycerolipid metabolism | 9/465 | 63/8465 | 7.07e-03 | 4.30e-02 | 3.45e-02 | 9 |
| Page: 1 |
Top |
Cell-cell communication analysis |
| Identification of potential cell-cell interactions between two cell types and their ligand-receptor pairs for different disease states |
| Ligand | Receptor | LRpair | Pathway | Tissue | Disease Stage |
| Page: 1 |
Top |
Single-cell gene regulatory network inference analysis |
| Find out the significant the regulons (TFs) and the target genes of each regulon across cell types for different disease states |
| TF | Cell Type | Tissue | Disease Stage | Target Gene | RSS | Regulon Activity |
| ∗The dot plots of a searched regulon are shown for all cell subpopulations in each disease state of each tissue based on the regulon specific score inferred using pySCENIC and by calculating the average expression. |
| Page: 1 |
Top |
Somatic mutation of malignant transformation related genes |
| Annotation of somatic variants for genes involved in malignant transformation |
| Hugo Symbol | Variant Class | Variant Classification | dbSNP RS | HGVSc | HGVSp | HGVSp Short | SWISSPROT | BIOTYPE | SIFT | PolyPhen | Tumor Sample Barcode | Tissue | Histology | Sex | Age | Stage | Therapy Types | Drugs | Outcome |
| AKR1B10 | SNV | Missense_Mutation | c.116N>A | p.Gly39Glu | p.G39E | O60218 | protein_coding | deleterious(0) | possibly_damaging(0.609) | TCGA-BH-A18P-01 | Breast | breast invasive carcinoma | Female | <65 | I/II | Unknown | Unknown | PD | |
| AKR1B10 | SNV | Missense_Mutation | rs781593224 | c.914N>G | p.Ser305Cys | p.S305C | O60218 | protein_coding | tolerated(0.06) | benign(0.089) | TCGA-MA-AA3Z-01 | Cervix | cervical & endocervical cancer | Female | <65 | I/II | Unknown | Unknown | SD |
| AKR1B10 | SNV | Missense_Mutation | c.181N>C | p.Glu61Gln | p.E61Q | O60218 | protein_coding | tolerated(0.35) | benign(0.067) | TCGA-VS-A958-01 | Cervix | cervical & endocervical cancer | Female | <65 | I/II | Chemotherapy | cisplatin | CR | |
| AKR1B10 | SNV | Missense_Mutation | rs373551927 | c.582N>T | p.Glu194Asp | p.E194D | O60218 | protein_coding | tolerated(0.07) | benign(0.073) | TCGA-AA-3510-01 | Colorectum | colon adenocarcinoma | Male | >=65 | I/II | Unknown | Unknown | SD |
| AKR1B10 | SNV | Missense_Mutation | novel | c.856N>C | p.Met286Leu | p.M286L | O60218 | protein_coding | deleterious(0.03) | benign(0.302) | TCGA-AA-3855-01 | Colorectum | colon adenocarcinoma | Male | >=65 | I/II | Unknown | Unknown | SD |
| AKR1B10 | SNV | Missense_Mutation | rs563438026 | c.911N>T | p.Ser304Phe | p.S304F | O60218 | protein_coding | tolerated(0.31) | benign(0.033) | TCGA-AZ-4315-01 | Colorectum | colon adenocarcinoma | Male | <65 | I/II | Unknown | Unknown | SD |
| AKR1B10 | SNV | Missense_Mutation | novel | c.80A>C | p.Lys27Thr | p.K27T | O60218 | protein_coding | tolerated(0.09) | benign(0.348) | TCGA-CA-6717-01 | Colorectum | colon adenocarcinoma | Male | <65 | I/II | Chemotherapy | oxaliplatin | CR |
| AKR1B10 | SNV | Missense_Mutation | c.388A>T | p.Asn130Tyr | p.N130Y | O60218 | protein_coding | deleterious(0.02) | benign(0.37) | TCGA-CM-5861-01 | Colorectum | colon adenocarcinoma | Female | <65 | I/II | Unknown | Unknown | PD | |
| AKR1B10 | SNV | Missense_Mutation | c.823C>A | p.Gln275Lys | p.Q275K | O60218 | protein_coding | tolerated(0.42) | benign(0.096) | TCGA-DM-A1DB-01 | Colorectum | colon adenocarcinoma | Male | >=65 | I/II | Unknown | Unknown | SD | |
| AKR1B10 | SNV | Missense_Mutation | novel | c.313C>A | p.Leu105Met | p.L105M | O60218 | protein_coding | deleterious(0.03) | probably_damaging(0.966) | TCGA-F5-6814-01 | Colorectum | rectum adenocarcinoma | Male | <65 | I/II | Unknown | Unknown | SD |
| Page: 1 2 3 4 |
Top |
Related drugs of malignant transformation related genes |
| Identification of chemicals and drugs interact with genes involved in malignant transfromation |
| (DGIdb 4.0) |
| Entrez ID | Symbol | Category | Interaction Types | Drug Claim Name | Drug Name | PMIDs |
| 57016 | AKR1B10 | DRUGGABLE GENOME, ENZYME | TOLRESTAT | TOLRESTAT | 21561086 | |
| 57016 | AKR1B10 | DRUGGABLE GENOME, ENZYME | OLEANOLIC_ACID | OLEANOLIC_ACID | 21561086 | |
| 57016 | AKR1B10 | DRUGGABLE GENOME, ENZYME | URSOLIC ACID | URSOLIC ACID | 21561086 | |
| 57016 | AKR1B10 | DRUGGABLE GENOME, ENZYME | ENOXOLONE | ENOXOLONE | 21561086 |
| Page: 1 |

Copyright 2023-Present -The University of Texas Health Science Center at Houston |