
|
|||||
|
 | |
| |
| |
| |
| |
| |
|
Gene: AKR1B1 |
Gene summary for AKR1B1 |
| Gene information | Species | Human | Gene symbol | AKR1B1 | Gene ID | 231 |
| Gene name | aldo-keto reductase family 1 member B | |
| Gene Alias | ADR | |
| Cytomap | 7q33 | |
| Gene Type | protein-coding | GO ID | GO:0000003 | UniProtAcc | A0A024R7A8 |
Top |
Malignant transformation analysis |
| Identification of the aberrant gene expression in precancerous and cancerous lesions by comparing the gene expression of stem-like cells in diseased tissues with normal stem cells |
| Entrez ID | Symbol | Replicates | Species | Organ | Tissue | Adj P-value | Log2FC | Malignancy |
| 231 | AKR1B1 | LZE2T | Human | Esophagus | ESCC | 1.51e-02 | 1.09e+00 | 0.082 |
| 231 | AKR1B1 | LZE4T | Human | Esophagus | ESCC | 6.20e-11 | 7.88e-01 | 0.0811 |
| 231 | AKR1B1 | LZE7T | Human | Esophagus | ESCC | 1.51e-10 | 1.05e+00 | 0.0667 |
| 231 | AKR1B1 | LZE22T | Human | Esophagus | ESCC | 3.10e-04 | 1.26e+00 | 0.068 |
| 231 | AKR1B1 | LZE24T | Human | Esophagus | ESCC | 6.70e-07 | 3.99e-01 | 0.0596 |
| 231 | AKR1B1 | LZE6T | Human | Esophagus | ESCC | 4.25e-05 | 5.32e-01 | 0.0845 |
| 231 | AKR1B1 | P1T-E | Human | Esophagus | ESCC | 4.15e-04 | 7.21e-01 | 0.0875 |
| 231 | AKR1B1 | P2T-E | Human | Esophagus | ESCC | 5.73e-42 | 8.95e-01 | 0.1177 |
| 231 | AKR1B1 | P4T-E | Human | Esophagus | ESCC | 2.55e-50 | 1.54e+00 | 0.1323 |
| 231 | AKR1B1 | P5T-E | Human | Esophagus | ESCC | 1.40e-33 | 9.45e-01 | 0.1327 |
| 231 | AKR1B1 | P8T-E | Human | Esophagus | ESCC | 6.61e-14 | 4.60e-01 | 0.0889 |
| 231 | AKR1B1 | P9T-E | Human | Esophagus | ESCC | 1.14e-44 | 1.47e+00 | 0.1131 |
| 231 | AKR1B1 | P10T-E | Human | Esophagus | ESCC | 5.64e-45 | 9.44e-01 | 0.116 |
| 231 | AKR1B1 | P11T-E | Human | Esophagus | ESCC | 1.02e-13 | 7.17e-01 | 0.1426 |
| 231 | AKR1B1 | P12T-E | Human | Esophagus | ESCC | 2.64e-59 | 1.44e+00 | 0.1122 |
| 231 | AKR1B1 | P15T-E | Human | Esophagus | ESCC | 1.99e-29 | 1.16e+00 | 0.1149 |
| 231 | AKR1B1 | P16T-E | Human | Esophagus | ESCC | 4.41e-36 | 7.11e-01 | 0.1153 |
| 231 | AKR1B1 | P17T-E | Human | Esophagus | ESCC | 2.89e-07 | 4.68e-01 | 0.1278 |
| 231 | AKR1B1 | P19T-E | Human | Esophagus | ESCC | 4.77e-12 | 1.40e+00 | 0.1662 |
| 231 | AKR1B1 | P20T-E | Human | Esophagus | ESCC | 3.62e-12 | 5.33e-01 | 0.1124 |
| Page: 1 2 3 4 5 |
| Tissue | Expression Dynamics | Abbreviation |
| Esophagus | 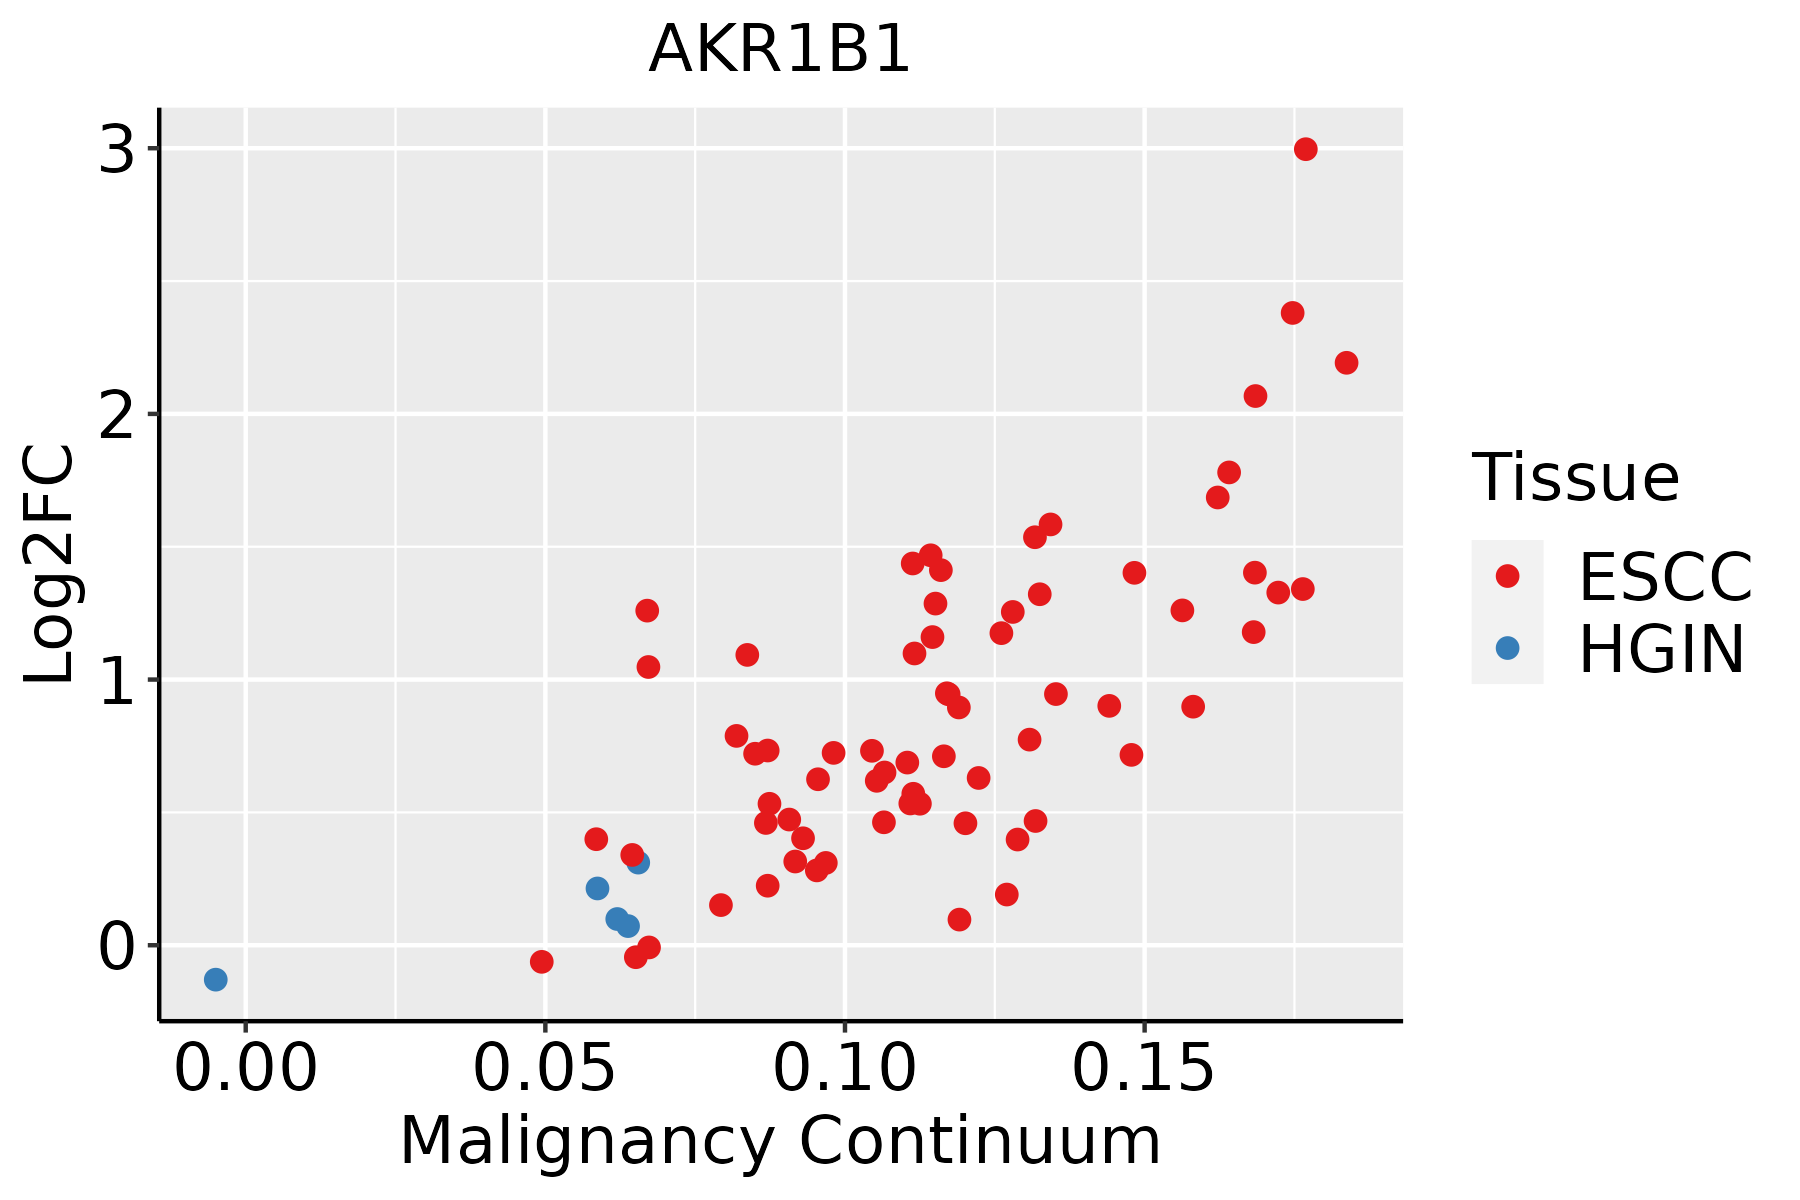 | ESCC: Esophageal squamous cell carcinoma |
| HGIN: High-grade intraepithelial neoplasias | ||
| LGIN: Low-grade intraepithelial neoplasias | ||
| Oral Cavity | 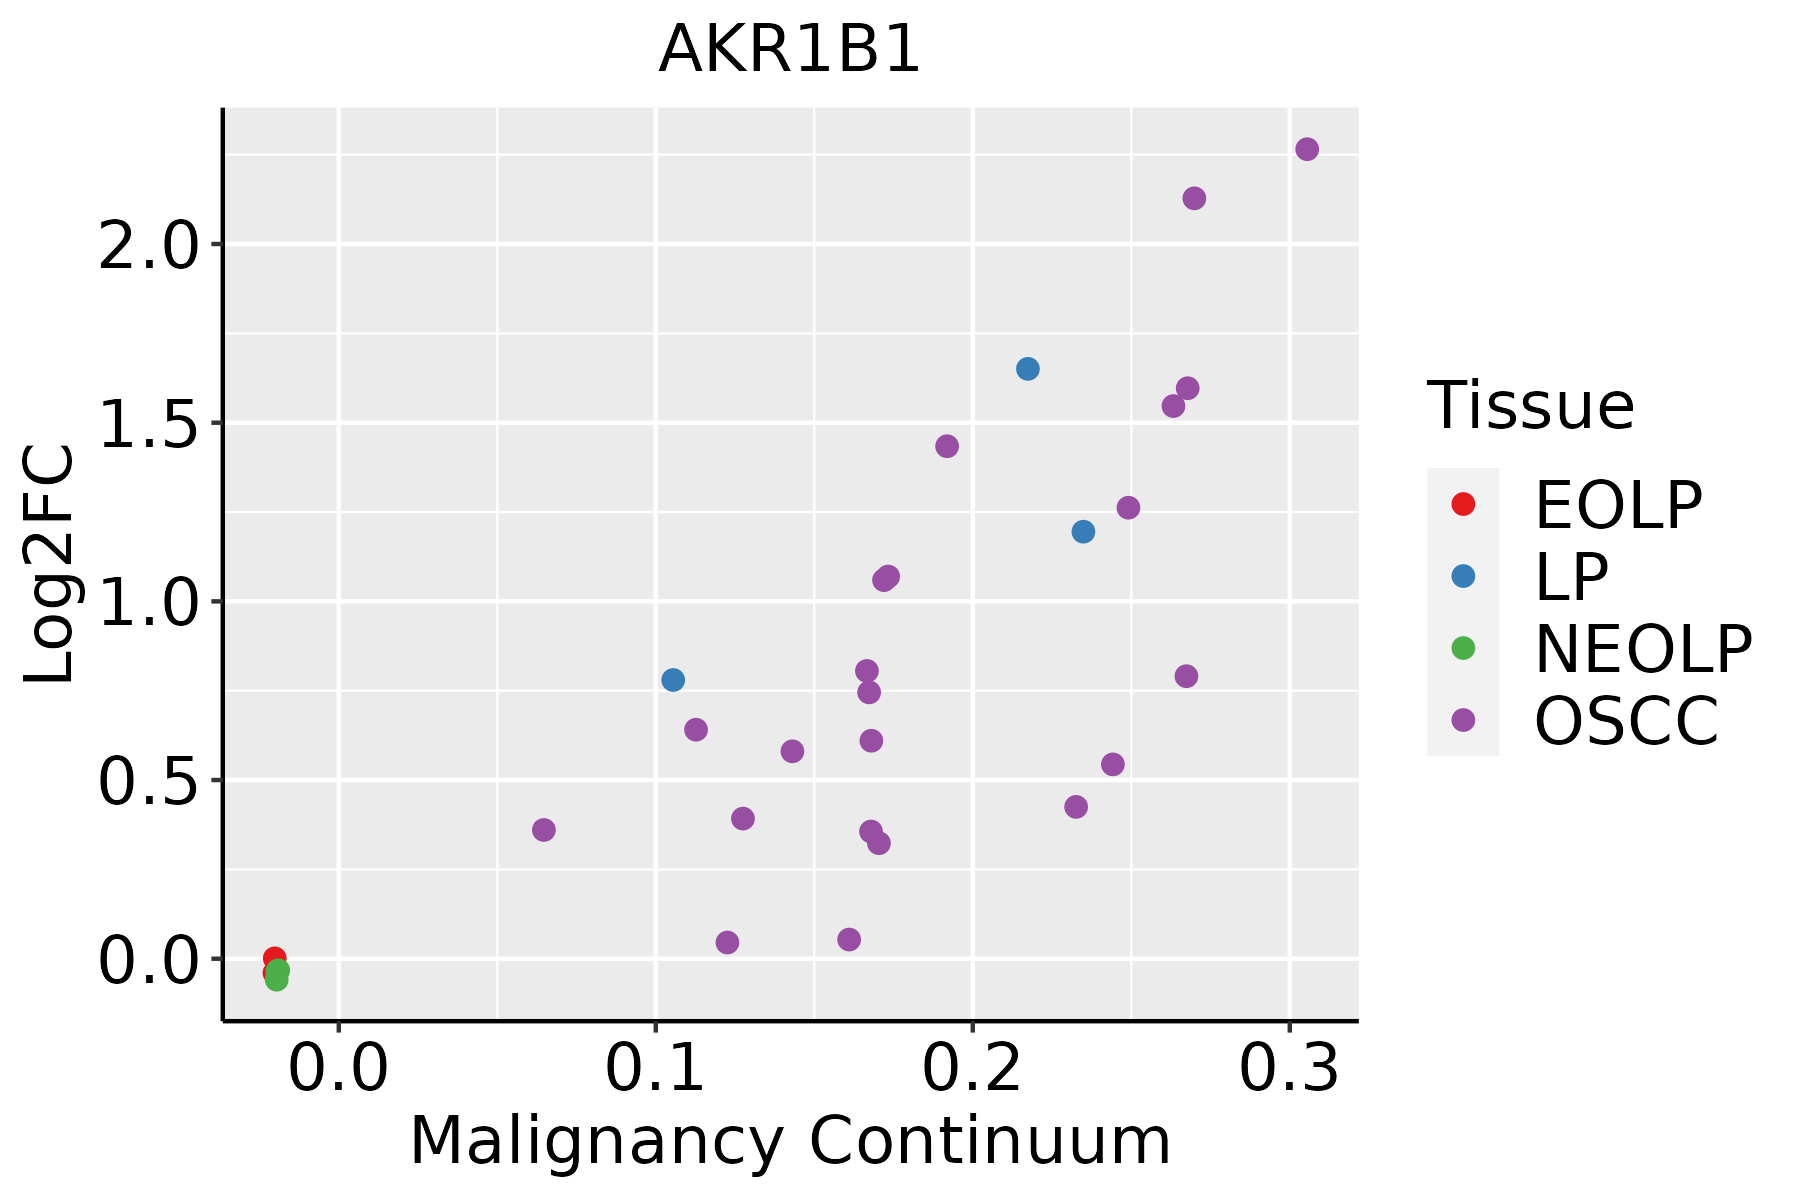 | EOLP: Erosive Oral lichen planus |
| LP: leukoplakia | ||
| NEOLP: Non-erosive oral lichen planus | ||
| OSCC: Oral squamous cell carcinoma | ||
| Skin | 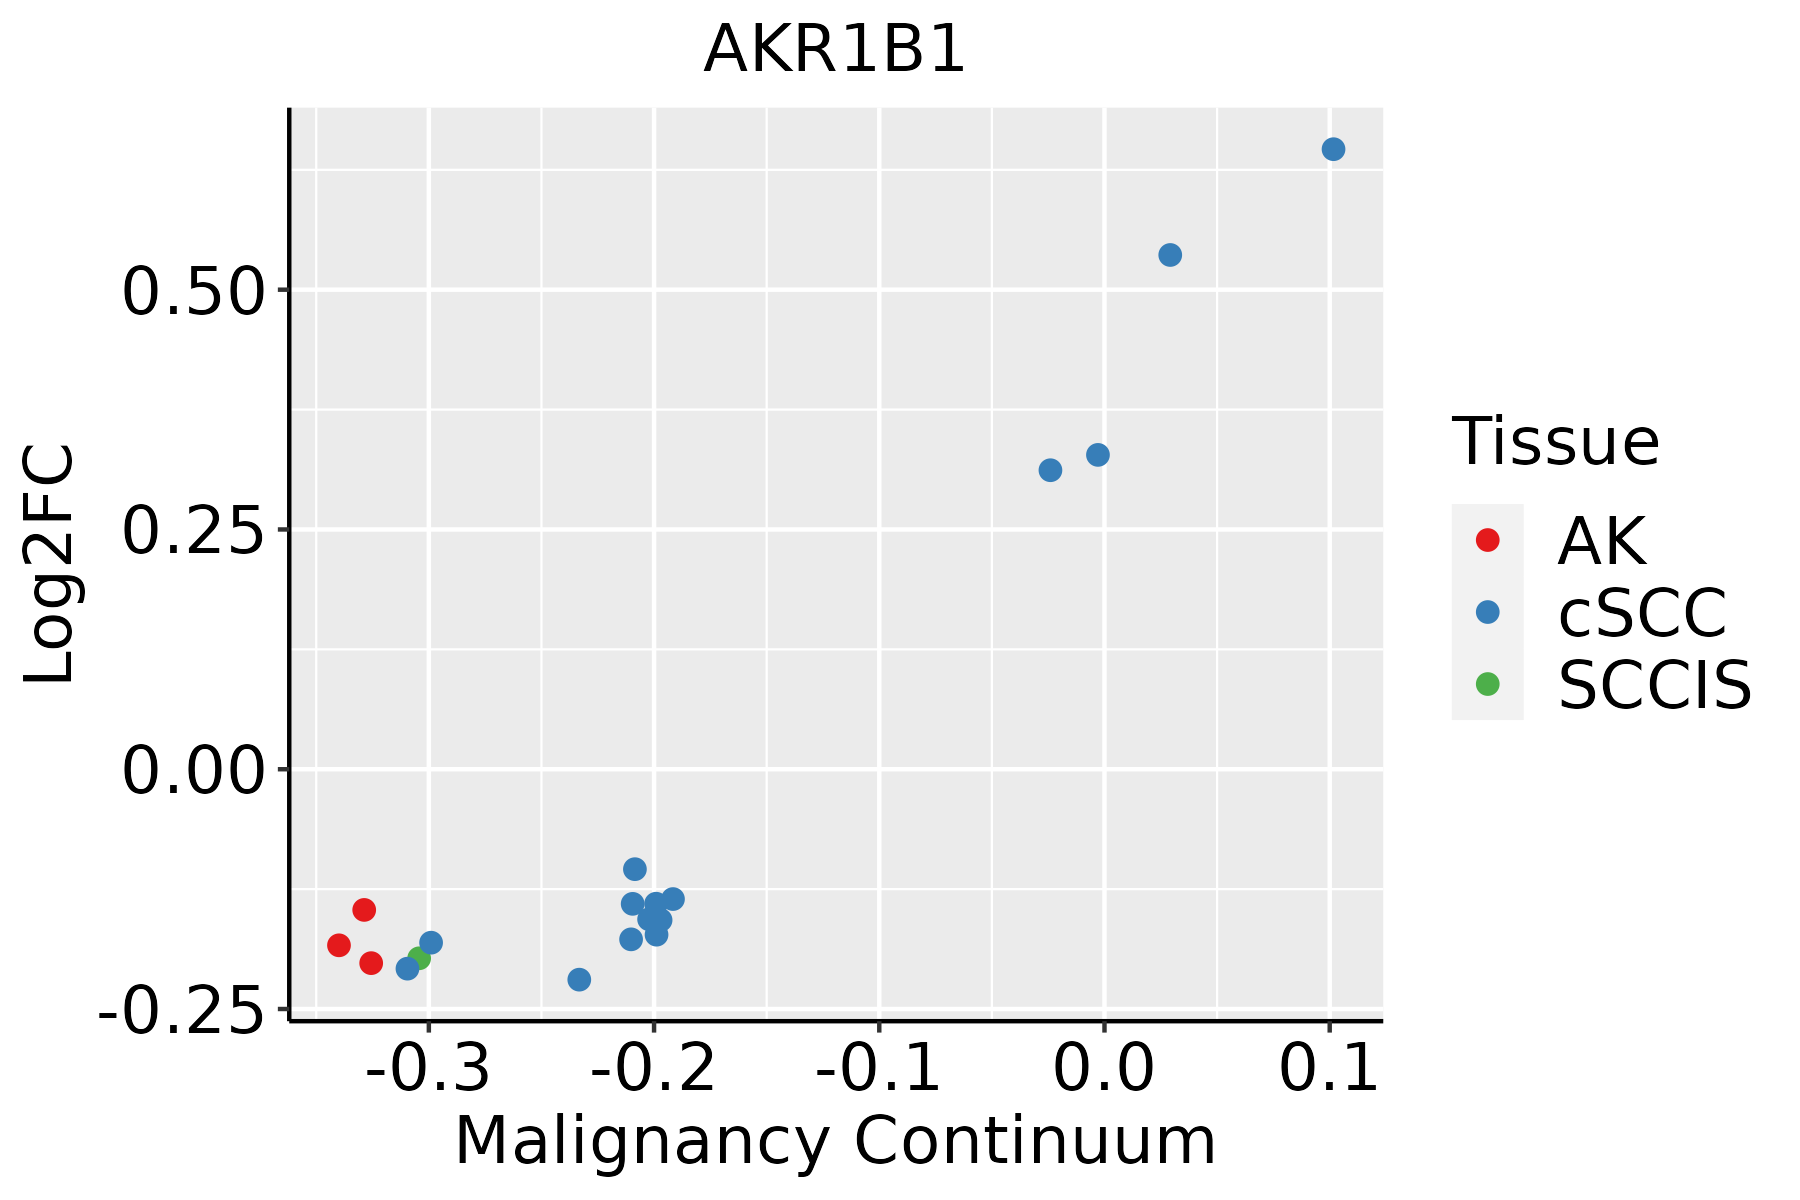 | AK: Actinic keratosis |
| cSCC: Cutaneous squamous cell carcinoma | ||
| SCCIS:squamous cell carcinoma in situ | ||
| Thyroid | 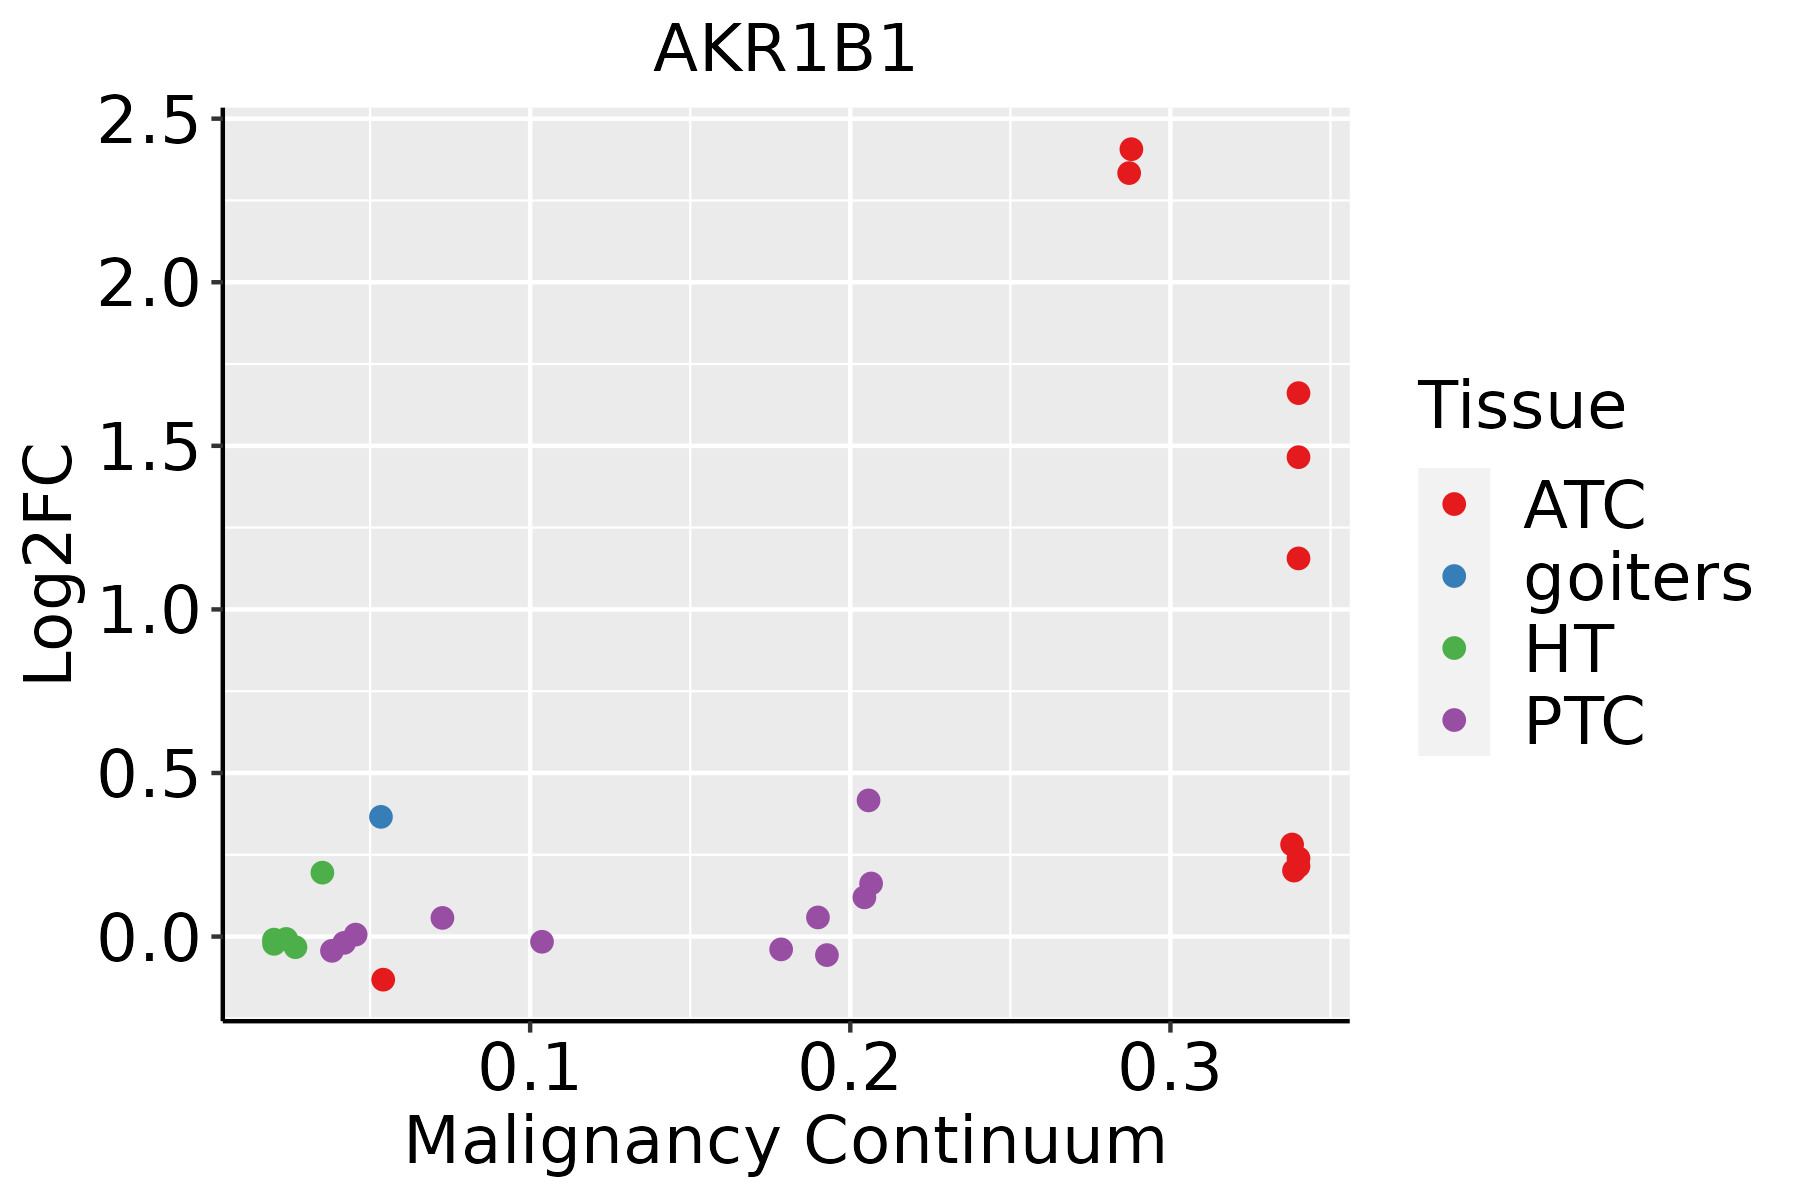 | ATC: Anaplastic thyroid cancer |
| HT: Hashimoto's thyroiditis | ||
| PTC: Papillary thyroid cancer |
| ∗log2FC in expression of this searched gene in stem-like cells from each diseased tissue sample relative to stem-like cells in normal samples in each tissue plotted against the malignancy continuum. Samples are colored based on if they are from different disease stage. |
Top |
Malignant transformation related pathway analysis |
| Find out the enriched GO biological processes and KEGG pathways involved in transition from healthy to precancer to cancer |
| Tissue | Disease Stage | Enriched GO biological Processes |
| Colorectum | AD |  |
| Colorectum | SER |  |
| Colorectum | MSS |  |
| Colorectum | MSI-H |  |
| Colorectum | FAP |  |
| ∗Top 15 enriched GO BP terms are showed in the bar plot of each disease state in each tissue. Each row represents a significant GO biological process which is colored according to the -log10(p.adjust). |
| Page: 1 2 3 4 5 6 7 8 9 |
| GO ID | Tissue | Disease Stage | Description | Gene Ratio | Bg Ratio | pvalue | p.adjust | Count |
| GO:0044282 | Colorectum | AD | small molecule catabolic process | 118/3918 | 376/18723 | 1.05e-06 | 3.55e-05 | 118 |
| GO:0009636 | Colorectum | AD | response to toxic substance | 88/3918 | 262/18723 | 1.12e-06 | 3.72e-05 | 88 |
| GO:0006066 | Colorectum | AD | alcohol metabolic process | 106/3918 | 353/18723 | 3.02e-05 | 5.57e-04 | 106 |
| GO:0016042 | Colorectum | AD | lipid catabolic process | 97/3918 | 320/18723 | 4.31e-05 | 7.56e-04 | 97 |
| GO:0098754 | Colorectum | AD | detoxification | 53/3918 | 152/18723 | 4.63e-05 | 7.98e-04 | 53 |
| GO:0097237 | Colorectum | AD | cellular response to toxic substance | 44/3918 | 124/18723 | 1.24e-04 | 1.80e-03 | 44 |
| GO:1990748 | Colorectum | AD | cellular detoxification | 41/3918 | 116/18723 | 2.29e-04 | 2.97e-03 | 41 |
| GO:0044242 | Colorectum | AD | cellular lipid catabolic process | 66/3918 | 214/18723 | 3.96e-04 | 4.50e-03 | 66 |
| GO:0034310 | Colorectum | AD | primary alcohol catabolic process | 9/3918 | 15/18723 | 1.11e-03 | 1.01e-02 | 9 |
| GO:0034308 | Colorectum | AD | primary alcohol metabolic process | 35/3918 | 102/18723 | 1.16e-03 | 1.05e-02 | 35 |
| GO:0046164 | Colorectum | AD | alcohol catabolic process | 20/3918 | 55/18723 | 6.03e-03 | 3.78e-02 | 20 |
| GO:00096361 | Colorectum | SER | response to toxic substance | 71/2897 | 262/18723 | 8.63e-07 | 4.07e-05 | 71 |
| GO:00972371 | Colorectum | SER | cellular response to toxic substance | 40/2897 | 124/18723 | 2.28e-06 | 9.43e-05 | 40 |
| GO:00987541 | Colorectum | SER | detoxification | 46/2897 | 152/18723 | 3.02e-06 | 1.20e-04 | 46 |
| GO:19907481 | Colorectum | SER | cellular detoxification | 37/2897 | 116/18723 | 7.20e-06 | 2.48e-04 | 37 |
| GO:00160421 | Colorectum | SER | lipid catabolic process | 77/2897 | 320/18723 | 3.52e-05 | 9.18e-04 | 77 |
| GO:00442821 | Colorectum | SER | small molecule catabolic process | 87/2897 | 376/18723 | 5.31e-05 | 1.27e-03 | 87 |
| GO:00060661 | Colorectum | SER | alcohol metabolic process | 79/2897 | 353/18723 | 3.50e-04 | 5.50e-03 | 79 |
| GO:00343101 | Colorectum | SER | primary alcohol catabolic process | 8/2897 | 15/18723 | 7.51e-04 | 9.68e-03 | 8 |
| GO:00442421 | Colorectum | SER | cellular lipid catabolic process | 51/2897 | 214/18723 | 8.60e-04 | 1.05e-02 | 51 |
| Page: 1 2 3 4 5 6 7 8 9 10 11 12 13 14 15 16 17 18 |
| Pathway ID | Tissue | Disease Stage | Description | Gene Ratio | Bg Ratio | pvalue | p.adjust | qvalue | Count |
| Page: 1 |
Top |
Cell-cell communication analysis |
| Identification of potential cell-cell interactions between two cell types and their ligand-receptor pairs for different disease states |
| Ligand | Receptor | LRpair | Pathway | Tissue | Disease Stage |
| Page: 1 |
Top |
Single-cell gene regulatory network inference analysis |
| Find out the significant the regulons (TFs) and the target genes of each regulon across cell types for different disease states |
| TF | Cell Type | Tissue | Disease Stage | Target Gene | RSS | Regulon Activity |
| ∗The dot plots of a searched regulon are shown for all cell subpopulations in each disease state of each tissue based on the regulon specific score inferred using pySCENIC and by calculating the average expression. |
| Page: 1 |
Top |
Somatic mutation of malignant transformation related genes |
| Annotation of somatic variants for genes involved in malignant transformation |
| Hugo Symbol | Variant Class | Variant Classification | dbSNP RS | HGVSc | HGVSp | HGVSp Short | SWISSPROT | BIOTYPE | SIFT | PolyPhen | Tumor Sample Barcode | Tissue | Histology | Sex | Age | Stage | Therapy Types | Drugs | Outcome |
| AKR1B1 | SNV | Missense_Mutation | novel | c.551A>T | p.Gln184Leu | p.Q184L | P15121 | protein_coding | deleterious(0) | probably_damaging(1) | TCGA-A2-A0YG-01 | Breast | breast invasive carcinoma | Female | <65 | III/IV | Chemotherapy | cytoxan | SD |
| AKR1B1 | SNV | Missense_Mutation | rs770727307 | c.874T>C | p.Tyr292His | p.Y292H | P15121 | protein_coding | deleterious(0) | probably_damaging(0.928) | TCGA-A8-A08R-01 | Breast | breast invasive carcinoma | Female | <65 | I/II | Unknown | Unknown | SD |
| AKR1B1 | SNV | Missense_Mutation | c.591N>G | p.Ile197Met | p.I197M | P15121 | protein_coding | deleterious(0.01) | possibly_damaging(0.907) | TCGA-C5-A1BQ-01 | Cervix | cervical & endocervical cancer | Female | >=65 | III/IV | Chemotherapy | cisplatin | CR | |
| AKR1B1 | SNV | Missense_Mutation | c.806N>A | p.Arg269His | p.R269H | P15121 | protein_coding | tolerated(0.18) | benign(0.014) | TCGA-AA-3864-01 | Colorectum | colon adenocarcinoma | Male | >=65 | I/II | Unknown | Unknown | SD | |
| AKR1B1 | SNV | Missense_Mutation | novel | c.781A>T | p.Ile261Phe | p.I261F | P15121 | protein_coding | deleterious(0) | probably_damaging(0.994) | TCGA-AA-3949-01 | Colorectum | colon adenocarcinoma | Female | >=65 | III/IV | Unknown | Unknown | SD |
| AKR1B1 | SNV | Missense_Mutation | novel | c.858N>T | p.Met286Ile | p.M286I | P15121 | protein_coding | tolerated(0.15) | possibly_damaging(0.476) | TCGA-AA-A010-01 | Colorectum | colon adenocarcinoma | Female | <65 | I/II | Chemotherapy | folinic | CR |
| AKR1B1 | SNV | Missense_Mutation | c.122N>A | p.Arg41His | p.R41H | P15121 | protein_coding | tolerated(0.1) | benign(0.014) | TCGA-CK-4951-01 | Colorectum | colon adenocarcinoma | Female | >=65 | I/II | Unknown | Unknown | PD | |
| AKR1B1 | SNV | Missense_Mutation | rs755184764 | c.899N>T | p.Ala300Val | p.A300V | P15121 | protein_coding | tolerated(0.21) | benign(0.001) | TCGA-D5-6530-01 | Colorectum | colon adenocarcinoma | Male | <65 | I/II | Unknown | Unknown | SD |
| AKR1B1 | SNV | Missense_Mutation | rs577826776 | c.29G>A | p.Gly10Asp | p.G10D | P15121 | protein_coding | deleterious(0.02) | benign(0.278) | TCGA-NH-A5IV-01 | Colorectum | colon adenocarcinoma | Female | >=65 | I/II | Unknown | Unknown | SD |
| AKR1B1 | SNV | Missense_Mutation | novel | c.816G>T | p.Glu272Asp | p.E272D | P15121 | protein_coding | deleterious(0.02) | benign(0.029) | TCGA-AG-A002-01 | Colorectum | rectum adenocarcinoma | Male | <65 | I/II | Unknown | Unknown | SD |
| Page: 1 2 3 4 |
Top |
Related drugs of malignant transformation related genes |
| Identification of chemicals and drugs interact with genes involved in malignant transfromation |
| (DGIdb 4.0) |
| Entrez ID | Symbol | Category | Interaction Types | Drug Claim Name | Drug Name | PMIDs |
| 231 | AKR1B1 | DRUGGABLE GENOME, ENZYME | Ovine corticotropin-releasing hormone | |||
| 231 | AKR1B1 | DRUGGABLE GENOME, ENZYME | QR-333 | |||
| 231 | AKR1B1 | DRUGGABLE GENOME, ENZYME | inhibitor | 178103983 | LIDORESTAT | |
| 231 | AKR1B1 | DRUGGABLE GENOME, ENZYME | Sulindac | SULINDAC | ||
| 231 | AKR1B1 | DRUGGABLE GENOME, ENZYME | inhibitor | 178103990 | ZENARESTAT | |
| 231 | AKR1B1 | DRUGGABLE GENOME, ENZYME | Epalrestat | EPALRESTAT | ||
| 231 | AKR1B1 | DRUGGABLE GENOME, ENZYME | T2c-003 | |||
| 231 | AKR1B1 | DRUGGABLE GENOME, ENZYME | GROWTH AGENTS | 9371720 | ||
| 231 | AKR1B1 | DRUGGABLE GENOME, ENZYME | inhibitor | 178103991 | ZOPOLRESTAT | |
| 231 | AKR1B1 | DRUGGABLE GENOME, ENZYME | Oxilofrine | OXILOFRINE |
| Page: 1 2 3 4 |

Copyright 2023-Present -The University of Texas Health Science Center at Houston |