| Tissue | Expression Dynamics | Abbreviation |
| Colorectum (GSE201348) |  | FAP: Familial adenomatous polyposis |
| CRC: Colorectal cancer |
| Colorectum (HTA11) |  | AD: Adenomas |
| SER: Sessile serrated lesions |
| MSI-H: Microsatellite-high colorectal cancer |
| MSS: Microsatellite stable colorectal cancer |
| Endometrium | 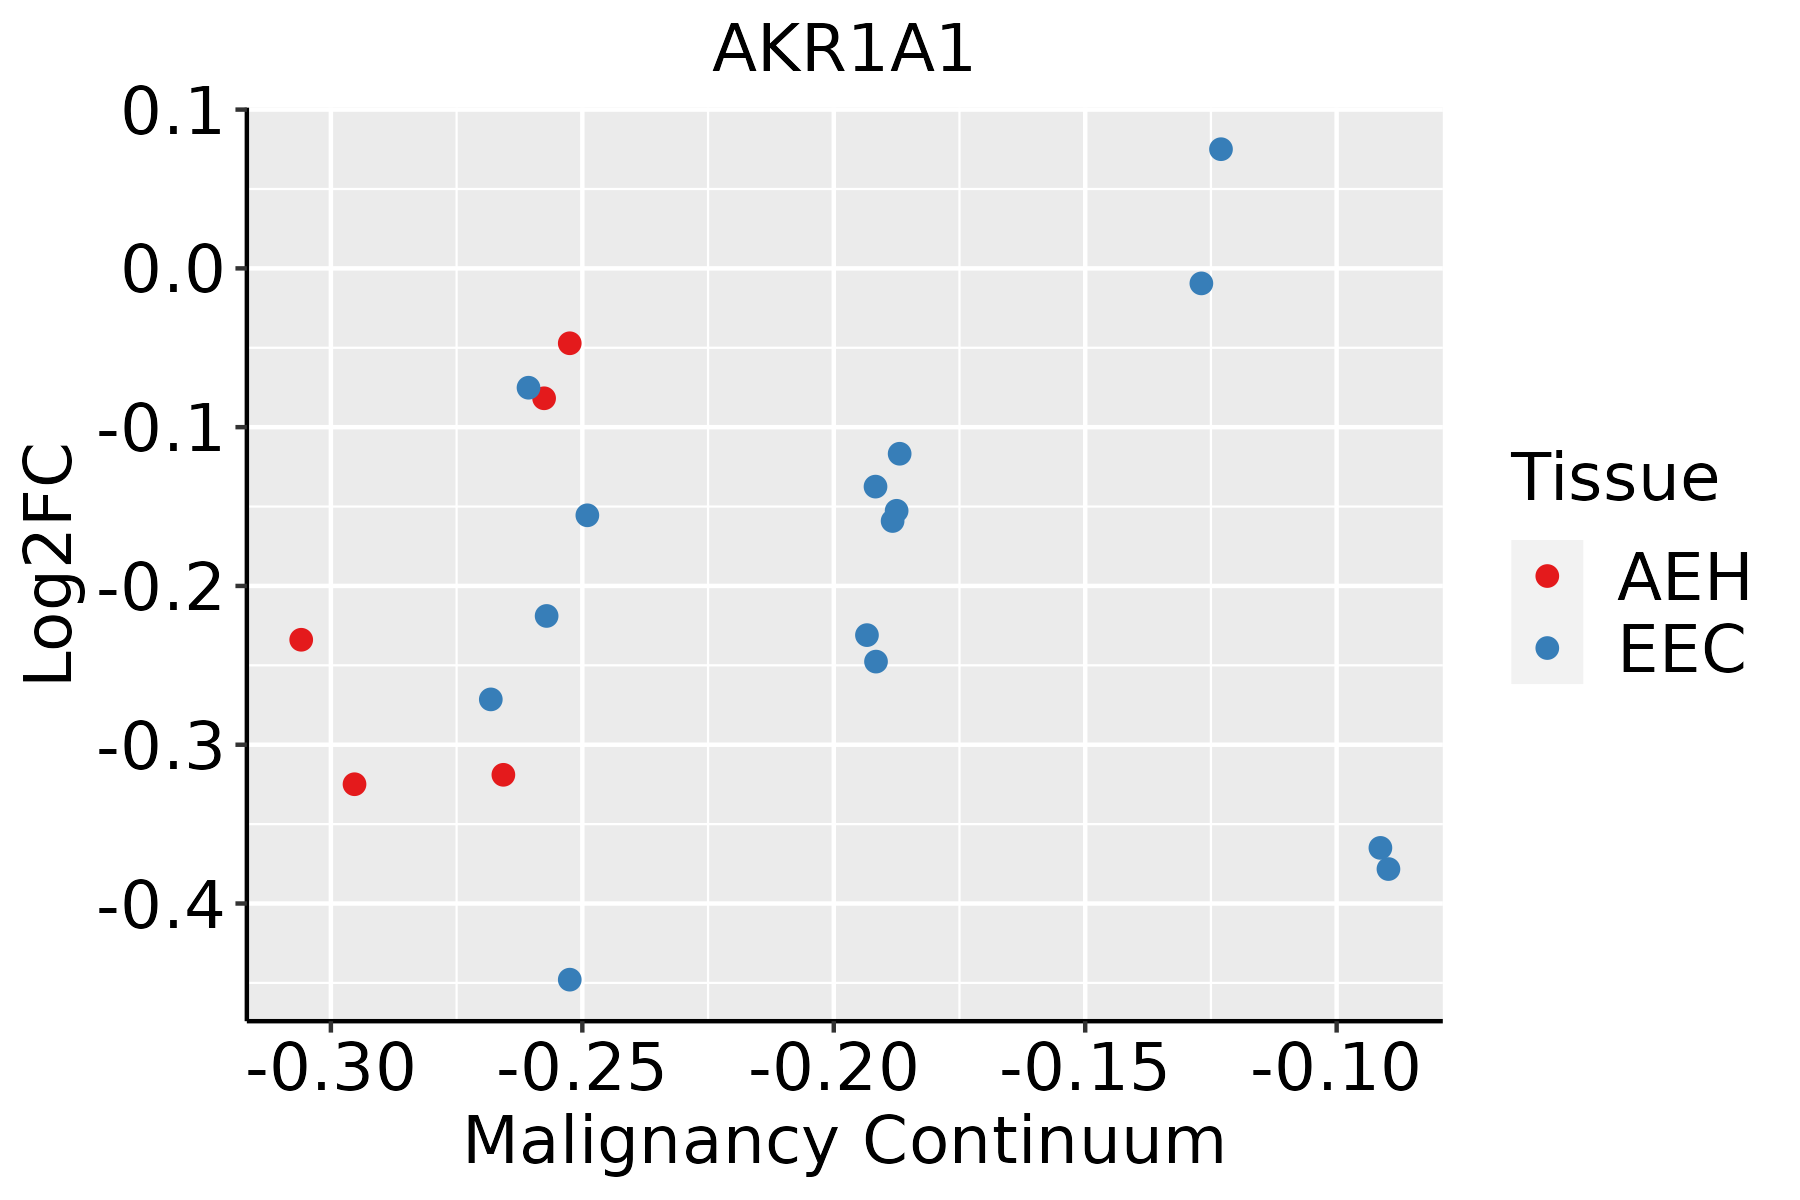 | AEH: Atypical endometrial hyperplasia |
| EEC: Endometrioid Cancer |
| Esophagus |  | ESCC: Esophageal squamous cell carcinoma |
| HGIN: High-grade intraepithelial neoplasias |
| LGIN: Low-grade intraepithelial neoplasias |
| GC | 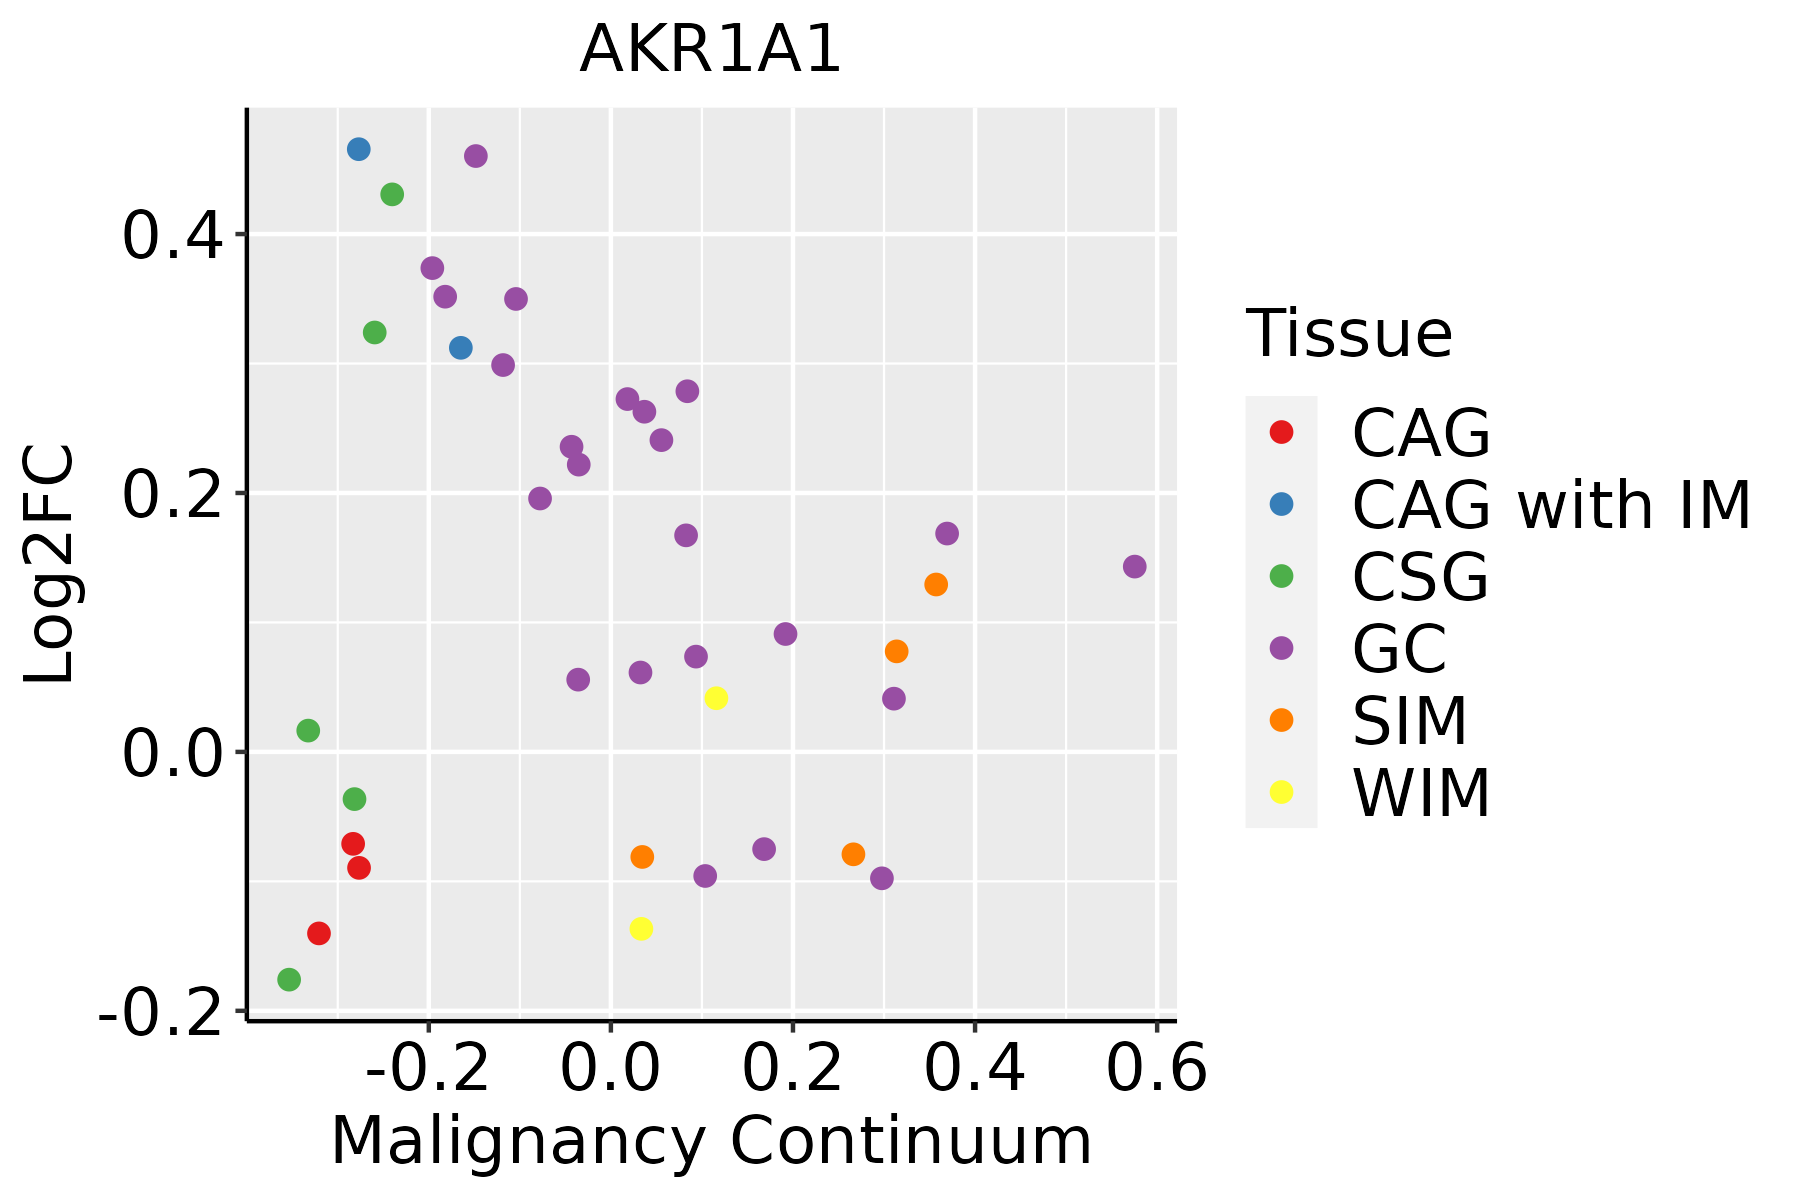 | CAG: Chronic atrophic gastritis |
| CAG with IM: Chronic atrophic gastritis with intestinal metaplasia |
| CSG: Chronic superficial gastritis |
| GC: Gastric cancer |
| SIM: Severe intestinal metaplasia |
| WIM: Wild intestinal metaplasia |
| Liver | 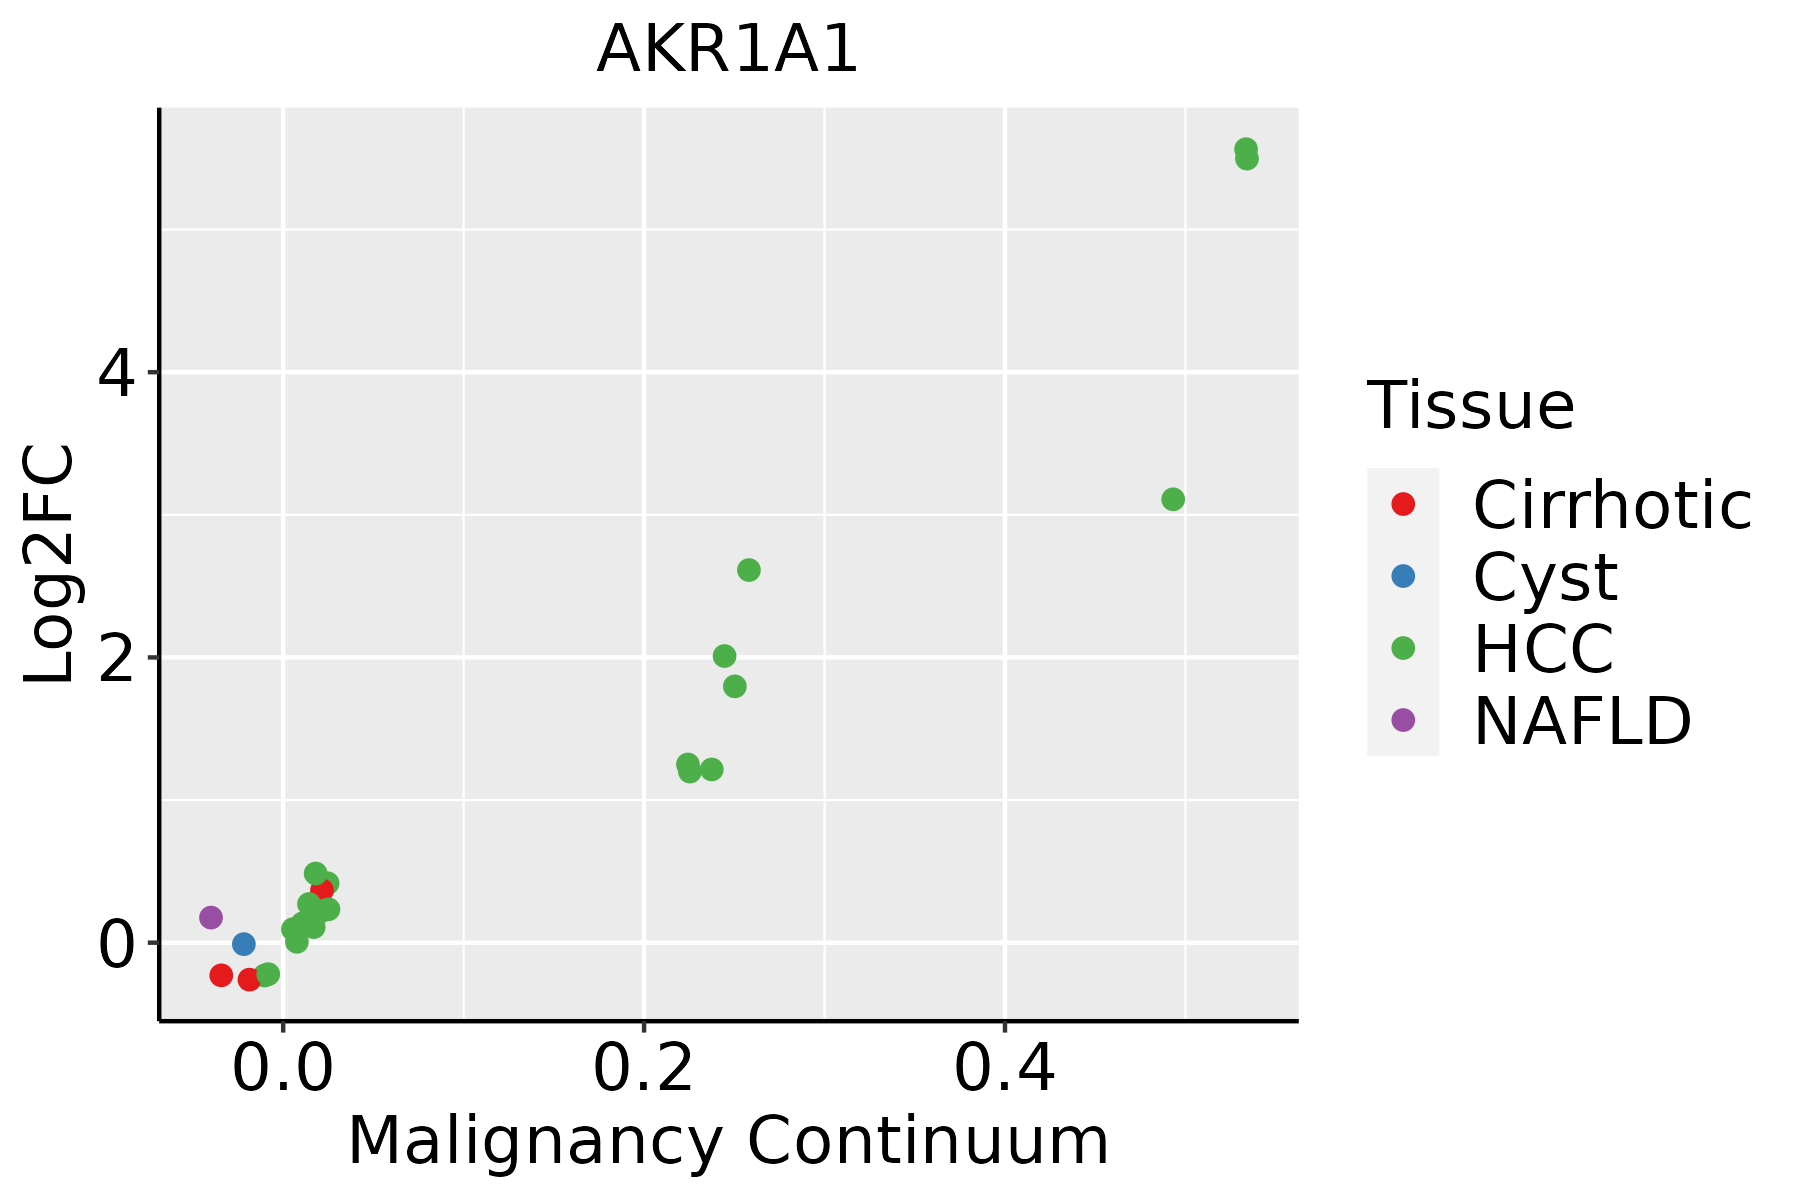 | HCC: Hepatocellular carcinoma |
| NAFLD: Non-alcoholic fatty liver disease |
| Oral Cavity | 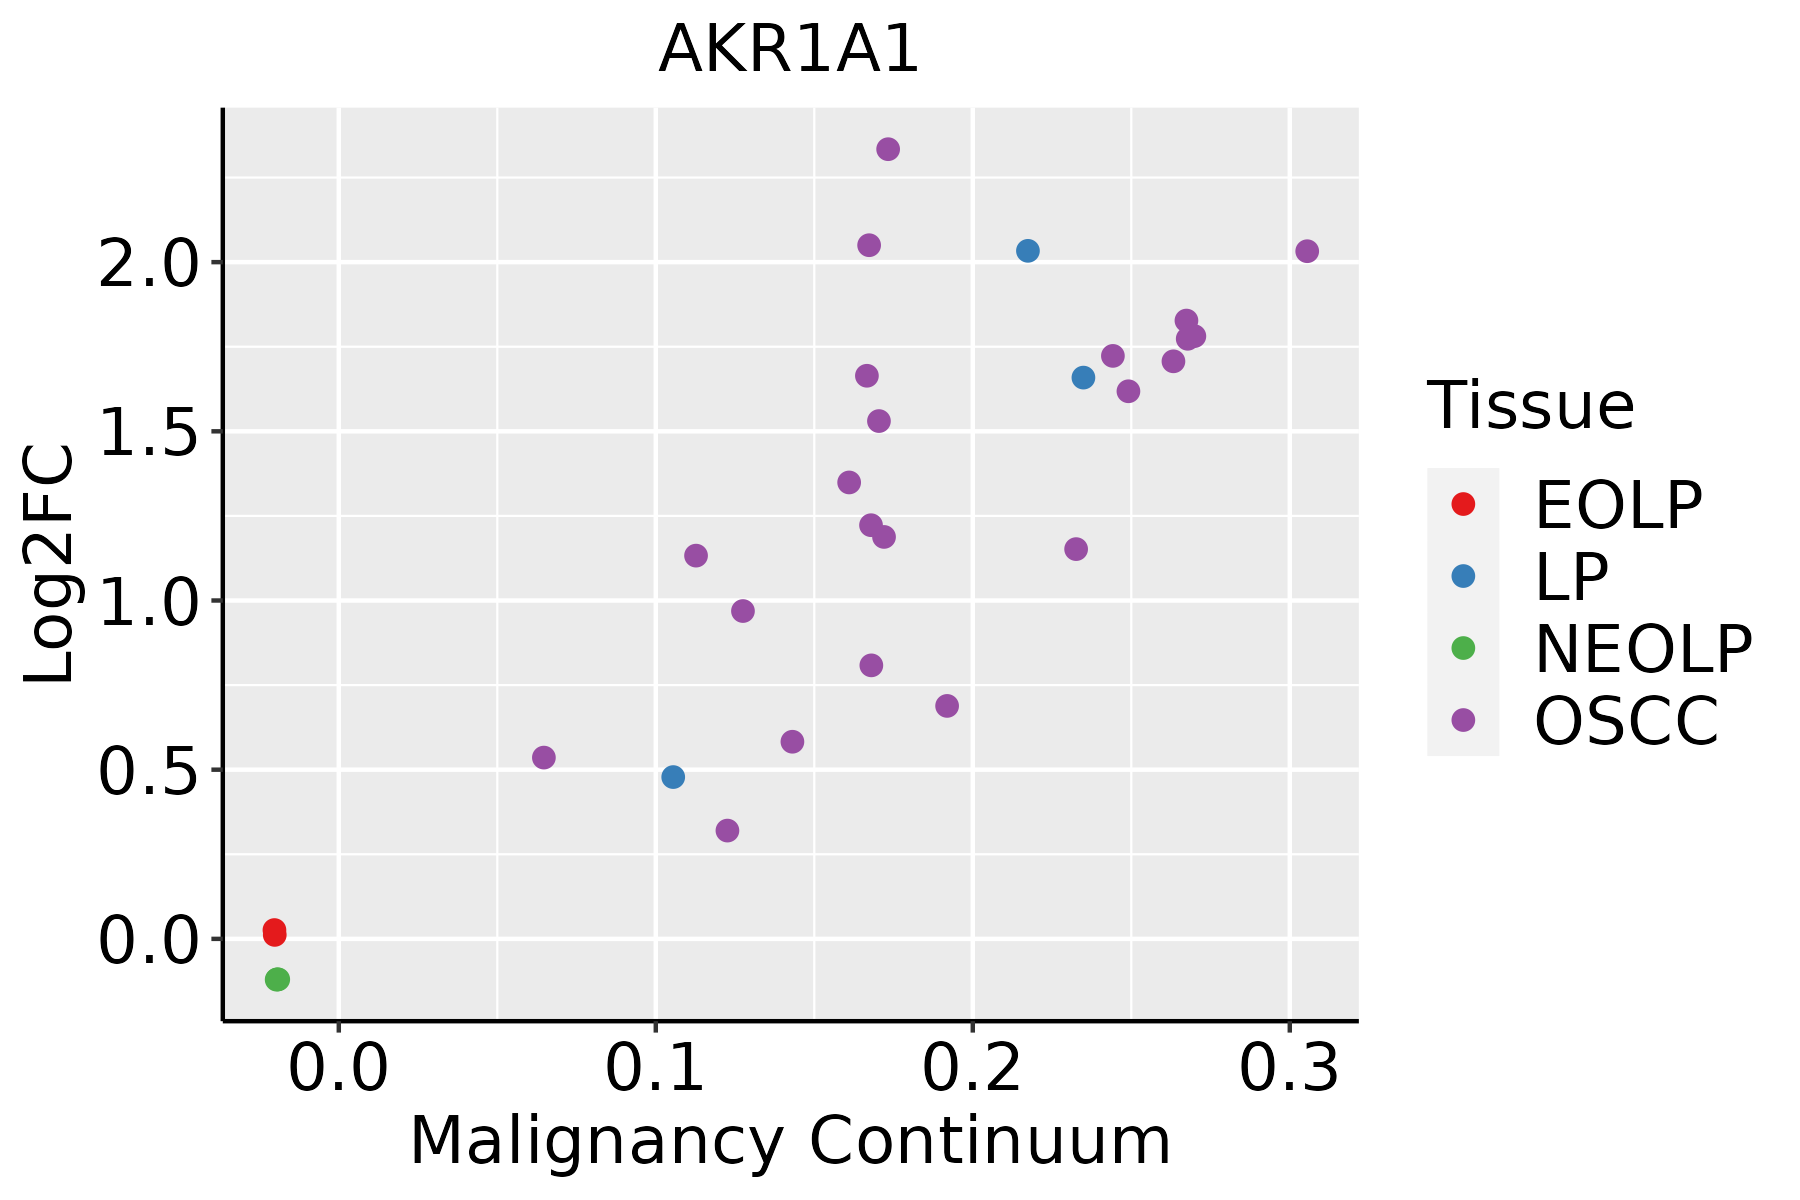 | EOLP: Erosive Oral lichen planus |
| LP: leukoplakia |
| NEOLP: Non-erosive oral lichen planus |
| OSCC: Oral squamous cell carcinoma |
| Prostate | 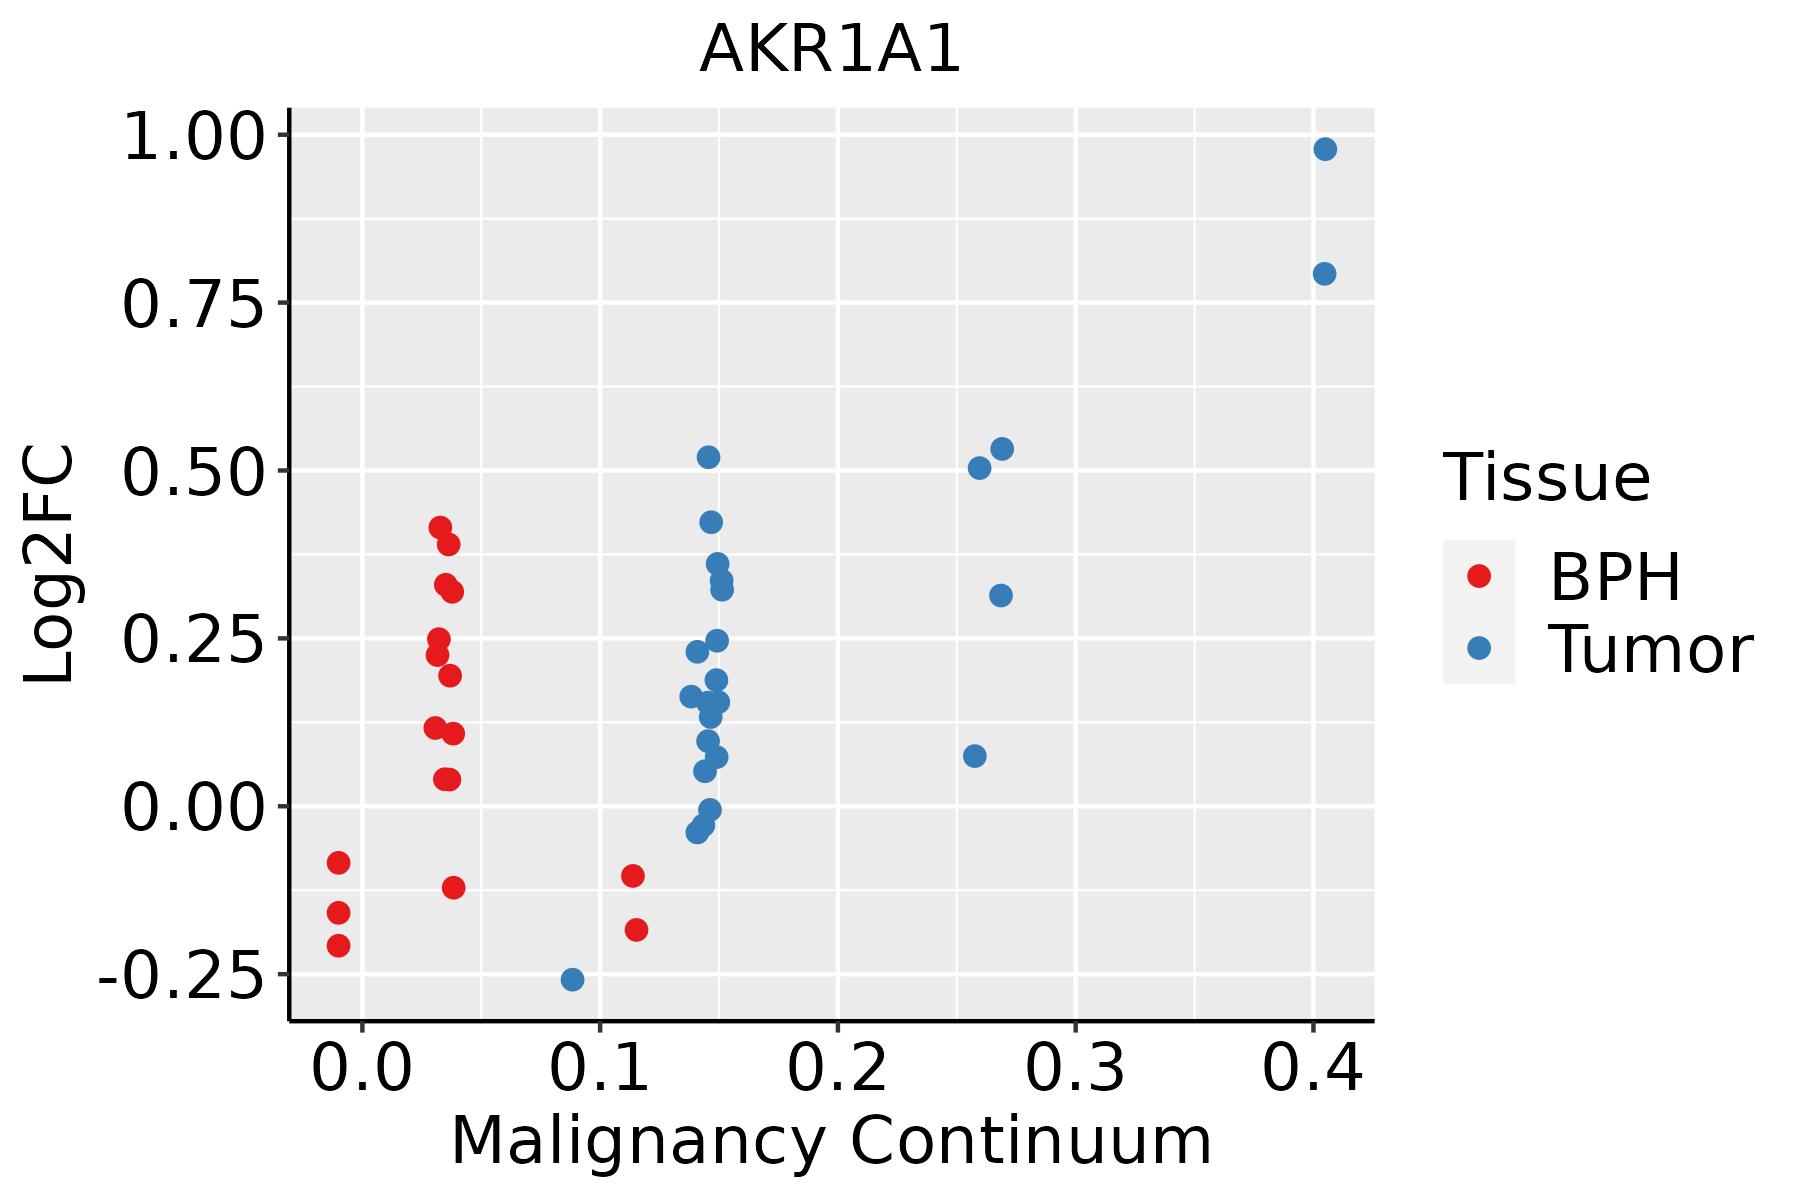 | BPH: Benign Prostatic Hyperplasia |
| Skin | 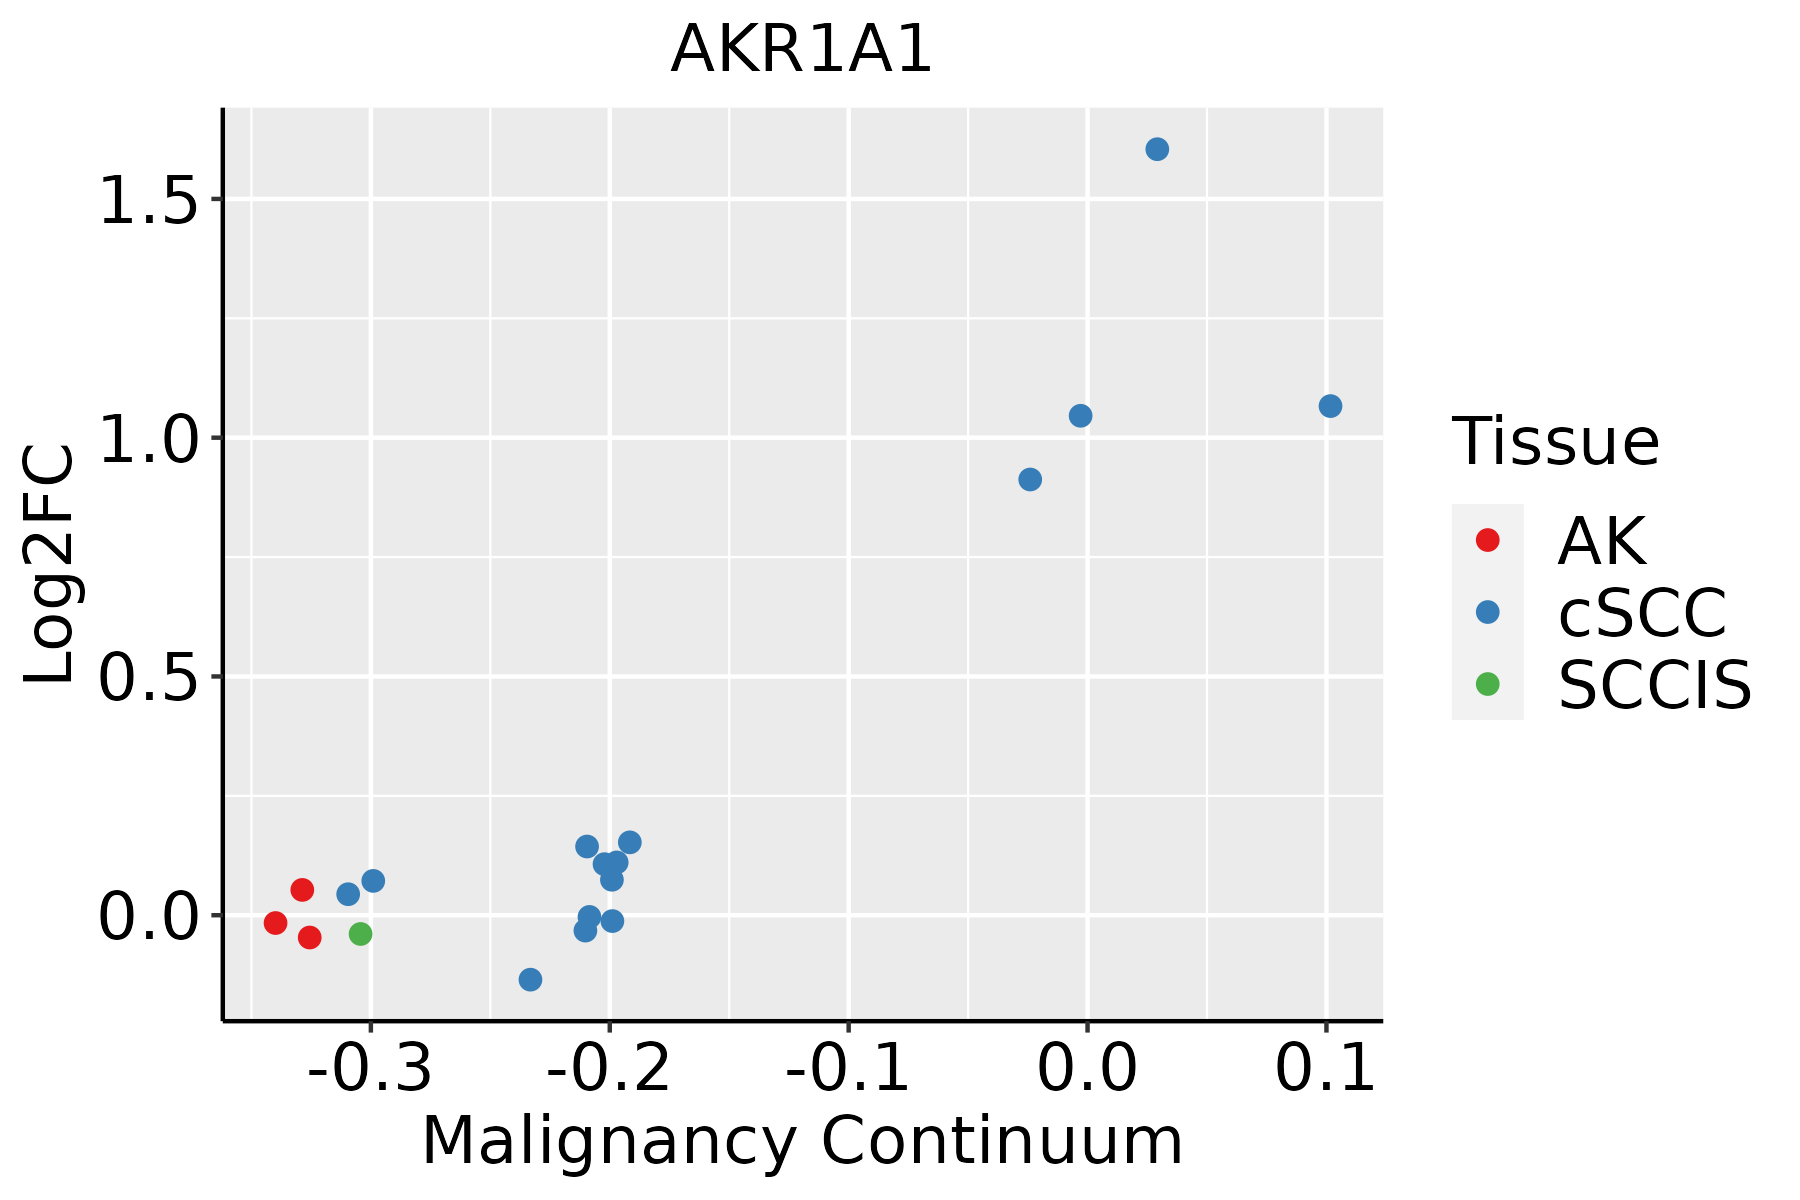 | AK: Actinic keratosis |
| cSCC: Cutaneous squamous cell carcinoma |
| SCCIS:squamous cell carcinoma in situ |
| Thyroid | 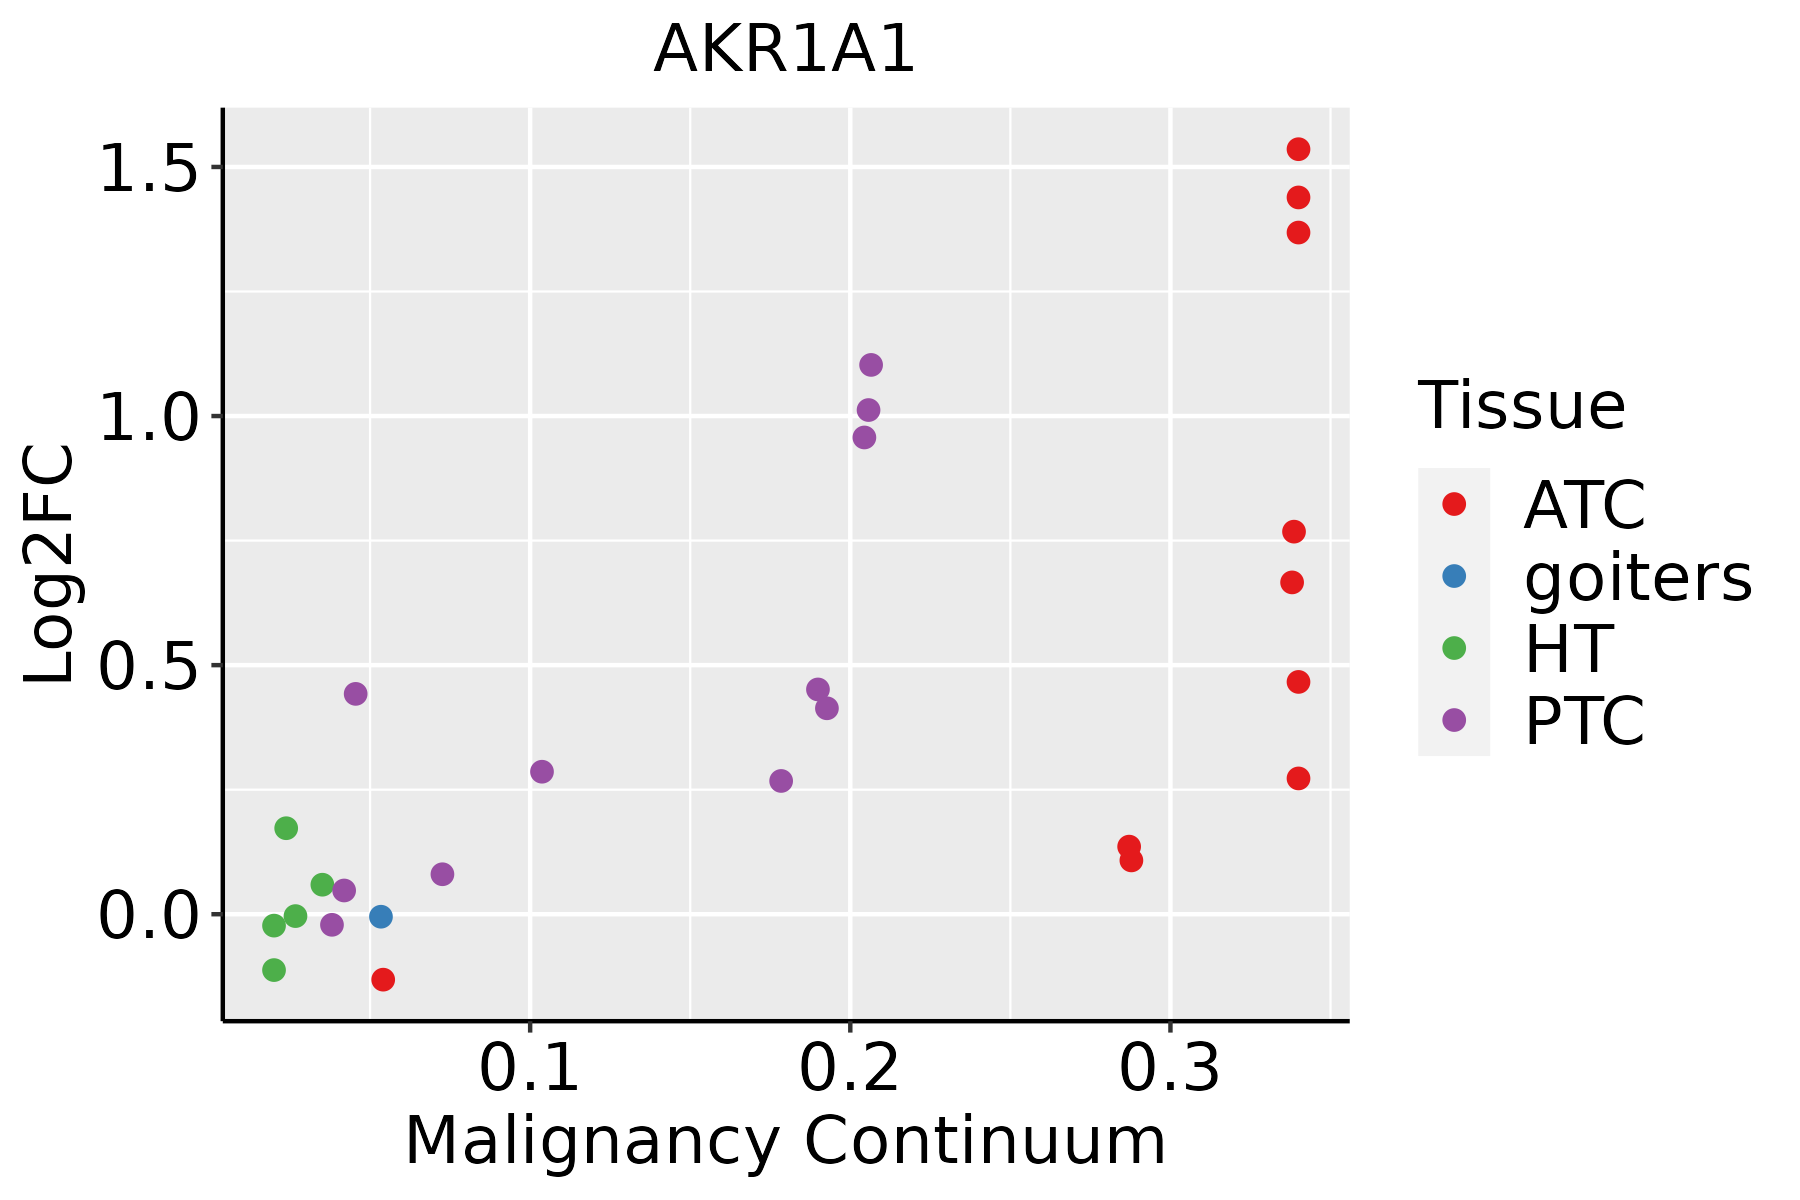 | ATC: Anaplastic thyroid cancer |
| HT: Hashimoto's thyroiditis |
| PTC: Papillary thyroid cancer |
| GO ID | Tissue | Disease Stage | Description | Gene Ratio | Bg Ratio | pvalue | p.adjust | Count |
| GO:0006091 | Colorectum | AD | generation of precursor metabolites and energy | 209/3918 | 490/18723 | 3.17e-28 | 6.61e-25 | 209 |
| GO:0022900 | Colorectum | AD | electron transport chain | 89/3918 | 175/18723 | 1.42e-18 | 8.91e-16 | 89 |
| GO:0044282 | Colorectum | AD | small molecule catabolic process | 118/3918 | 376/18723 | 1.05e-06 | 3.55e-05 | 118 |
| GO:0009636 | Colorectum | AD | response to toxic substance | 88/3918 | 262/18723 | 1.12e-06 | 3.72e-05 | 88 |
| GO:0019318 | Colorectum | AD | hexose metabolic process | 77/3918 | 237/18723 | 1.96e-05 | 4.01e-04 | 77 |
| GO:0006066 | Colorectum | AD | alcohol metabolic process | 106/3918 | 353/18723 | 3.02e-05 | 5.57e-04 | 106 |
| GO:0098754 | Colorectum | AD | detoxification | 53/3918 | 152/18723 | 4.63e-05 | 7.98e-04 | 53 |
| GO:0006790 | Colorectum | AD | sulfur compound metabolic process | 101/3918 | 339/18723 | 6.46e-05 | 1.07e-03 | 101 |
| GO:0005996 | Colorectum | AD | monosaccharide metabolic process | 80/3918 | 257/18723 | 7.31e-05 | 1.17e-03 | 80 |
| GO:0072329 | Colorectum | AD | monocarboxylic acid catabolic process | 44/3918 | 122/18723 | 8.05e-05 | 1.28e-03 | 44 |
| GO:0097237 | Colorectum | AD | cellular response to toxic substance | 44/3918 | 124/18723 | 1.24e-04 | 1.80e-03 | 44 |
| GO:1990748 | Colorectum | AD | cellular detoxification | 41/3918 | 116/18723 | 2.29e-04 | 2.97e-03 | 41 |
| GO:0006006 | Colorectum | AD | glucose metabolic process | 62/3918 | 196/18723 | 2.76e-04 | 3.39e-03 | 62 |
| GO:0016054 | Colorectum | AD | organic acid catabolic process | 73/3918 | 240/18723 | 3.20e-04 | 3.81e-03 | 73 |
| GO:0046395 | Colorectum | AD | carboxylic acid catabolic process | 70/3918 | 236/18723 | 9.06e-04 | 8.71e-03 | 70 |
| GO:0034308 | Colorectum | AD | primary alcohol metabolic process | 35/3918 | 102/18723 | 1.16e-03 | 1.05e-02 | 35 |
| GO:0006081 | Colorectum | AD | cellular aldehyde metabolic process | 22/3918 | 60/18723 | 3.64e-03 | 2.60e-02 | 22 |
| GO:00060911 | Colorectum | SER | generation of precursor metabolites and energy | 168/2897 | 490/18723 | 1.39e-25 | 1.70e-22 | 168 |
| GO:00229001 | Colorectum | SER | electron transport chain | 77/2897 | 175/18723 | 1.77e-19 | 1.36e-16 | 77 |
| GO:00096361 | Colorectum | SER | response to toxic substance | 71/2897 | 262/18723 | 8.63e-07 | 4.07e-05 | 71 |
| Pathway ID | Tissue | Disease Stage | Description | Gene Ratio | Bg Ratio | pvalue | p.adjust | qvalue | Count |
| hsa05208 | Colorectum | AD | Chemical carcinogenesis - reactive oxygen species | 126/2092 | 223/8465 | 1.01e-24 | 1.68e-22 | 1.07e-22 | 126 |
| hsa00620 | Colorectum | AD | Pyruvate metabolism | 28/2092 | 47/8465 | 3.71e-07 | 5.41e-06 | 3.45e-06 | 28 |
| hsa00010 | Colorectum | AD | Glycolysis / Gluconeogenesis | 34/2092 | 67/8465 | 3.63e-06 | 4.34e-05 | 2.77e-05 | 34 |
| hsa00561 | Colorectum | AD | Glycerolipid metabolism | 24/2092 | 63/8465 | 1.25e-02 | 4.54e-02 | 2.90e-02 | 24 |
| hsa052081 | Colorectum | AD | Chemical carcinogenesis - reactive oxygen species | 126/2092 | 223/8465 | 1.01e-24 | 1.68e-22 | 1.07e-22 | 126 |
| hsa006201 | Colorectum | AD | Pyruvate metabolism | 28/2092 | 47/8465 | 3.71e-07 | 5.41e-06 | 3.45e-06 | 28 |
| hsa000101 | Colorectum | AD | Glycolysis / Gluconeogenesis | 34/2092 | 67/8465 | 3.63e-06 | 4.34e-05 | 2.77e-05 | 34 |
| hsa005611 | Colorectum | AD | Glycerolipid metabolism | 24/2092 | 63/8465 | 1.25e-02 | 4.54e-02 | 2.90e-02 | 24 |
| hsa006202 | Colorectum | SER | Pyruvate metabolism | 22/1580 | 47/8465 | 9.62e-06 | 1.33e-04 | 9.67e-05 | 22 |
| hsa000102 | Colorectum | SER | Glycolysis / Gluconeogenesis | 24/1580 | 67/8465 | 6.62e-04 | 5.36e-03 | 3.89e-03 | 24 |
| hsa006203 | Colorectum | SER | Pyruvate metabolism | 22/1580 | 47/8465 | 9.62e-06 | 1.33e-04 | 9.67e-05 | 22 |
| hsa000103 | Colorectum | SER | Glycolysis / Gluconeogenesis | 24/1580 | 67/8465 | 6.62e-04 | 5.36e-03 | 3.89e-03 | 24 |
| hsa052084 | Colorectum | MSS | Chemical carcinogenesis - reactive oxygen species | 118/1875 | 223/8465 | 2.71e-24 | 4.54e-22 | 2.78e-22 | 118 |
| hsa006204 | Colorectum | MSS | Pyruvate metabolism | 24/1875 | 47/8465 | 1.25e-05 | 1.35e-04 | 8.27e-05 | 24 |
| hsa000104 | Colorectum | MSS | Glycolysis / Gluconeogenesis | 28/1875 | 67/8465 | 2.36e-04 | 1.81e-03 | 1.11e-03 | 28 |
| hsa005612 | Colorectum | MSS | Glycerolipid metabolism | 23/1875 | 63/8465 | 6.55e-03 | 2.64e-02 | 1.62e-02 | 23 |
| hsa052085 | Colorectum | MSS | Chemical carcinogenesis - reactive oxygen species | 118/1875 | 223/8465 | 2.71e-24 | 4.54e-22 | 2.78e-22 | 118 |
| hsa006205 | Colorectum | MSS | Pyruvate metabolism | 24/1875 | 47/8465 | 1.25e-05 | 1.35e-04 | 8.27e-05 | 24 |
| hsa000105 | Colorectum | MSS | Glycolysis / Gluconeogenesis | 28/1875 | 67/8465 | 2.36e-04 | 1.81e-03 | 1.11e-03 | 28 |
| hsa005613 | Colorectum | MSS | Glycerolipid metabolism | 23/1875 | 63/8465 | 6.55e-03 | 2.64e-02 | 1.62e-02 | 23 |
| TF | Cell Type | Tissue | Disease Stage | Target Gene | RSS | Regulon Activity |
| AKR1A1 | M2MAC | Cervix | ADJ | PRDX1,CAPG,TMEM176B, etc. | 2.00e-01 |  |
| AKR1A1 | MAST | Cervix | ADJ | PRDX1,CAPG,TMEM176B, etc. | 2.57e-01 | |
| AKR1A1 | M2MAC | Cervix | HSIL_HPV | PRDX1,CAPG,TMEM176B, etc. | 1.60e-01 |  |
| AKR1A1 | M2MAC | Endometrium | ADJ | CD81,PRDX1,CAPG, etc. | 2.90e-01 |  |
| AKR1A1 | M2MAC | Endometrium | AEH | CD81,PRDX1,CAPG, etc. | 2.73e-01 |  |
| AKR1A1 | M2MAC | Endometrium | EEC | CD81,PRDX1,CAPG, etc. | 3.82e-01 |  |
| AKR1A1 | M2MAC | Endometrium | Healthy | CD81,PRDX1,CAPG, etc. | 4.34e-01 |  |
| AKR1A1 | cDC | Skin | ADJ | PRDX1,HLA-DQB2,FCGBP, etc. | 5.26e-02 |  |
| AKR1A1 | LC | Skin | ADJ | PRDX1,HLA-DQB2,FCGBP, etc. | 4.18e-01 | |
| AKR1A1 | M2MAC | Skin | ADJ | PRDX1,HLA-DQB2,FCGBP, etc. | 2.06e-01 | |
| Hugo Symbol | Variant Class | Variant Classification | dbSNP RS | HGVSc | HGVSp | HGVSp Short | SWISSPROT | BIOTYPE | SIFT | PolyPhen | Tumor Sample Barcode | Tissue | Histology | Sex | Age | Stage | Therapy Types | Drugs | Outcome |
| AKR1A1 | SNV | Missense_Mutation | novel | c.631N>T | p.Ser211Cys | p.S211C | P14550 | protein_coding | deleterious(0.05) | probably_damaging(0.996) | TCGA-S3-AA0Z-01 | Breast | breast invasive carcinoma | Female | <65 | I/II | Ancillary | neulasta | CR |
| AKR1A1 | deletion | Frame_Shift_Del | novel | c.945delG | p.His316IlefsTer24 | p.H316Ifs*24 | P14550 | protein_coding | | | TCGA-D8-A27V-01 | Breast | breast invasive carcinoma | Female | <65 | I/II | Hormone Therapy | tamoxiphen | SD |
| AKR1A1 | SNV | Missense_Mutation | rs767717870 | c.106G>A | p.Ala36Thr | p.A36T | P14550 | protein_coding | deleterious(0.01) | probably_damaging(0.977) | TCGA-DS-A1OB-01 | Cervix | cervical & endocervical cancer | Female | <65 | I/II | Chemotherapy | carboplatin | PD |
| AKR1A1 | SNV | Missense_Mutation | novel | c.733C>G | p.Pro245Ala | p.P245A | P14550 | protein_coding | tolerated(0.2) | benign(0.232) | TCGA-DS-A1OB-01 | Cervix | cervical & endocervical cancer | Female | <65 | I/II | Chemotherapy | carboplatin | PD |
| AKR1A1 | SNV | Missense_Mutation | | c.147C>G | p.Ile49Met | p.I49M | P14550 | protein_coding | tolerated(0.05) | benign(0.011) | TCGA-EK-A2RA-01 | Cervix | cervical & endocervical cancer | Female | >=65 | I/II | Unknown | Unknown | SD |
| AKR1A1 | SNV | Missense_Mutation | novel | c.107C>T | p.Ala36Val | p.A36V | P14550 | protein_coding | deleterious(0.01) | probably_damaging(0.98) | TCGA-AA-A00N-01 | Colorectum | colon adenocarcinoma | Male | >=65 | I/II | Unknown | Unknown | PD |
| AKR1A1 | SNV | Missense_Mutation | novel | c.125N>A | p.Arg42His | p.R42H | P14550 | protein_coding | deleterious(0.01) | probably_damaging(0.997) | TCGA-AJ-A3EL-01 | Endometrium | uterine corpus endometrioid carcinoma | Female | <65 | I/II | Unknown | Unknown | SD |
| AKR1A1 | SNV | Missense_Mutation | rs757813969 | c.950C>T | p.Pro317Leu | p.P317L | P14550 | protein_coding | deleterious(0) | probably_damaging(0.989) | TCGA-AP-A051-01 | Endometrium | uterine corpus endometrioid carcinoma | Female | >=65 | I/II | Unknown | Unknown | SD |
| AKR1A1 | SNV | Missense_Mutation | novel | c.8N>A | p.Ala3Asp | p.A3D | P14550 | protein_coding | deleterious(0) | benign(0.034) | TCGA-AP-A059-01 | Endometrium | uterine corpus endometrioid carcinoma | Female | >=65 | I/II | Unknown | Unknown | SD |
| AKR1A1 | SNV | Missense_Mutation | novel | c.825N>T | p.Lys275Asn | p.K275N | P14550 | protein_coding | tolerated(0.27) | benign(0.001) | TCGA-AP-A1DV-01 | Endometrium | uterine corpus endometrioid carcinoma | Female | <65 | I/II | Unknown | Unknown | SD |


