
|
|||||
|
 | |
| |
| |
| |
| |
| |
|
Gene: AKIRIN2 |
Gene summary for AKIRIN2 |
| Gene information | Species | Human | Gene symbol | AKIRIN2 | Gene ID | 55122 |
| Gene name | akirin 2 | |
| Gene Alias | C6orf166 | |
| Cytomap | 6q15 | |
| Gene Type | protein-coding | GO ID | GO:0000122 | UniProtAcc | Q53H80 |
Top |
Malignant transformation analysis |
| Identification of the aberrant gene expression in precancerous and cancerous lesions by comparing the gene expression of stem-like cells in diseased tissues with normal stem cells |
| Entrez ID | Symbol | Replicates | Species | Organ | Tissue | Adj P-value | Log2FC | Malignancy |
| 55122 | AKIRIN2 | LZE4T | Human | Esophagus | ESCC | 5.24e-13 | 6.20e-01 | 0.0811 |
| 55122 | AKIRIN2 | LZE7T | Human | Esophagus | ESCC | 4.45e-02 | 3.93e-01 | 0.0667 |
| 55122 | AKIRIN2 | LZE8T | Human | Esophagus | ESCC | 2.42e-02 | -6.82e-02 | 0.067 |
| 55122 | AKIRIN2 | LZE20T | Human | Esophagus | ESCC | 5.79e-12 | 2.46e-01 | 0.0662 |
| 55122 | AKIRIN2 | LZE22T | Human | Esophagus | ESCC | 2.66e-03 | 3.28e-01 | 0.068 |
| 55122 | AKIRIN2 | LZE24T | Human | Esophagus | ESCC | 1.19e-19 | 7.71e-01 | 0.0596 |
| 55122 | AKIRIN2 | LZE21T | Human | Esophagus | ESCC | 2.59e-05 | 4.12e-01 | 0.0655 |
| 55122 | AKIRIN2 | P1T-E | Human | Esophagus | ESCC | 9.20e-05 | 5.21e-01 | 0.0875 |
| 55122 | AKIRIN2 | P2T-E | Human | Esophagus | ESCC | 5.93e-31 | 8.32e-01 | 0.1177 |
| 55122 | AKIRIN2 | P4T-E | Human | Esophagus | ESCC | 5.35e-30 | 7.76e-01 | 0.1323 |
| 55122 | AKIRIN2 | P5T-E | Human | Esophagus | ESCC | 8.81e-13 | 4.43e-01 | 0.1327 |
| 55122 | AKIRIN2 | P8T-E | Human | Esophagus | ESCC | 1.23e-19 | 4.09e-01 | 0.0889 |
| 55122 | AKIRIN2 | P9T-E | Human | Esophagus | ESCC | 9.45e-13 | 3.85e-01 | 0.1131 |
| 55122 | AKIRIN2 | P10T-E | Human | Esophagus | ESCC | 7.18e-20 | 3.52e-01 | 0.116 |
| 55122 | AKIRIN2 | P11T-E | Human | Esophagus | ESCC | 9.94e-17 | 9.79e-01 | 0.1426 |
| 55122 | AKIRIN2 | P12T-E | Human | Esophagus | ESCC | 5.20e-19 | 7.42e-01 | 0.1122 |
| 55122 | AKIRIN2 | P15T-E | Human | Esophagus | ESCC | 2.10e-35 | 7.74e-01 | 0.1149 |
| 55122 | AKIRIN2 | P16T-E | Human | Esophagus | ESCC | 1.37e-37 | 9.56e-01 | 0.1153 |
| 55122 | AKIRIN2 | P17T-E | Human | Esophagus | ESCC | 7.87e-08 | 3.77e-01 | 0.1278 |
| 55122 | AKIRIN2 | P19T-E | Human | Esophagus | ESCC | 2.79e-06 | 6.81e-01 | 0.1662 |
| Page: 1 2 3 4 5 6 7 |
| Tissue | Expression Dynamics | Abbreviation |
| Esophagus | 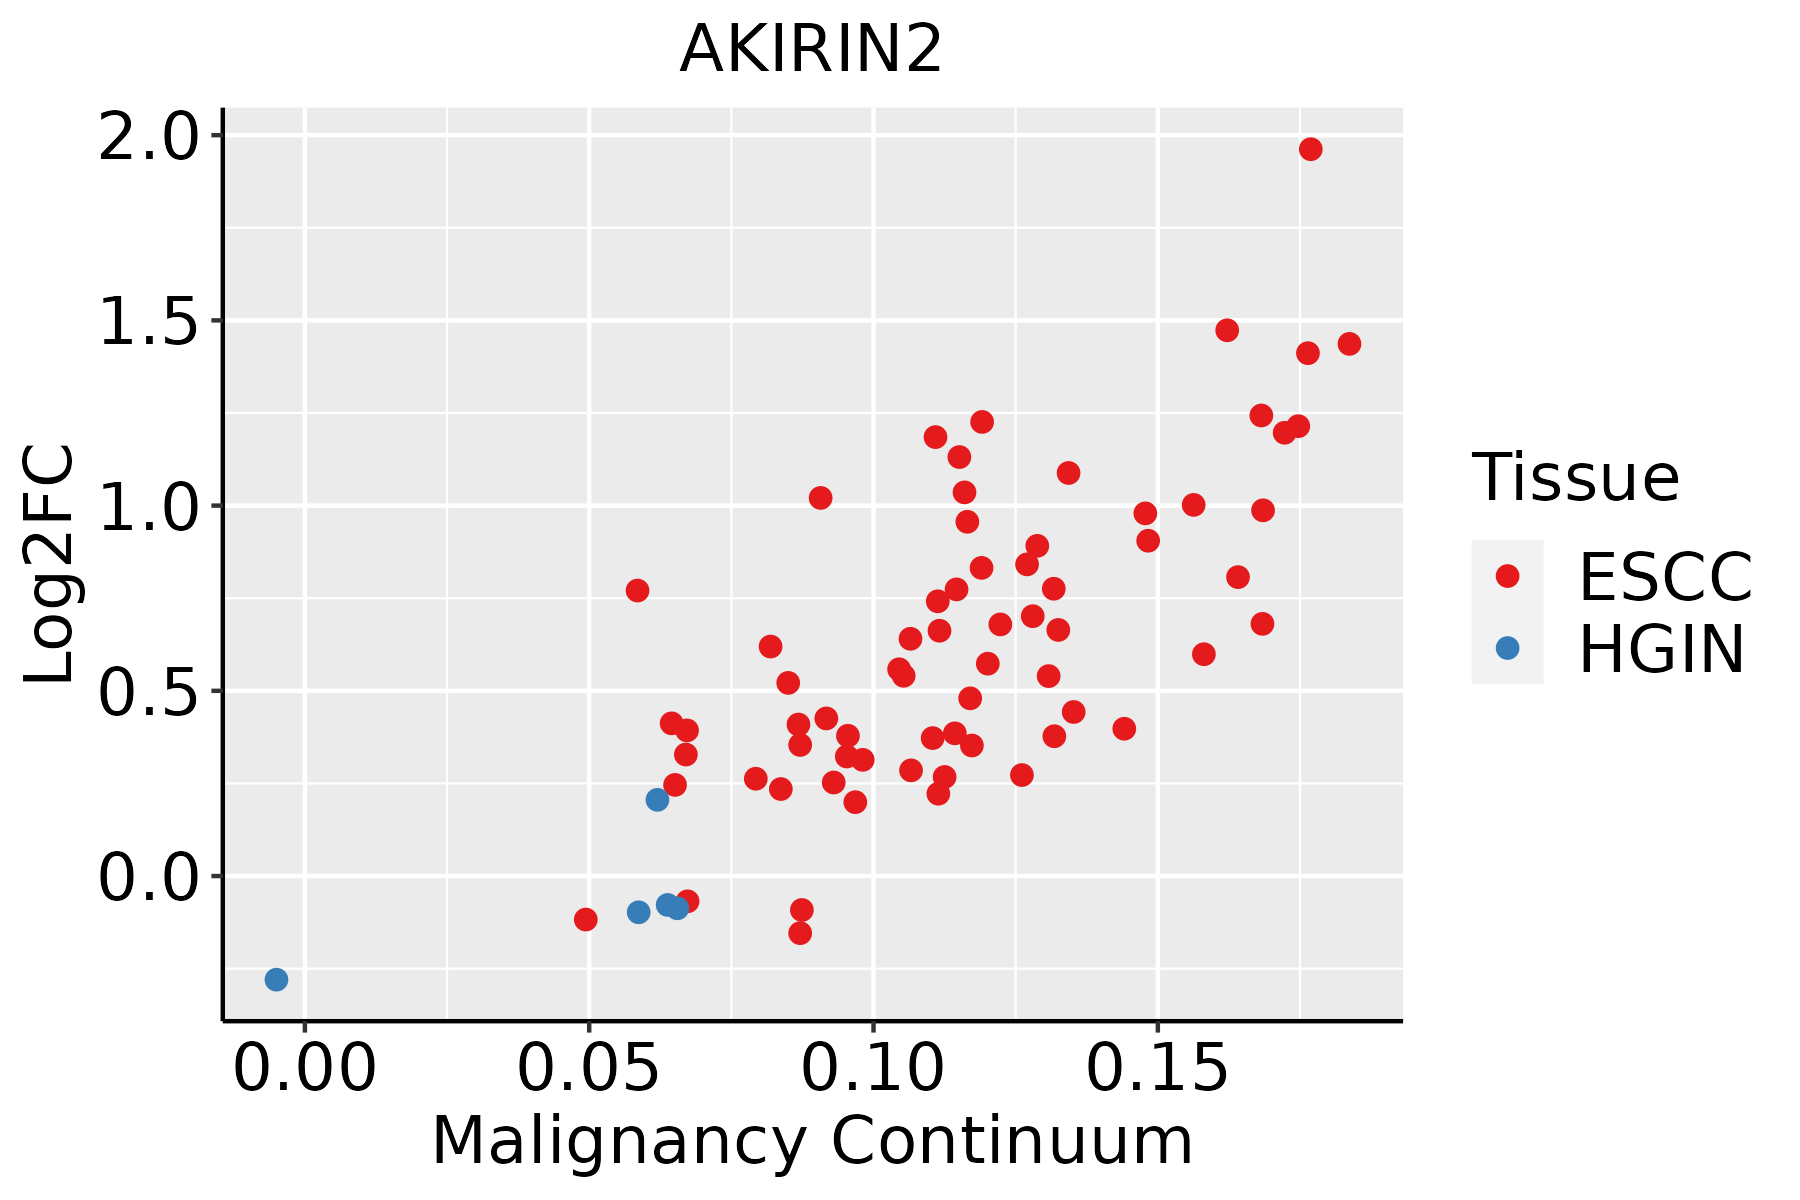 | ESCC: Esophageal squamous cell carcinoma |
| HGIN: High-grade intraepithelial neoplasias | ||
| LGIN: Low-grade intraepithelial neoplasias | ||
| Liver | 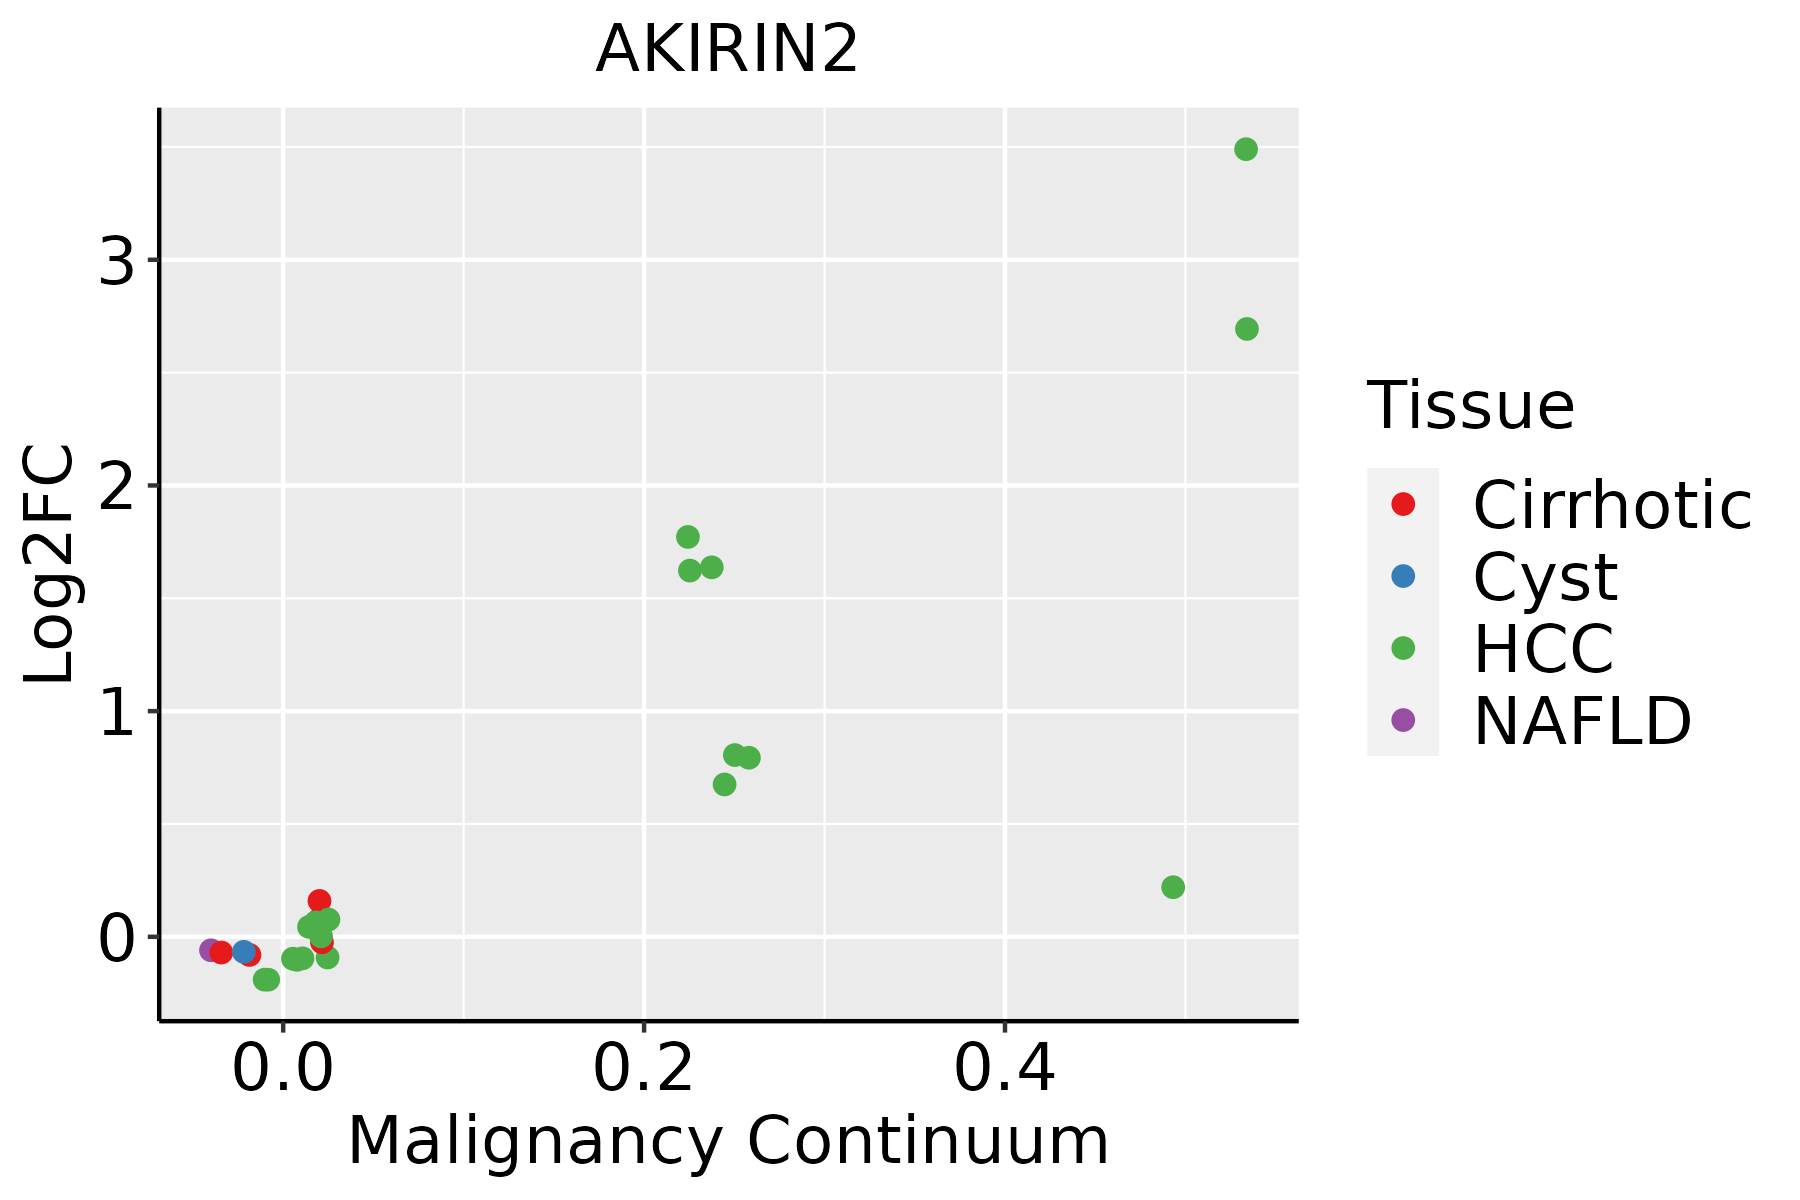 | HCC: Hepatocellular carcinoma |
| NAFLD: Non-alcoholic fatty liver disease | ||
| Oral Cavity |  | EOLP: Erosive Oral lichen planus |
| LP: leukoplakia | ||
| NEOLP: Non-erosive oral lichen planus | ||
| OSCC: Oral squamous cell carcinoma | ||
| Prostate | 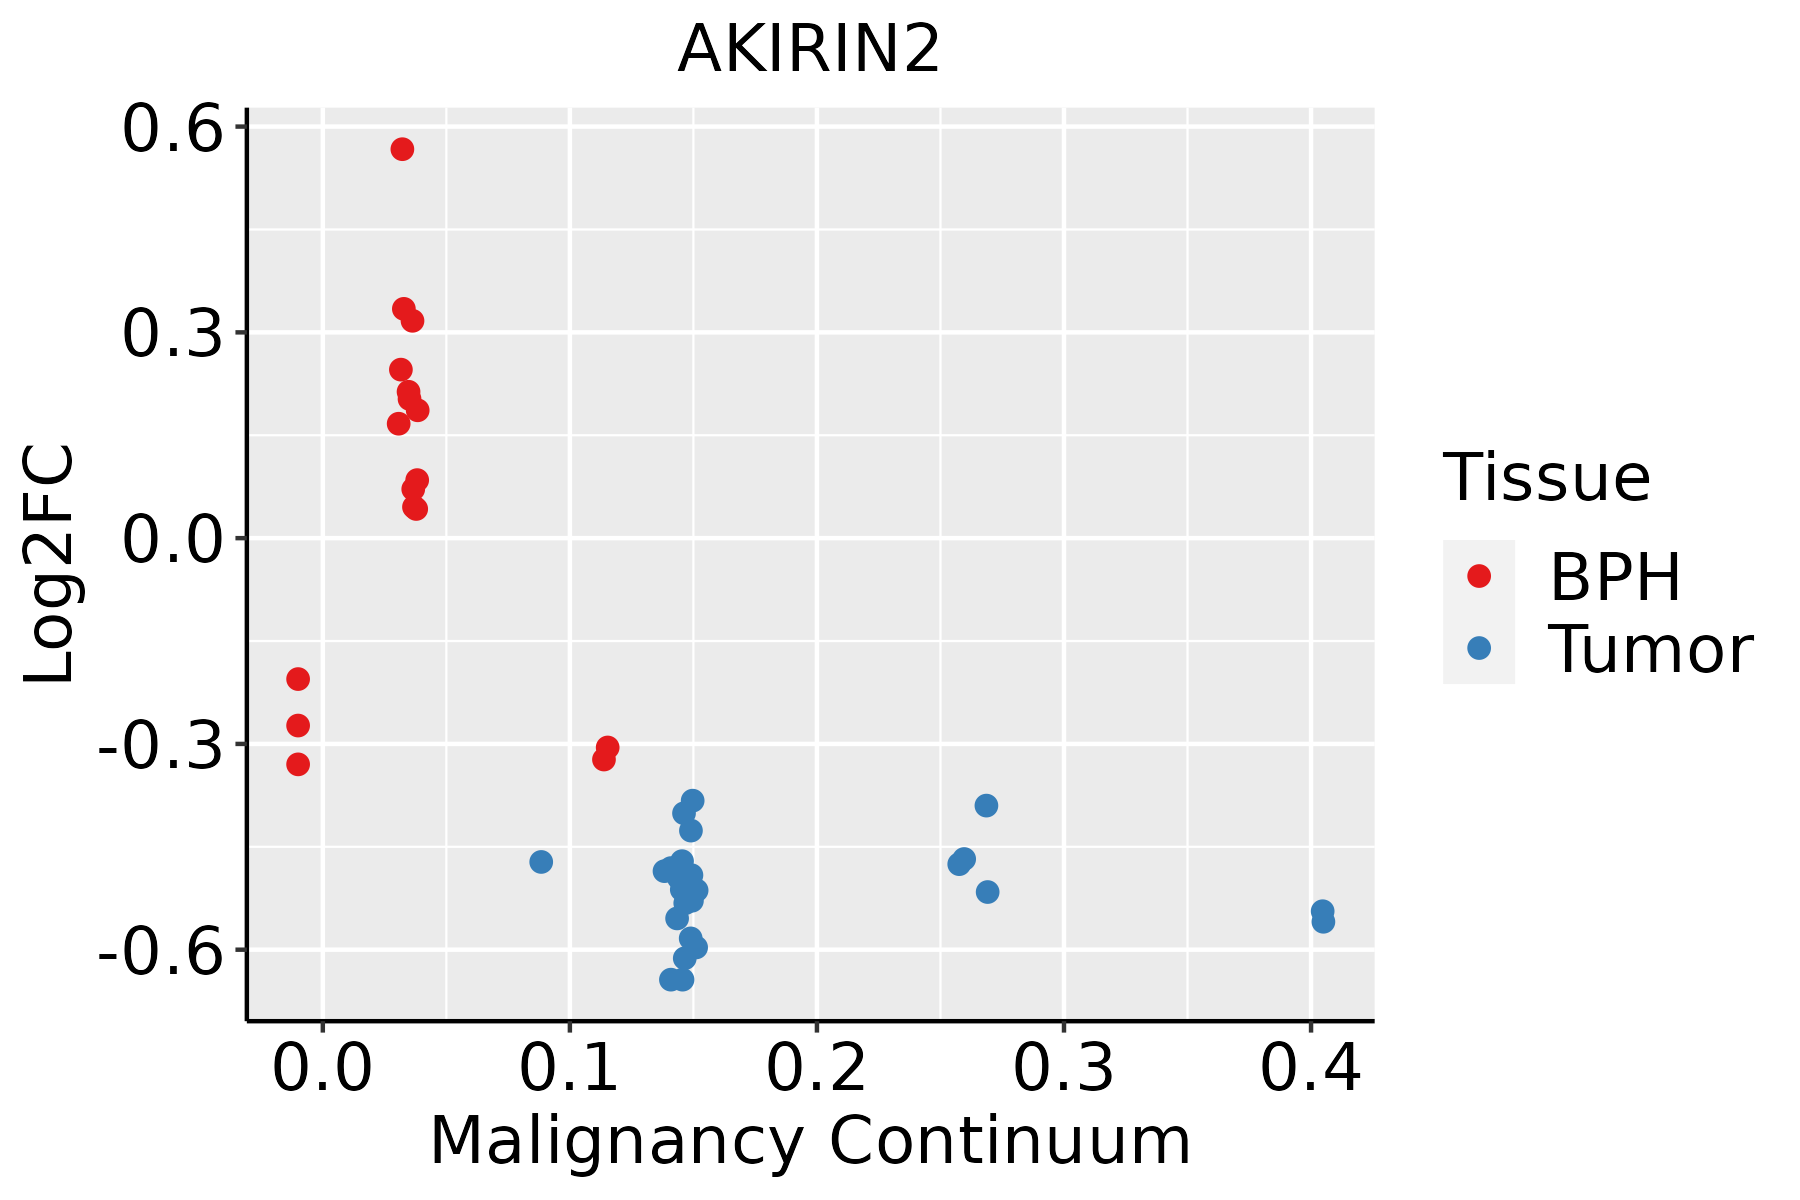 | BPH: Benign Prostatic Hyperplasia |
| Skin | 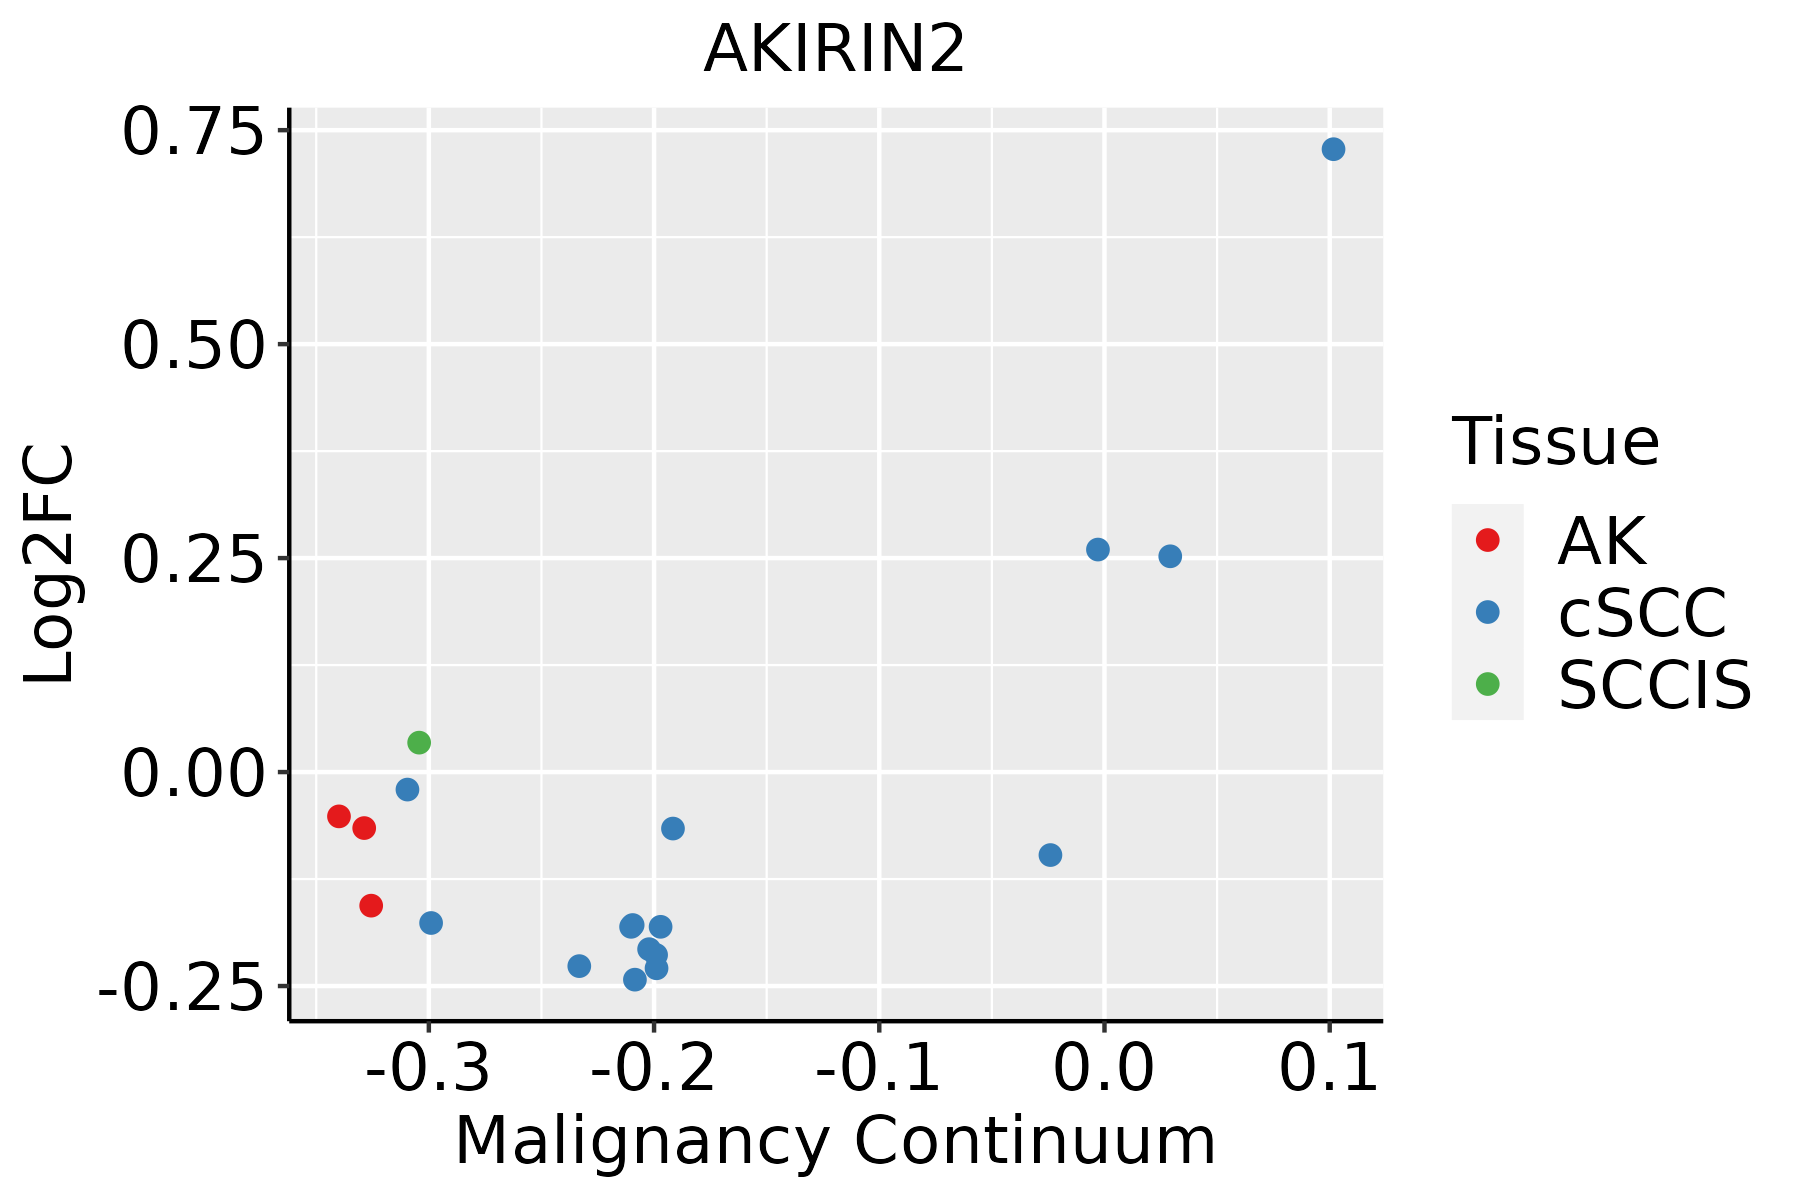 | AK: Actinic keratosis |
| cSCC: Cutaneous squamous cell carcinoma | ||
| SCCIS:squamous cell carcinoma in situ | ||
| Thyroid | 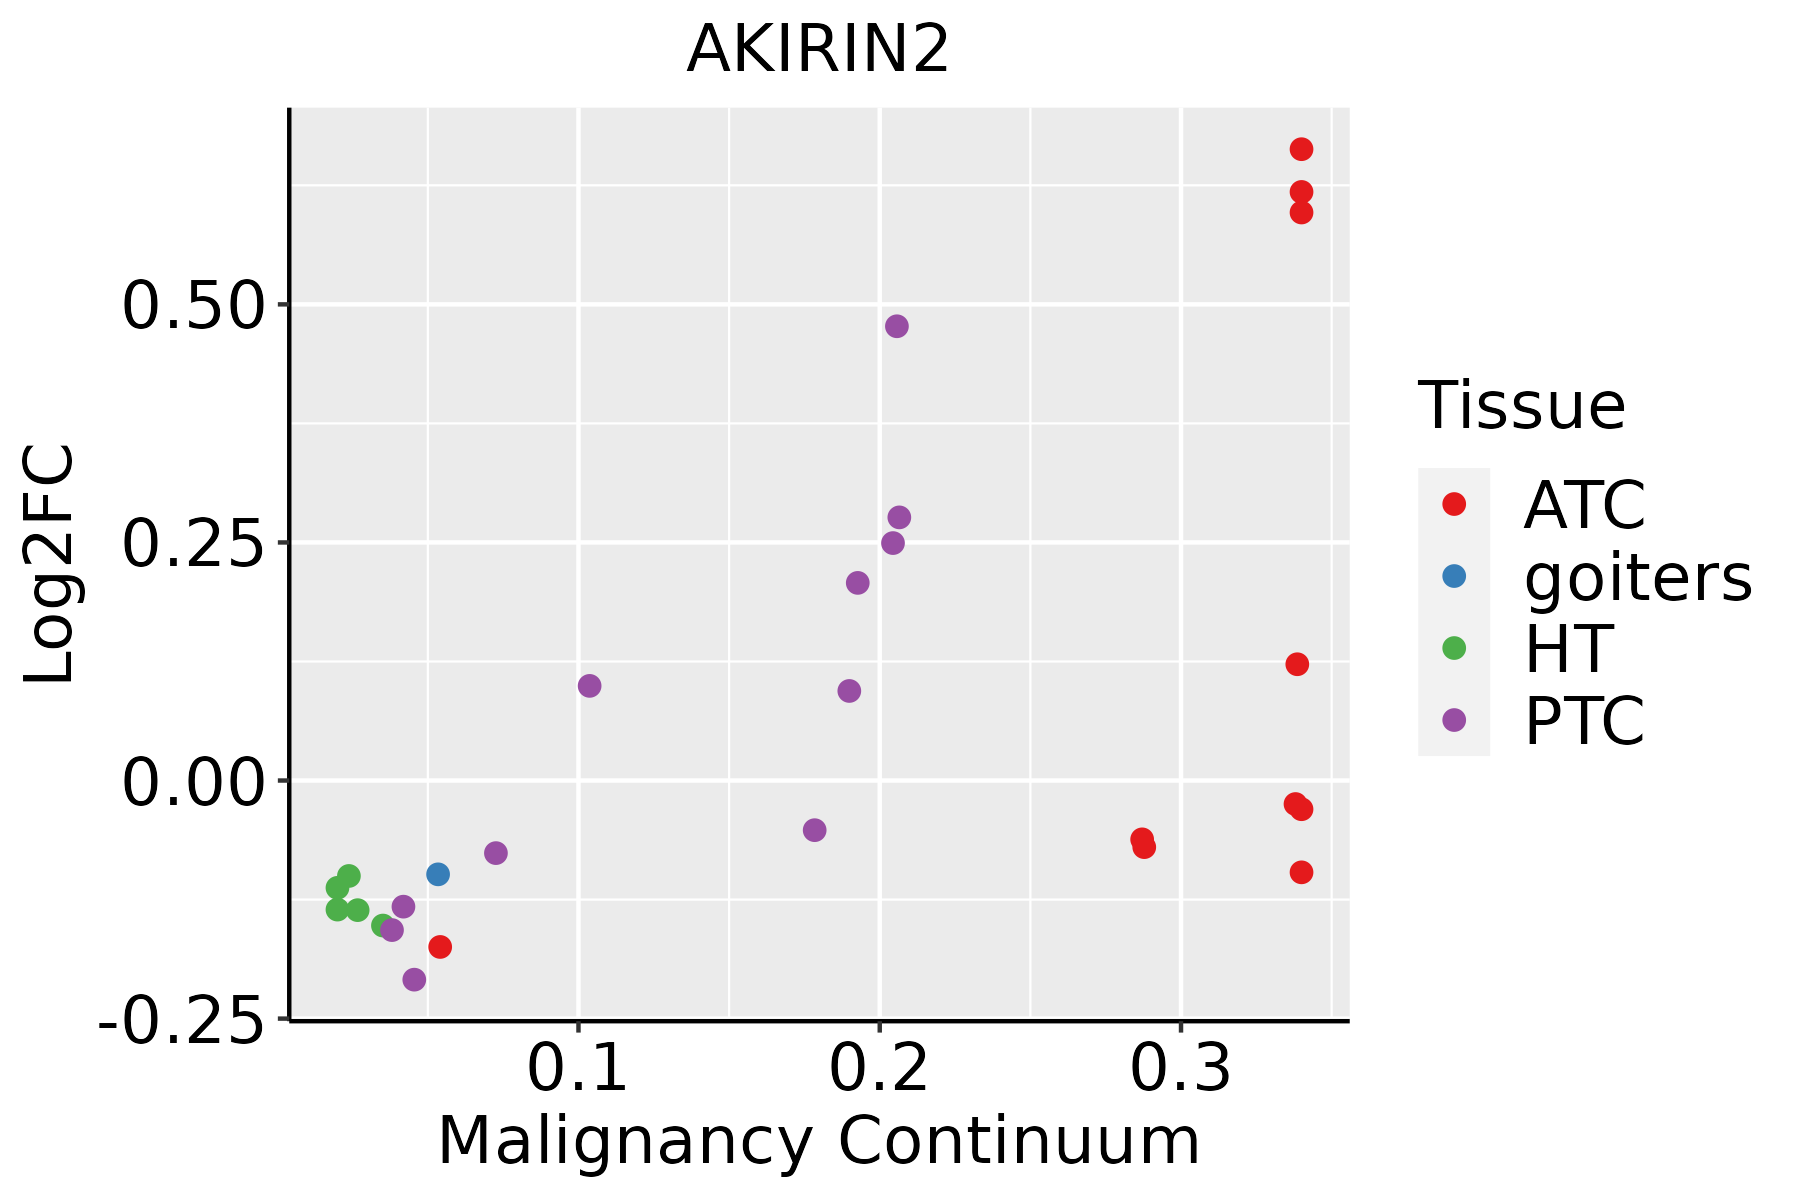 | ATC: Anaplastic thyroid cancer |
| HT: Hashimoto's thyroiditis | ||
| PTC: Papillary thyroid cancer |
| ∗log2FC in expression of this searched gene in stem-like cells from each diseased tissue sample relative to stem-like cells in normal samples in each tissue plotted against the malignancy continuum. Samples are colored based on if they are from different disease stage. |
Top |
Malignant transformation related pathway analysis |
| Find out the enriched GO biological processes and KEGG pathways involved in transition from healthy to precancer to cancer |
| Tissue | Disease Stage | Enriched GO biological Processes |
| Colorectum | AD |  |
| Colorectum | SER |  |
| Colorectum | MSS |  |
| Colorectum | MSI-H |  |
| Colorectum | FAP |  |
| ∗Top 15 enriched GO BP terms are showed in the bar plot of each disease state in each tissue. Each row represents a significant GO biological process which is colored according to the -log10(p.adjust). |
| Page: 1 2 3 4 5 6 7 8 9 |
| GO ID | Tissue | Disease Stage | Description | Gene Ratio | Bg Ratio | pvalue | p.adjust | Count |
| GO:0045862111 | Esophagus | ESCC | positive regulation of proteolysis | 256/8552 | 372/18723 | 7.88e-20 | 9.43e-18 | 256 |
| GO:0010952111 | Esophagus | ESCC | positive regulation of peptidase activity | 133/8552 | 197/18723 | 4.31e-10 | 1.14e-08 | 133 |
| GO:0052547111 | Esophagus | ESCC | regulation of peptidase activity | 275/8552 | 461/18723 | 7.54e-10 | 1.88e-08 | 275 |
| GO:0052548111 | Esophagus | ESCC | regulation of endopeptidase activity | 253/8552 | 432/18723 | 3.68e-08 | 6.78e-07 | 253 |
| GO:0010950111 | Esophagus | ESCC | positive regulation of endopeptidase activity | 116/8552 | 179/18723 | 1.77e-07 | 2.79e-06 | 116 |
| GO:00028318 | Esophagus | ESCC | regulation of response to biotic stimulus | 191/8552 | 327/18723 | 2.12e-06 | 2.45e-05 | 191 |
| GO:003249619 | Esophagus | ESCC | response to lipopolysaccharide | 191/8552 | 343/18723 | 1.11e-04 | 7.73e-04 | 191 |
| GO:00450885 | Esophagus | ESCC | regulation of innate immune response | 125/8552 | 218/18723 | 3.34e-04 | 1.96e-03 | 125 |
| GO:000223719 | Esophagus | ESCC | response to molecule of bacterial origin | 194/8552 | 363/18723 | 1.64e-03 | 7.61e-03 | 194 |
| GO:000181916 | Esophagus | ESCC | positive regulation of cytokine production | 244/8552 | 467/18723 | 2.29e-03 | 1.01e-02 | 244 |
| GO:004586212 | Liver | Cirrhotic | positive regulation of proteolysis | 163/4634 | 372/18723 | 4.18e-16 | 5.14e-14 | 163 |
| GO:005254712 | Liver | Cirrhotic | regulation of peptidase activity | 185/4634 | 461/18723 | 1.32e-13 | 1.09e-11 | 185 |
| GO:005254812 | Liver | Cirrhotic | regulation of endopeptidase activity | 172/4634 | 432/18723 | 2.12e-12 | 1.58e-10 | 172 |
| GO:00109527 | Liver | Cirrhotic | positive regulation of peptidase activity | 81/4634 | 197/18723 | 2.89e-07 | 7.03e-06 | 81 |
| GO:00109507 | Liver | Cirrhotic | positive regulation of endopeptidase activity | 70/4634 | 179/18723 | 1.42e-05 | 1.97e-04 | 70 |
| GO:00324966 | Liver | Cirrhotic | response to lipopolysaccharide | 111/4634 | 343/18723 | 8.15e-04 | 5.95e-03 | 111 |
| GO:00321032 | Liver | Cirrhotic | positive regulation of response to external stimulus | 131/4634 | 427/18723 | 2.90e-03 | 1.66e-02 | 131 |
| GO:00022376 | Liver | Cirrhotic | response to molecule of bacterial origin | 113/4634 | 363/18723 | 3.23e-03 | 1.81e-02 | 113 |
| GO:00028311 | Liver | Cirrhotic | regulation of response to biotic stimulus | 101/4634 | 327/18723 | 6.58e-03 | 3.25e-02 | 101 |
| GO:004586222 | Liver | HCC | positive regulation of proteolysis | 232/7958 | 372/18723 | 5.66e-15 | 3.98e-13 | 232 |
| Page: 1 2 3 4 5 6 |
| Pathway ID | Tissue | Disease Stage | Description | Gene Ratio | Bg Ratio | pvalue | p.adjust | qvalue | Count |
| Page: 1 |
Top |
Cell-cell communication analysis |
| Identification of potential cell-cell interactions between two cell types and their ligand-receptor pairs for different disease states |
| Ligand | Receptor | LRpair | Pathway | Tissue | Disease Stage |
| Page: 1 |
Top |
Single-cell gene regulatory network inference analysis |
| Find out the significant the regulons (TFs) and the target genes of each regulon across cell types for different disease states |
| TF | Cell Type | Tissue | Disease Stage | Target Gene | RSS | Regulon Activity |
| ∗The dot plots of a searched regulon are shown for all cell subpopulations in each disease state of each tissue based on the regulon specific score inferred using pySCENIC and by calculating the average expression. |
| Page: 1 |
Top |
Somatic mutation of malignant transformation related genes |
| Annotation of somatic variants for genes involved in malignant transformation |
| Hugo Symbol | Variant Class | Variant Classification | dbSNP RS | HGVSc | HGVSp | HGVSp Short | SWISSPROT | BIOTYPE | SIFT | PolyPhen | Tumor Sample Barcode | Tissue | Histology | Sex | Age | Stage | Therapy Types | Drugs | Outcome |
| AKIRIN2 | SNV | Missense_Mutation | c.374C>T | p.Ser125Leu | p.S125L | Q53H80 | protein_coding | tolerated(0.28) | benign(0) | TCGA-C5-A1M6-01 | Cervix | cervical & endocervical cancer | Female | <65 | I/II | Chemotherapy | cisplatin | PD | |
| AKIRIN2 | SNV | Missense_Mutation | c.569N>C | p.Ile190Thr | p.I190T | Q53H80 | protein_coding | deleterious(0) | benign(0.288) | TCGA-AA-3710-01 | Colorectum | colon adenocarcinoma | Female | >=65 | I/II | Unknown | Unknown | SD | |
| AKIRIN2 | SNV | Missense_Mutation | c.272N>A | p.Arg91Gln | p.R91Q | Q53H80 | protein_coding | deleterious(0) | probably_damaging(0.99) | TCGA-AA-3984-01 | Colorectum | colon adenocarcinoma | Female | <65 | I/II | Unknown | Unknown | SD | |
| AKIRIN2 | SNV | Missense_Mutation | c.507N>C | p.Glu169Asp | p.E169D | Q53H80 | protein_coding | deleterious(0.01) | benign(0.024) | TCGA-AA-A010-01 | Colorectum | colon adenocarcinoma | Female | <65 | I/II | Chemotherapy | folinic | CR | |
| AKIRIN2 | SNV | Missense_Mutation | c.272N>A | p.Arg91Gln | p.R91Q | Q53H80 | protein_coding | deleterious(0) | probably_damaging(0.99) | TCGA-AG-3892-01 | Colorectum | rectum adenocarcinoma | Female | <65 | I/II | Unknown | Unknown | SD | |
| AKIRIN2 | SNV | Missense_Mutation | rs753802898 | c.542N>T | p.Ala181Val | p.A181V | Q53H80 | protein_coding | deleterious(0.01) | benign(0.236) | TCGA-EI-6507-01 | Colorectum | rectum adenocarcinoma | Male | <65 | I/II | Unknown | Unknown | SD |
| AKIRIN2 | SNV | Missense_Mutation | rs535116495 | c.221N>T | p.Ser74Phe | p.S74F | Q53H80 | protein_coding | tolerated(0.08) | possibly_damaging(0.735) | TCGA-F5-6810-01 | Colorectum | rectum adenocarcinoma | Unknown | Unknown | I/II | Unknown | Unknown | Unknown |
| AKIRIN2 | deletion | Frame_Shift_Del | c.204delN | p.Phe69SerfsTer17 | p.F69Sfs*17 | Q53H80 | protein_coding | TCGA-CK-5916-01 | Colorectum | colon adenocarcinoma | Female | >=65 | I/II | Unknown | Unknown | PD | |||
| AKIRIN2 | SNV | Missense_Mutation | novel | c.578G>A | p.Arg193Gln | p.R193Q | Q53H80 | protein_coding | tolerated(0.07) | probably_damaging(0.99) | TCGA-AX-A2HC-01 | Endometrium | uterine corpus endometrioid carcinoma | Female | <65 | III/IV | Chemotherapy | paclitaxel | PD |
| AKIRIN2 | SNV | Missense_Mutation | c.476N>A | p.Arg159His | p.R159H | Q53H80 | protein_coding | tolerated(0.28) | probably_damaging(0.938) | TCGA-B5-A11N-01 | Endometrium | uterine corpus endometrioid carcinoma | Female | >=65 | I/II | Unknown | Unknown | SD |
| Page: 1 2 3 |
Top |
Related drugs of malignant transformation related genes |
| Identification of chemicals and drugs interact with genes involved in malignant transfromation |
| (DGIdb 4.0) |
| Entrez ID | Symbol | Category | Interaction Types | Drug Claim Name | Drug Name | PMIDs |
| Page: 1 |

Copyright 2023-Present -The University of Texas Health Science Center at Houston |