
|
|||||
|
 | |
| |
| |
| |
| |
| |
|
Gene: AKIRIN1 |
Gene summary for AKIRIN1 |
| Gene information | Species | Human | Gene symbol | AKIRIN1 | Gene ID | 79647 |
| Gene name | akirin 1 | |
| Gene Alias | C1orf108 | |
| Cytomap | 1p34.3 | |
| Gene Type | protein-coding | GO ID | GO:0002376 | UniProtAcc | Q9H9L7 |
Top |
Malignant transformation analysis |
| Identification of the aberrant gene expression in precancerous and cancerous lesions by comparing the gene expression of stem-like cells in diseased tissues with normal stem cells |
| Entrez ID | Symbol | Replicates | Species | Organ | Tissue | Adj P-value | Log2FC | Malignancy |
| 79647 | AKIRIN1 | LZE4T | Human | Esophagus | ESCC | 3.46e-10 | -9.14e-02 | 0.0811 |
| 79647 | AKIRIN1 | LZE8T | Human | Esophagus | ESCC | 8.03e-11 | -1.88e-01 | 0.067 |
| 79647 | AKIRIN1 | LZE20T | Human | Esophagus | ESCC | 1.07e-13 | -1.49e-01 | 0.0662 |
| 79647 | AKIRIN1 | LZE22D1 | Human | Esophagus | HGIN | 5.89e-04 | -2.18e-01 | 0.0595 |
| 79647 | AKIRIN1 | LZE22T | Human | Esophagus | ESCC | 1.03e-03 | 1.85e-01 | 0.068 |
| 79647 | AKIRIN1 | LZE24T | Human | Esophagus | ESCC | 9.76e-15 | 5.15e-01 | 0.0596 |
| 79647 | AKIRIN1 | LZE6T | Human | Esophagus | ESCC | 2.30e-02 | -2.44e-01 | 0.0845 |
| 79647 | AKIRIN1 | P2T-E | Human | Esophagus | ESCC | 5.58e-32 | 7.10e-01 | 0.1177 |
| 79647 | AKIRIN1 | P4T-E | Human | Esophagus | ESCC | 1.44e-20 | 3.42e-01 | 0.1323 |
| 79647 | AKIRIN1 | P5T-E | Human | Esophagus | ESCC | 7.97e-12 | 3.53e-01 | 0.1327 |
| 79647 | AKIRIN1 | P8T-E | Human | Esophagus | ESCC | 1.41e-11 | 1.94e-01 | 0.0889 |
| 79647 | AKIRIN1 | P9T-E | Human | Esophagus | ESCC | 4.21e-17 | 1.22e-01 | 0.1131 |
| 79647 | AKIRIN1 | P10T-E | Human | Esophagus | ESCC | 3.63e-25 | 5.98e-01 | 0.116 |
| 79647 | AKIRIN1 | P11T-E | Human | Esophagus | ESCC | 6.66e-06 | 2.42e-01 | 0.1426 |
| 79647 | AKIRIN1 | P12T-E | Human | Esophagus | ESCC | 1.57e-12 | 3.83e-01 | 0.1122 |
| 79647 | AKIRIN1 | P15T-E | Human | Esophagus | ESCC | 4.11e-22 | 4.91e-01 | 0.1149 |
| 79647 | AKIRIN1 | P16T-E | Human | Esophagus | ESCC | 3.14e-23 | 3.37e-01 | 0.1153 |
| 79647 | AKIRIN1 | P17T-E | Human | Esophagus | ESCC | 1.33e-03 | 2.22e-01 | 0.1278 |
| 79647 | AKIRIN1 | P19T-E | Human | Esophagus | ESCC | 3.88e-06 | 5.61e-01 | 0.1662 |
| 79647 | AKIRIN1 | P20T-E | Human | Esophagus | ESCC | 7.13e-21 | 4.84e-01 | 0.1124 |
| Page: 1 2 3 4 5 6 7 |
| Tissue | Expression Dynamics | Abbreviation |
| Esophagus | 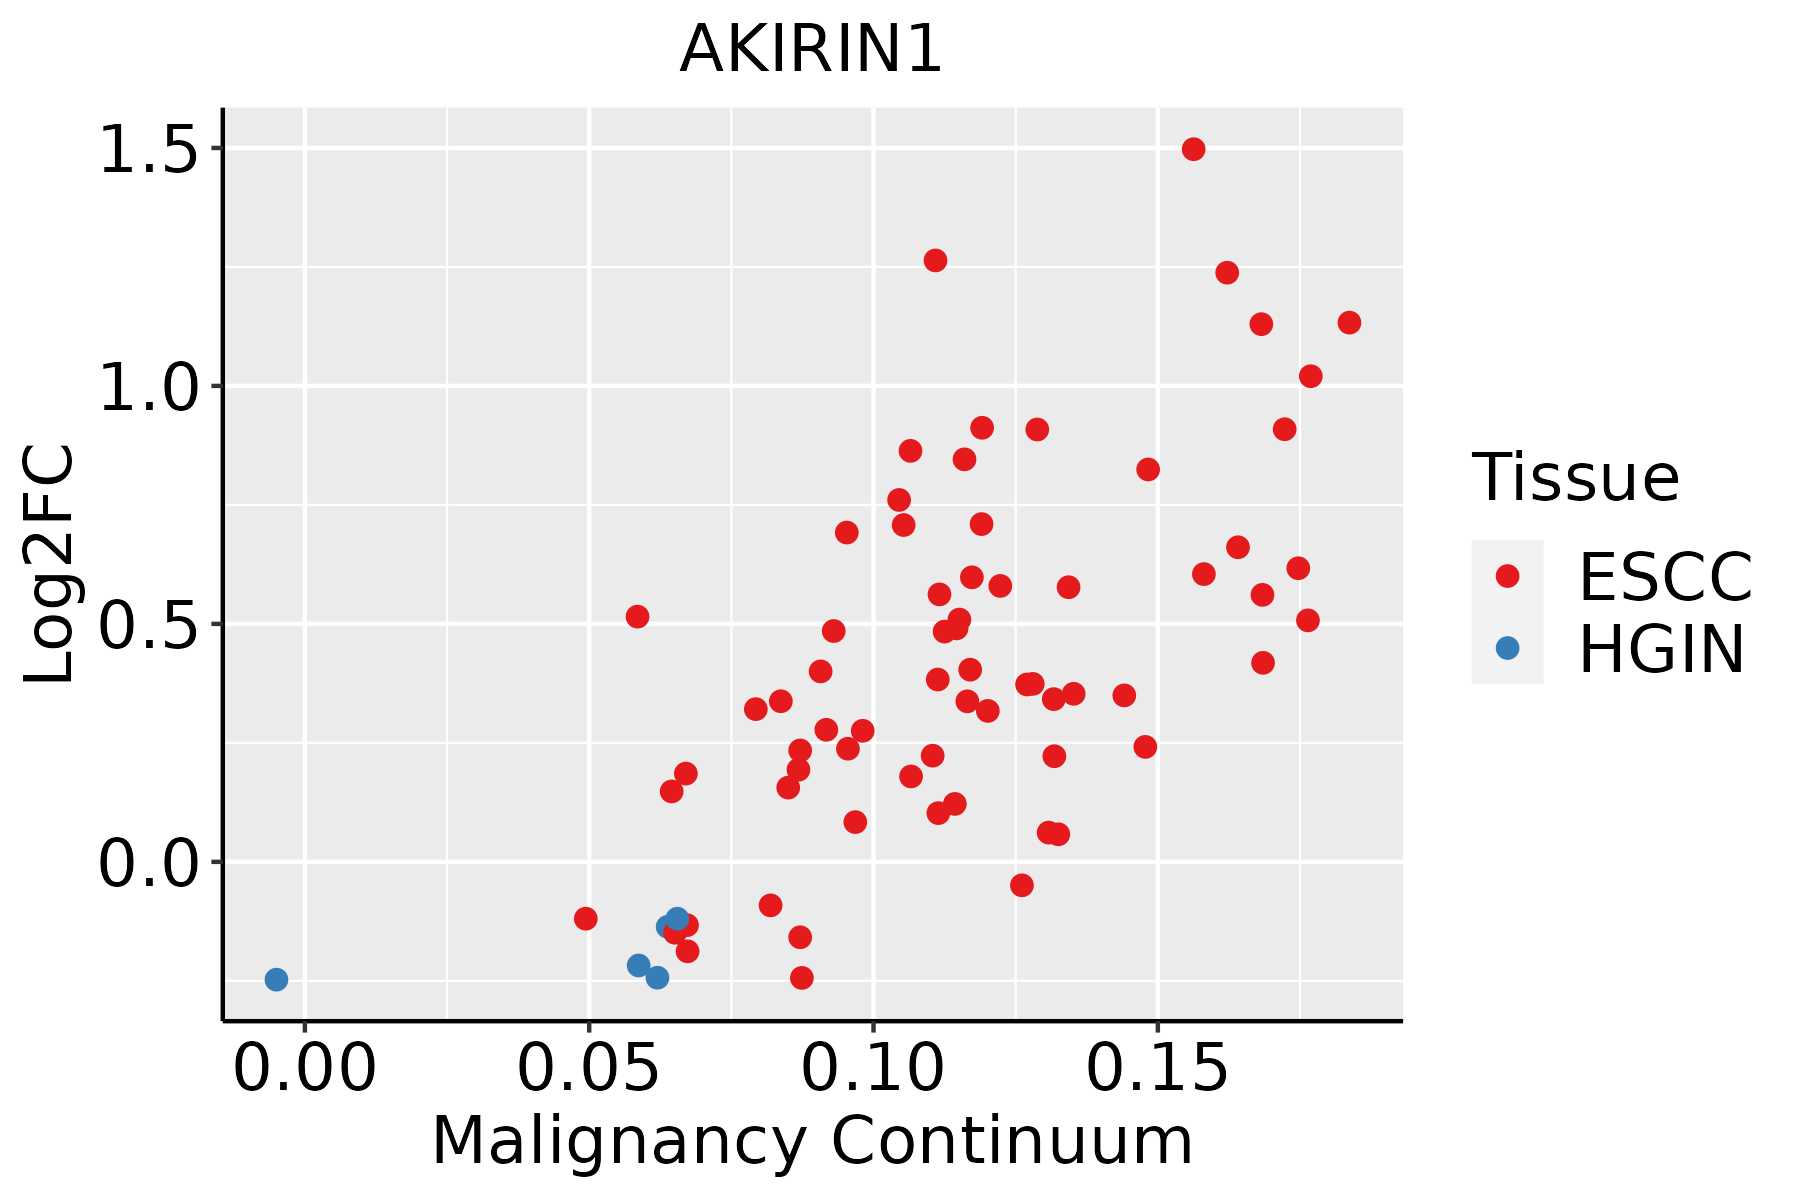 | ESCC: Esophageal squamous cell carcinoma |
| HGIN: High-grade intraepithelial neoplasias | ||
| LGIN: Low-grade intraepithelial neoplasias | ||
| Liver | 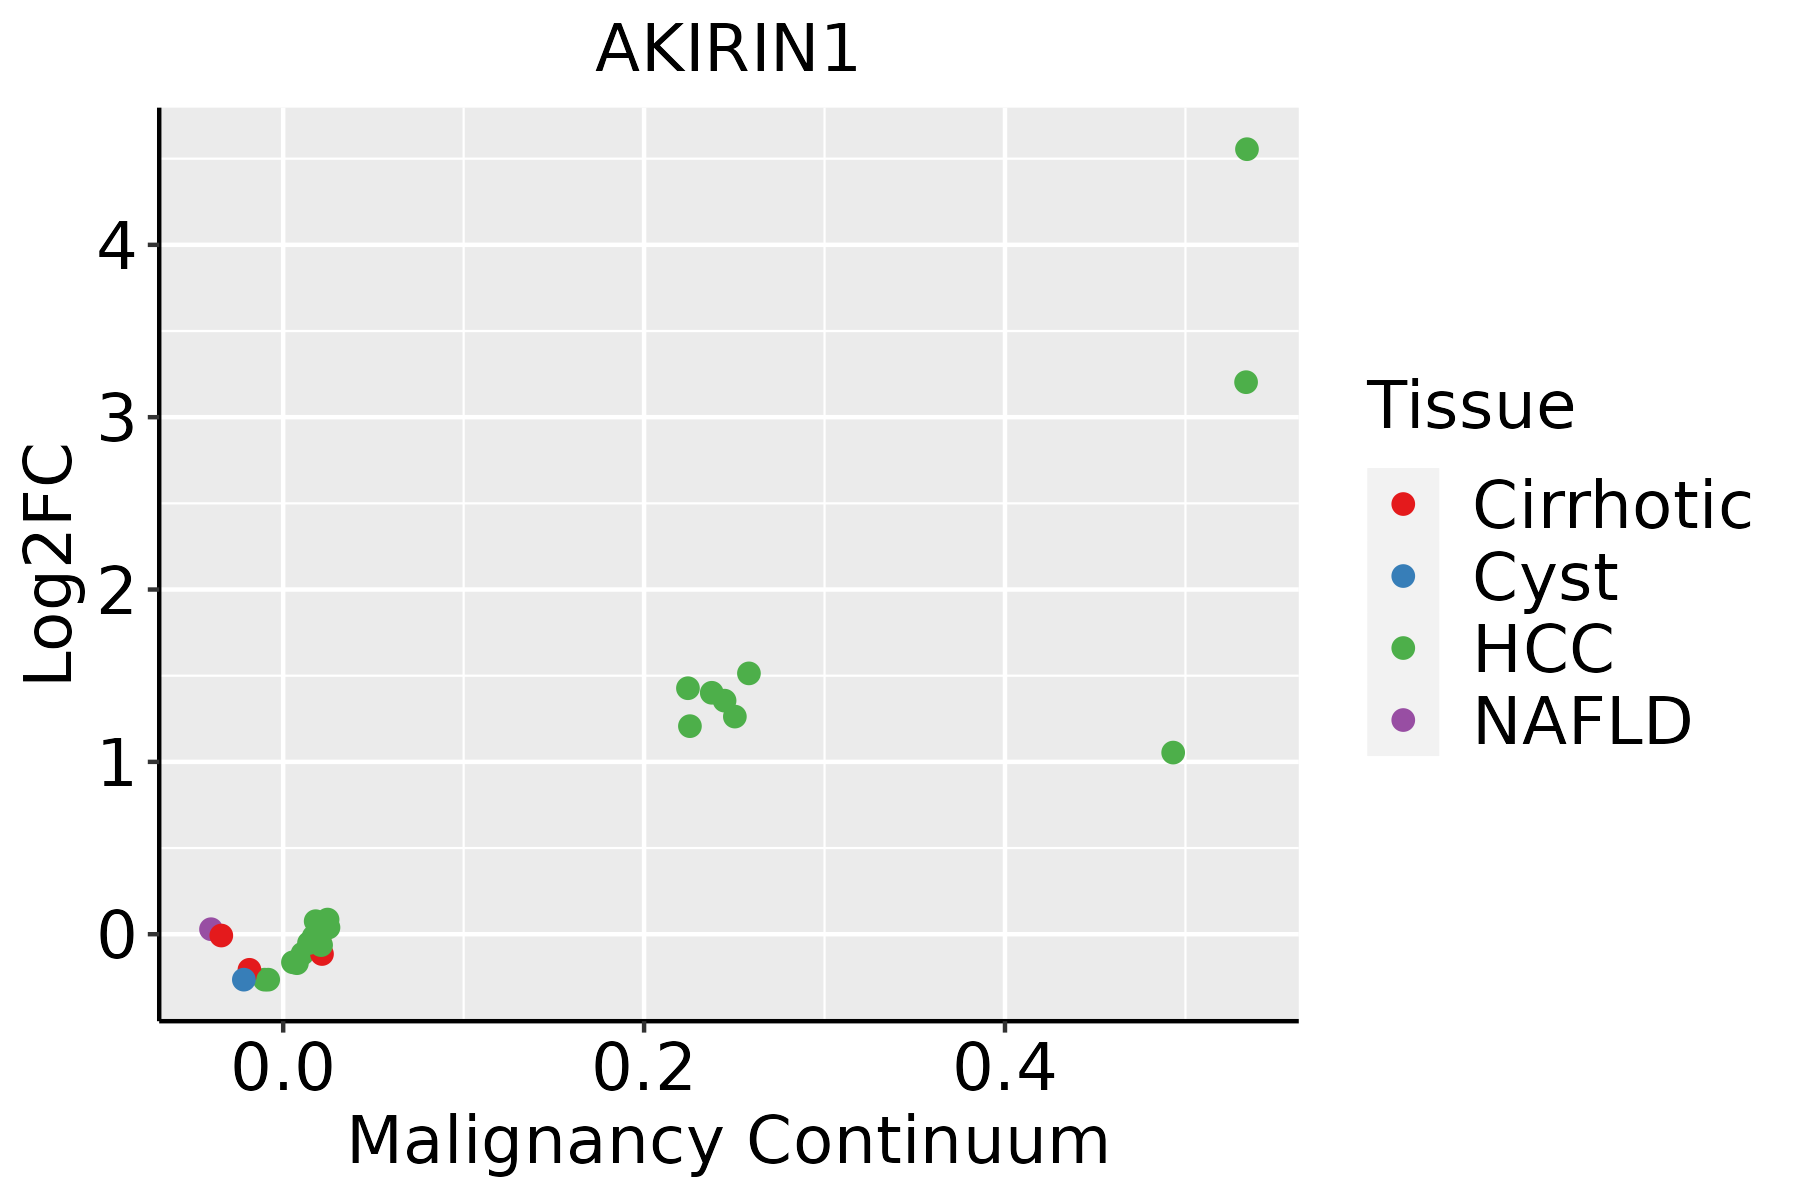 | HCC: Hepatocellular carcinoma |
| NAFLD: Non-alcoholic fatty liver disease | ||
| Oral Cavity | 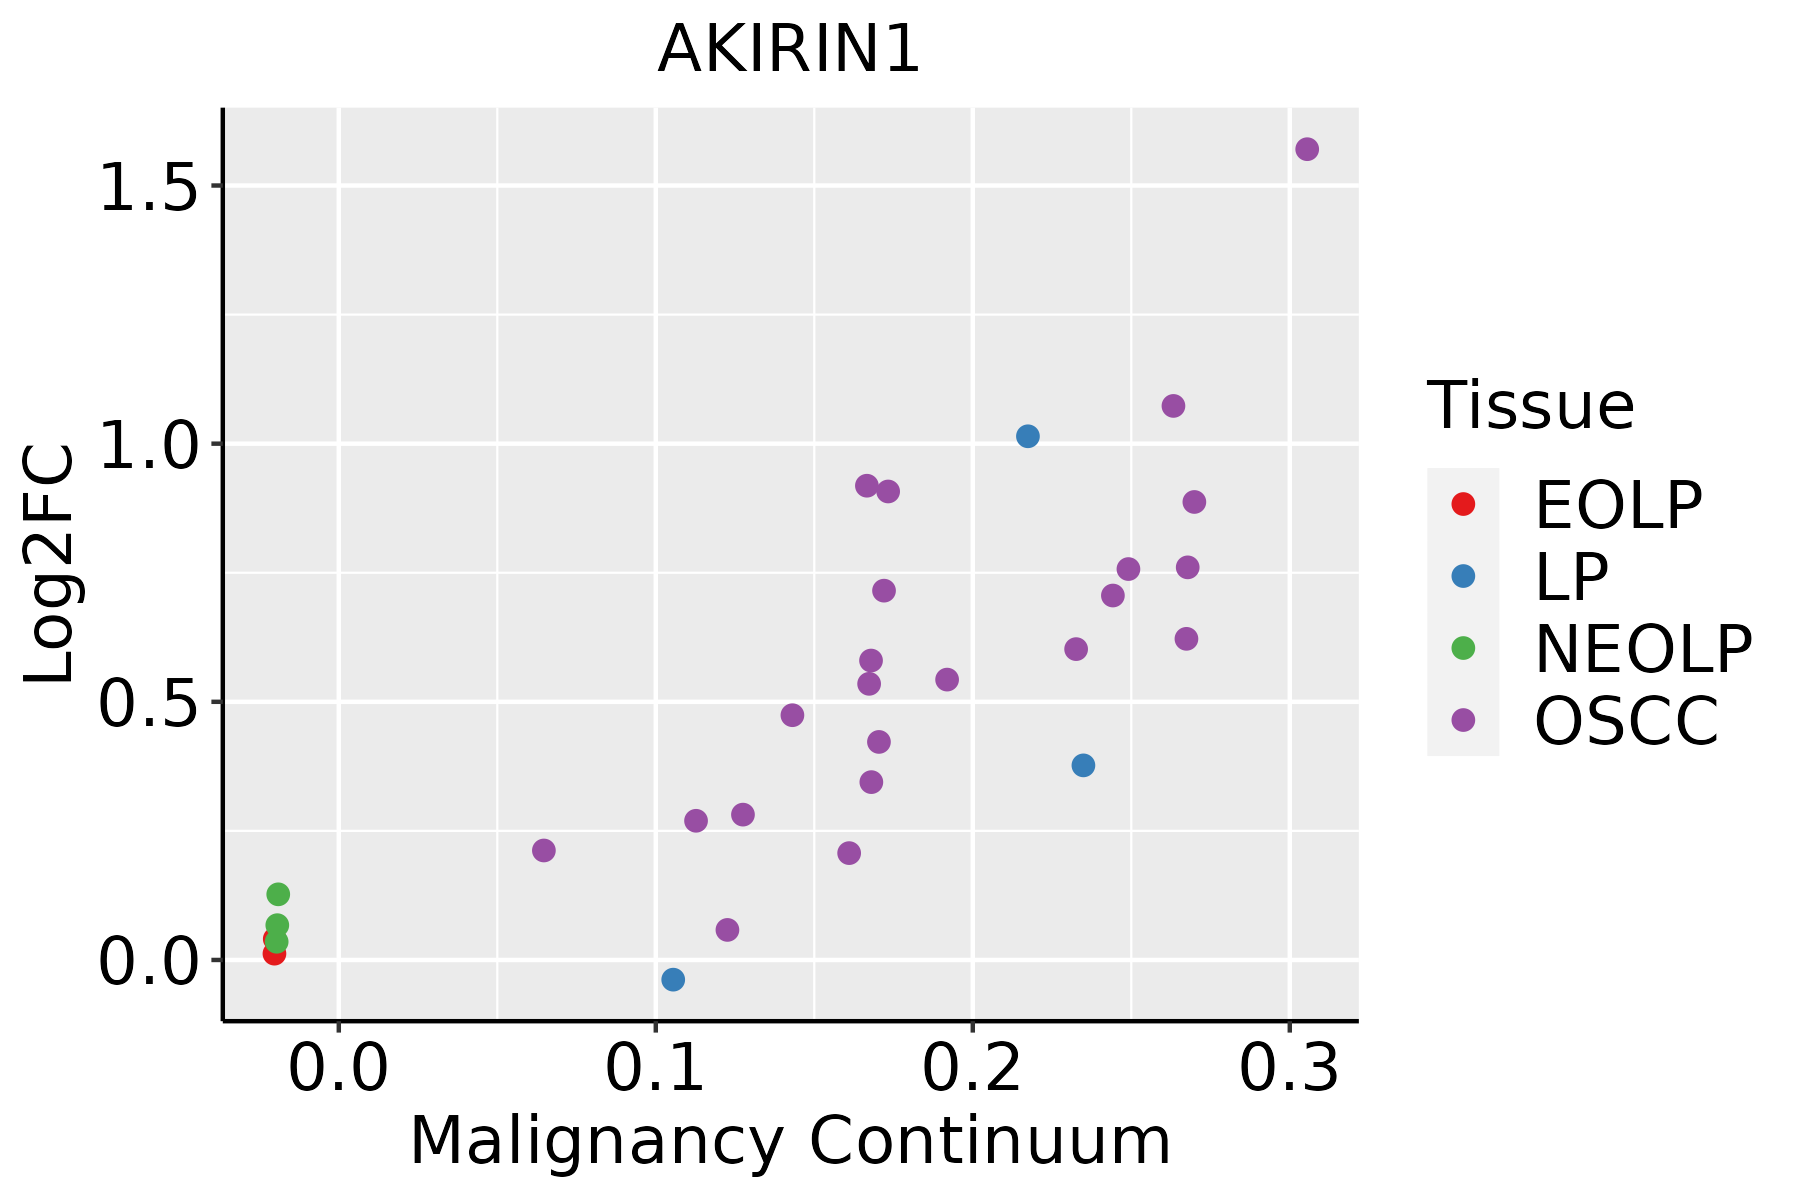 | EOLP: Erosive Oral lichen planus |
| LP: leukoplakia | ||
| NEOLP: Non-erosive oral lichen planus | ||
| OSCC: Oral squamous cell carcinoma | ||
| Prostate | 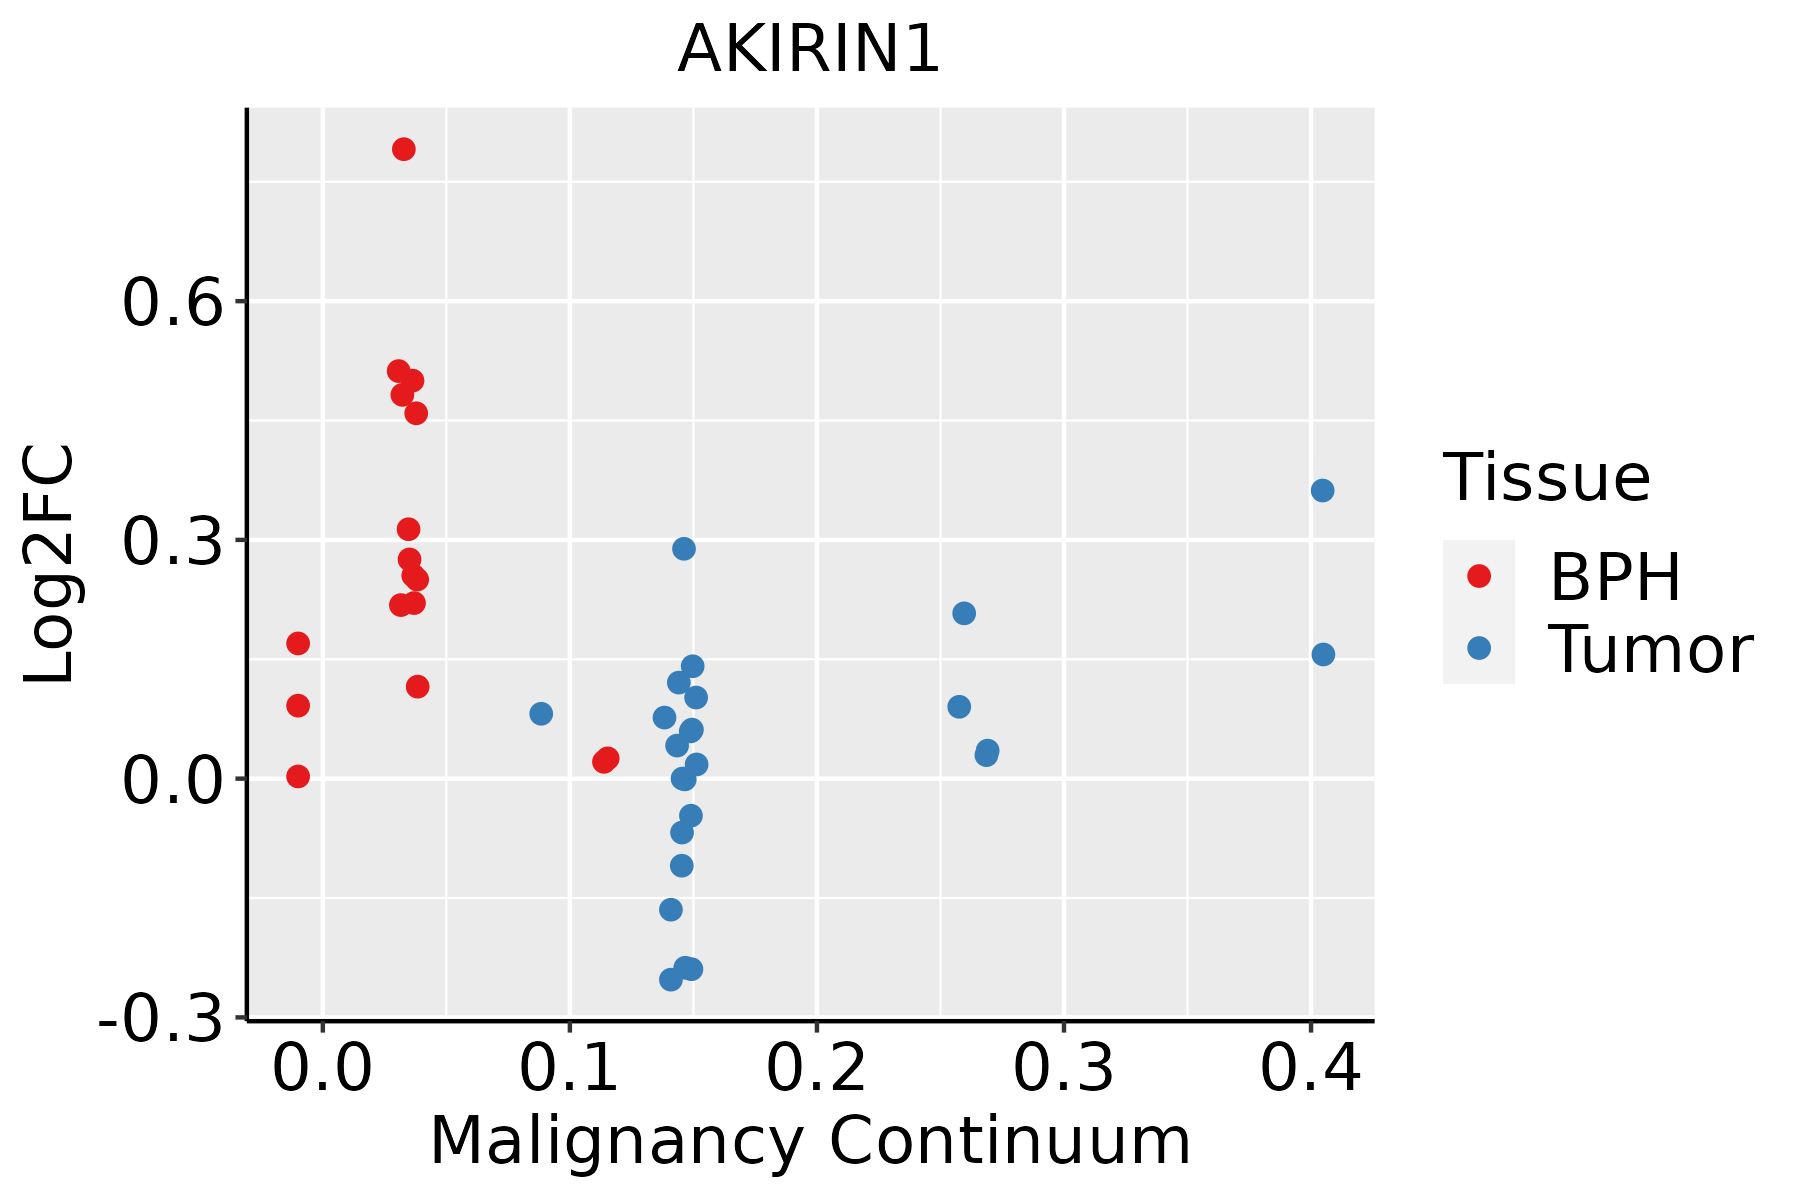 | BPH: Benign Prostatic Hyperplasia |
| Skin | 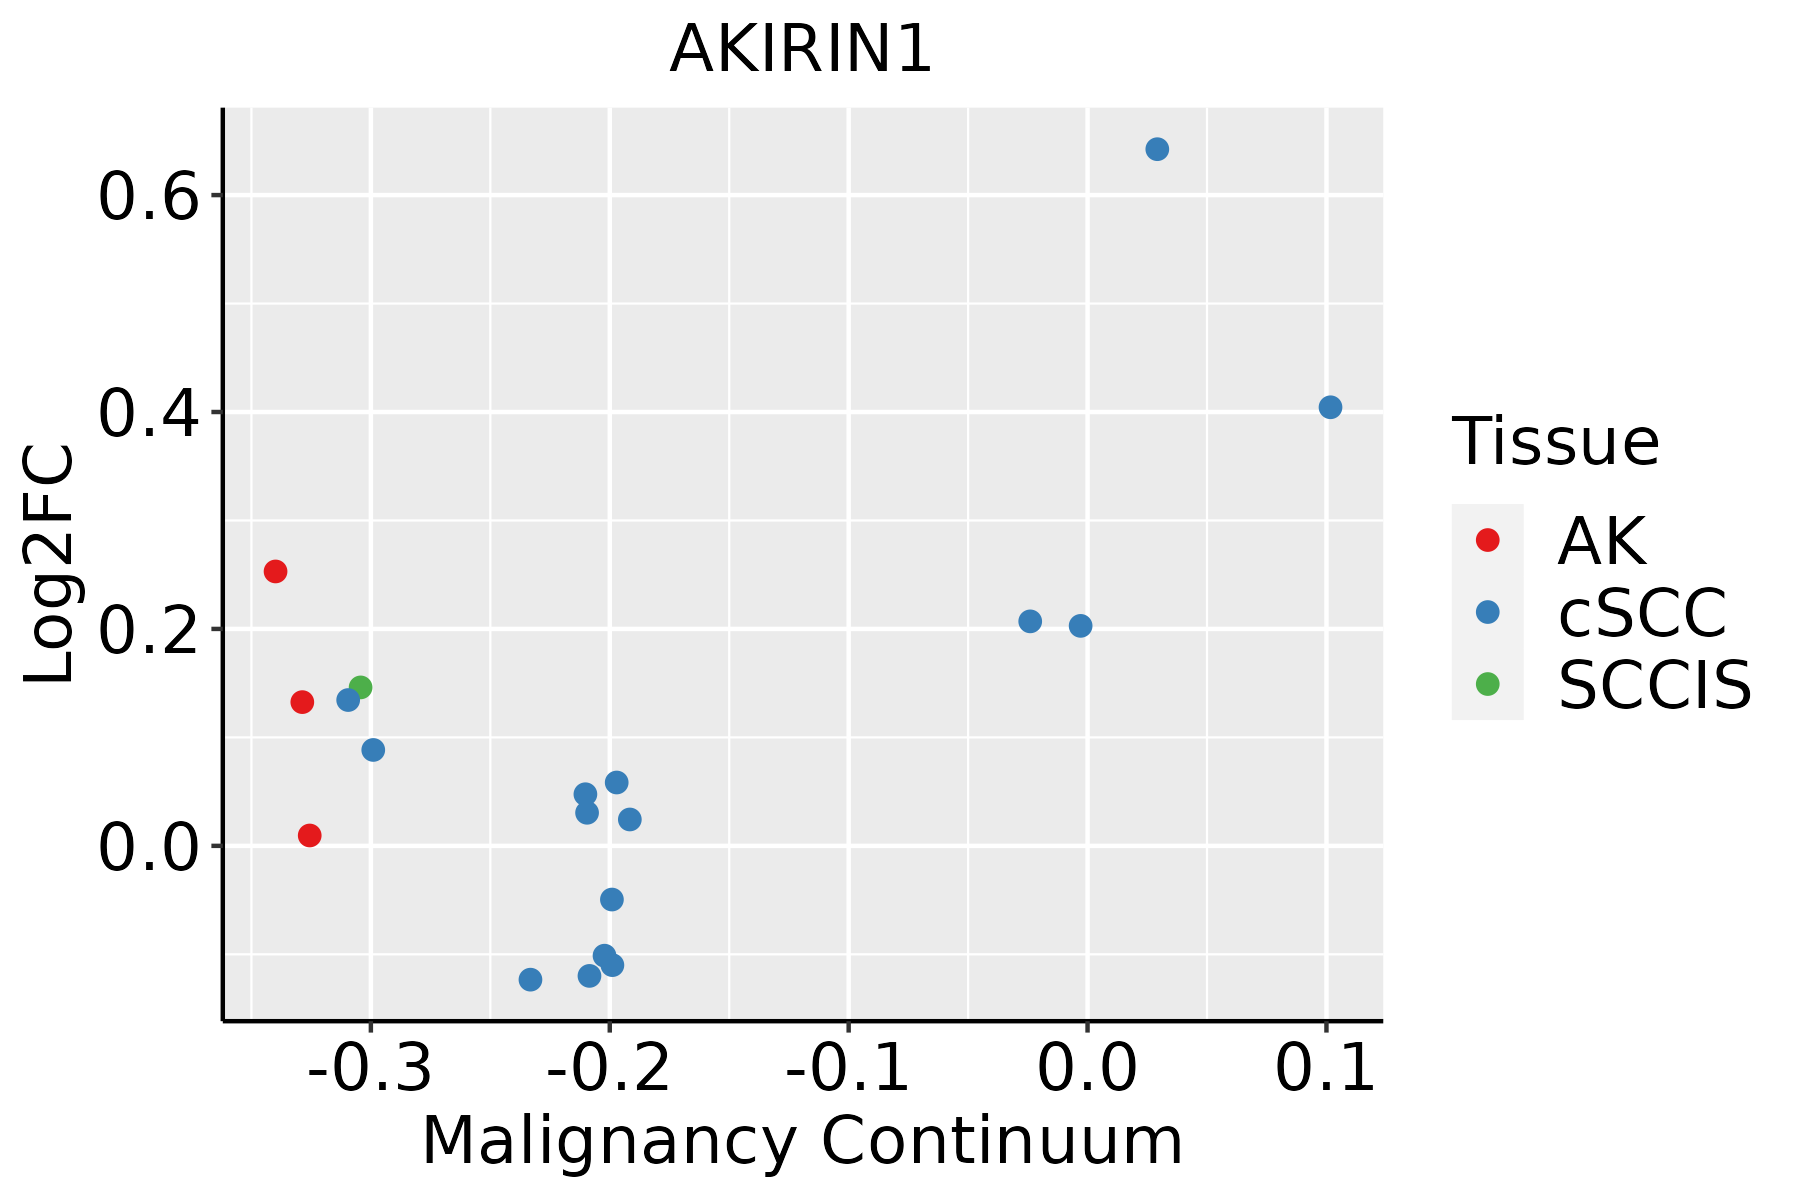 | AK: Actinic keratosis |
| cSCC: Cutaneous squamous cell carcinoma | ||
| SCCIS:squamous cell carcinoma in situ | ||
| Thyroid | 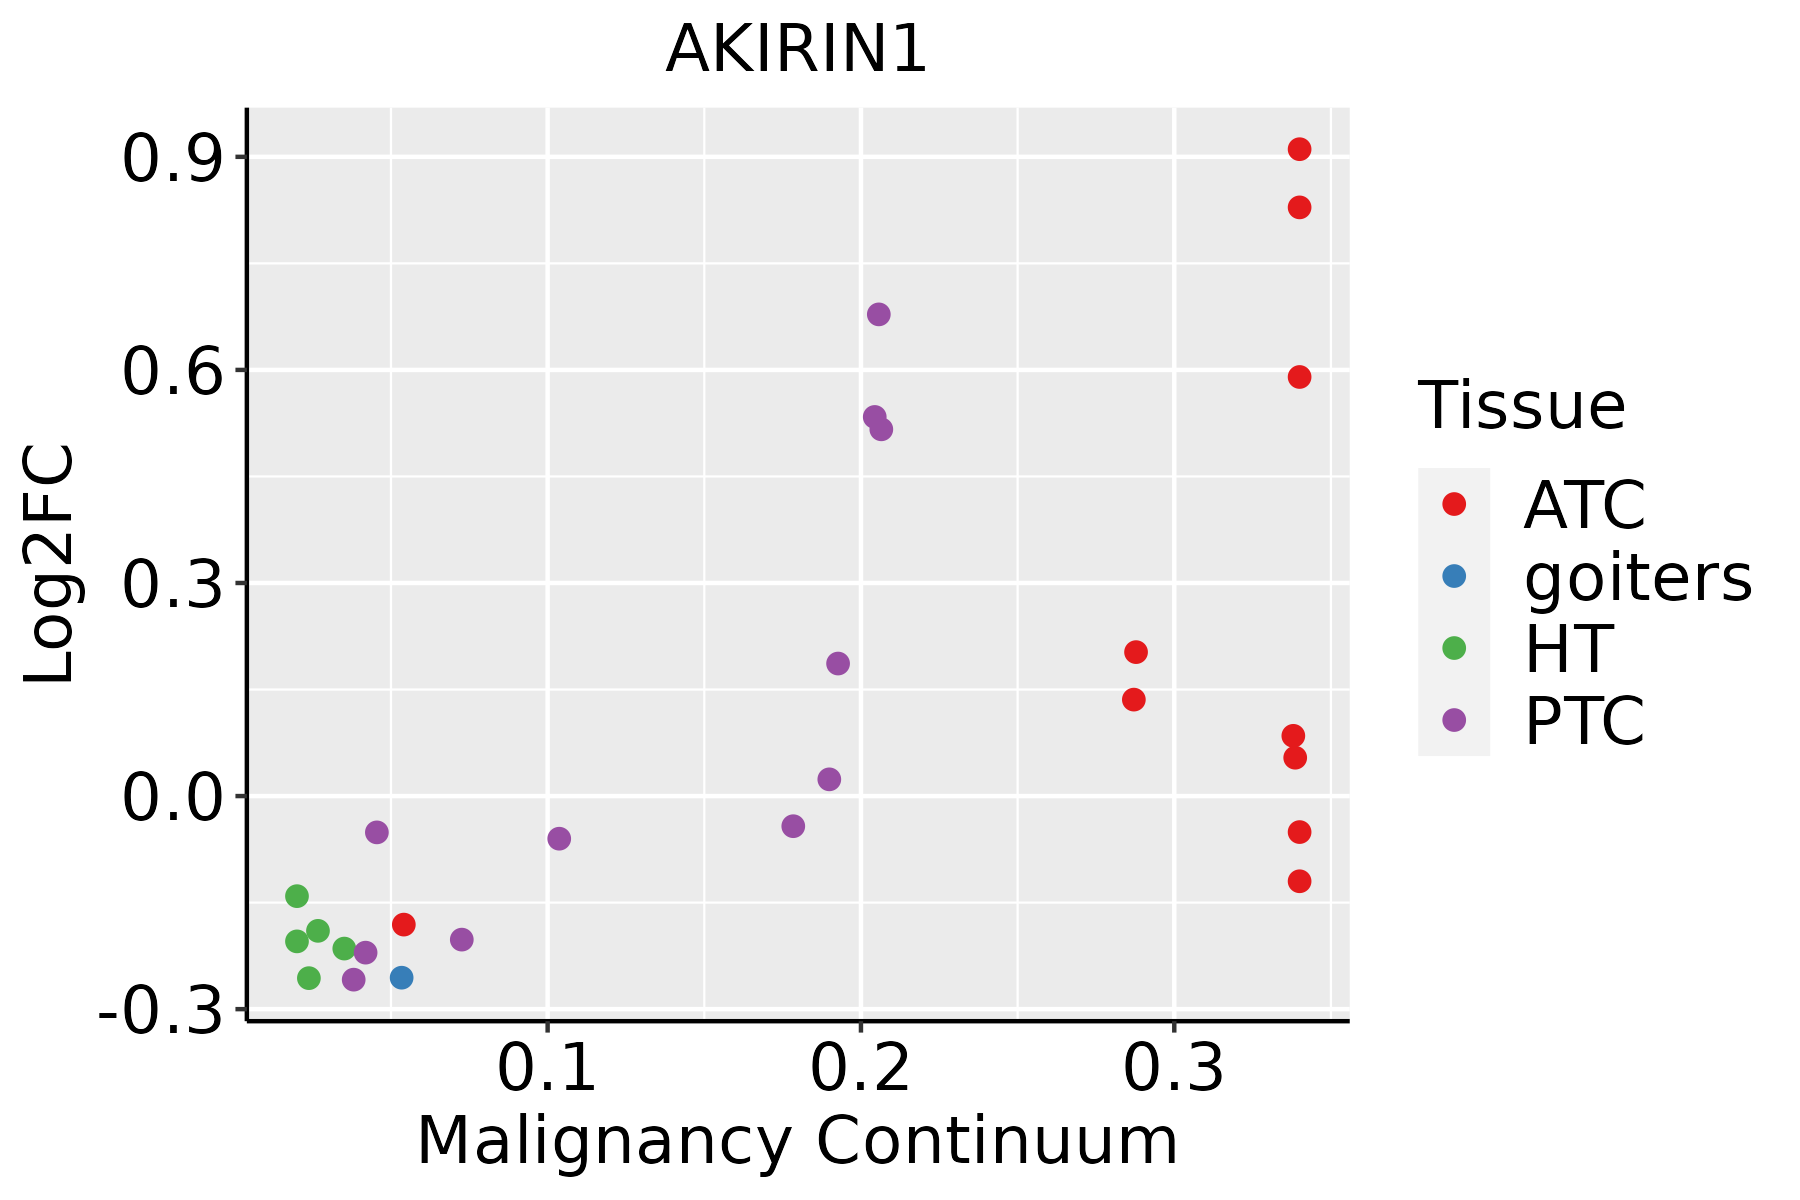 | ATC: Anaplastic thyroid cancer |
| HT: Hashimoto's thyroiditis | ||
| PTC: Papillary thyroid cancer |
| ∗log2FC in expression of this searched gene in stem-like cells from each diseased tissue sample relative to stem-like cells in normal samples in each tissue plotted against the malignancy continuum. Samples are colored based on if they are from different disease stage. |
Top |
Malignant transformation related pathway analysis |
| Find out the enriched GO biological processes and KEGG pathways involved in transition from healthy to precancer to cancer |
| Tissue | Disease Stage | Enriched GO biological Processes |
| Colorectum | AD |  |
| Colorectum | SER |  |
| Colorectum | MSS |  |
| Colorectum | MSI-H |  |
| Colorectum | FAP |  |
| ∗Top 15 enriched GO BP terms are showed in the bar plot of each disease state in each tissue. Each row represents a significant GO biological process which is colored according to the -log10(p.adjust). |
| Page: 1 2 3 4 5 6 7 8 9 |
| GO ID | Tissue | Disease Stage | Description | Gene Ratio | Bg Ratio | pvalue | p.adjust | Count |
| GO:00605379 | Esophagus | HGIN | muscle tissue development | 76/2587 | 403/18723 | 2.67e-03 | 2.63e-02 | 76 |
| GO:00147068 | Esophagus | HGIN | striated muscle tissue development | 72/2587 | 384/18723 | 3.94e-03 | 3.56e-02 | 72 |
| GO:006049117 | Esophagus | HGIN | regulation of cell projection assembly | 39/2587 | 188/18723 | 5.61e-03 | 4.57e-02 | 39 |
| GO:003109910 | Esophagus | ESCC | regeneration | 122/8552 | 198/18723 | 4.26e-06 | 4.57e-05 | 122 |
| GO:003134616 | Esophagus | ESCC | positive regulation of cell projection organization | 201/8552 | 353/18723 | 1.19e-05 | 1.11e-04 | 201 |
| GO:006049118 | Esophagus | ESCC | regulation of cell projection assembly | 110/8552 | 188/18723 | 2.60e-04 | 1.58e-03 | 110 |
| GO:012003218 | Esophagus | ESCC | regulation of plasma membrane bounded cell projection assembly | 108/8552 | 186/18723 | 4.37e-04 | 2.46e-03 | 108 |
| GO:01200347 | Esophagus | ESCC | positive regulation of plasma membrane bounded cell projection assembly | 64/8552 | 105/18723 | 1.15e-03 | 5.70e-03 | 64 |
| GO:00454454 | Esophagus | ESCC | myoblast differentiation | 52/8552 | 84/18723 | 1.98e-03 | 8.90e-03 | 52 |
| GO:006053716 | Esophagus | ESCC | muscle tissue development | 211/8552 | 403/18723 | 3.84e-03 | 1.56e-02 | 211 |
| GO:00330025 | Esophagus | ESCC | muscle cell proliferation | 134/8552 | 248/18723 | 4.80e-03 | 1.86e-02 | 134 |
| GO:000268515 | Esophagus | ESCC | regulation of leukocyte migration | 114/8552 | 210/18723 | 7.26e-03 | 2.63e-02 | 114 |
| GO:009758116 | Esophagus | ESCC | lamellipodium organization | 53/8552 | 90/18723 | 7.92e-03 | 2.82e-02 | 53 |
| GO:190274515 | Esophagus | ESCC | positive regulation of lamellipodium organization | 24/8552 | 37/18723 | 1.46e-02 | 4.74e-02 | 24 |
| GO:001470615 | Esophagus | ESCC | striated muscle tissue development | 197/8552 | 384/18723 | 1.46e-02 | 4.74e-02 | 197 |
| GO:009758111 | Liver | Cirrhotic | lamellipodium organization | 40/4634 | 90/18723 | 3.48e-05 | 4.26e-04 | 40 |
| GO:003109911 | Liver | Cirrhotic | regeneration | 71/4634 | 198/18723 | 3.02e-04 | 2.65e-03 | 71 |
| GO:001059211 | Liver | Cirrhotic | positive regulation of lamellipodium assembly | 16/4634 | 29/18723 | 4.36e-04 | 3.55e-03 | 16 |
| GO:190274511 | Liver | Cirrhotic | positive regulation of lamellipodium organization | 19/4634 | 37/18723 | 4.39e-04 | 3.57e-03 | 19 |
| GO:190274311 | Liver | Cirrhotic | regulation of lamellipodium organization | 25/4634 | 54/18723 | 4.63e-04 | 3.75e-03 | 25 |
| Page: 1 2 3 4 5 6 7 8 9 10 |
| Pathway ID | Tissue | Disease Stage | Description | Gene Ratio | Bg Ratio | pvalue | p.adjust | qvalue | Count |
| Page: 1 |
Top |
Cell-cell communication analysis |
| Identification of potential cell-cell interactions between two cell types and their ligand-receptor pairs for different disease states |
| Ligand | Receptor | LRpair | Pathway | Tissue | Disease Stage |
| Page: 1 |
Top |
Single-cell gene regulatory network inference analysis |
| Find out the significant the regulons (TFs) and the target genes of each regulon across cell types for different disease states |
| TF | Cell Type | Tissue | Disease Stage | Target Gene | RSS | Regulon Activity |
| ∗The dot plots of a searched regulon are shown for all cell subpopulations in each disease state of each tissue based on the regulon specific score inferred using pySCENIC and by calculating the average expression. |
| Page: 1 |
Top |
Somatic mutation of malignant transformation related genes |
| Annotation of somatic variants for genes involved in malignant transformation |
| Hugo Symbol | Variant Class | Variant Classification | dbSNP RS | HGVSc | HGVSp | HGVSp Short | SWISSPROT | BIOTYPE | SIFT | PolyPhen | Tumor Sample Barcode | Tissue | Histology | Sex | Age | Stage | Therapy Types | Drugs | Outcome |
| AKIRIN1 | SNV | Missense_Mutation | c.295N>G | p.Gln99Glu | p.Q99E | Q9H9L7 | protein_coding | tolerated(0.1) | probably_damaging(0.99) | TCGA-E9-A3QA-01 | Breast | breast invasive carcinoma | Female | <65 | I/II | Unknown | Unknown | SD | |
| AKIRIN1 | SNV | Missense_Mutation | novel | c.469G>A | p.Glu157Lys | p.E157K | Q9H9L7 | protein_coding | deleterious(0.01) | probably_damaging(0.962) | TCGA-DS-A1OB-01 | Cervix | cervical & endocervical cancer | Female | <65 | I/II | Chemotherapy | carboplatin | PD |
| AKIRIN1 | SNV | Missense_Mutation | rs753878747 | c.458G>A | p.Arg153Gln | p.R153Q | Q9H9L7 | protein_coding | tolerated(0.09) | possibly_damaging(0.811) | TCGA-MA-AA42-01 | Cervix | cervical & endocervical cancer | Female | >=65 | I/II | Unknown | Unknown | SD |
| AKIRIN1 | SNV | Missense_Mutation | novel | c.567N>A | p.Ser189Arg | p.S189R | Q9H9L7 | protein_coding | deleterious(0) | probably_damaging(0.997) | TCGA-B5-A3FA-01 | Endometrium | uterine corpus endometrioid carcinoma | Female | >=65 | I/II | Unknown | Unknown | SD |
| AKIRIN1 | SNV | Missense_Mutation | rs764613354 | c.225A>C | p.Gln75His | p.Q75H | Q9H9L7 | protein_coding | deleterious(0) | possibly_damaging(0.805) | TCGA-FI-A2D0-01 | Endometrium | uterine corpus endometrioid carcinoma | Female | <65 | I/II | Unknown | Unknown | SD |
| AKIRIN1 | SNV | Missense_Mutation | novel | c.428N>T | p.Arg143Leu | p.R143L | Q9H9L7 | protein_coding | deleterious(0) | possibly_damaging(0.806) | TCGA-QS-A744-01 | Endometrium | uterine corpus endometrioid carcinoma | Female | >=65 | III/IV | Chemotherapy | carboplatin | SD |
| AKIRIN1 | SNV | Missense_Mutation | rs781305153 | c.314C>T | p.Ser105Leu | p.S105L | Q9H9L7 | protein_coding | tolerated(0.16) | benign(0.254) | TCGA-FV-A23B-01 | Liver | liver hepatocellular carcinoma | Female | >=65 | I/II | Unknown | Unknown | PD |
| AKIRIN1 | SNV | Missense_Mutation | novel | c.256C>A | p.Arg86Ser | p.R86S | Q9H9L7 | protein_coding | deleterious(0) | probably_damaging(0.91) | TCGA-86-7701-01 | Lung | lung adenocarcinoma | Male | >=65 | III/IV | Chemotherapy | etoposide | PD |
| AKIRIN1 | SNV | Missense_Mutation | c.180N>T | p.Gln60His | p.Q60H | Q9H9L7 | protein_coding | tolerated(0.09) | benign(0.346) | TCGA-33-4532-01 | Lung | lung squamous cell carcinoma | Male | >=65 | I/II | Unknown | Unknown | SD |
| Page: 1 |
Top |
Related drugs of malignant transformation related genes |
| Identification of chemicals and drugs interact with genes involved in malignant transfromation |
| (DGIdb 4.0) |
| Entrez ID | Symbol | Category | Interaction Types | Drug Claim Name | Drug Name | PMIDs |
| Page: 1 |

Copyright 2023-Present -The University of Texas Health Science Center at Houston |