Schematic overview of the cellular and molecular mechanisms involved in the cancer progression, including the proposed cellular and molecular mechanisms in cancer cells trajectory. AT1: alveolar type 1 cells; AT2: alveolar type 2 cells; AAH: atypical adenomatous hyperplasia; AIS: adenocarcinoma in situ; MIA: minimally invasive adenocarcinoma; IA: invasive adenocarcinoma; EMT: epithelial-mesenchymal transition

Home

Download

Statistics

Help

Contact

Center for Computational Systems Medicine
leaf

Gene summary

leaf

Malignant transformation analysis

leaf

Malignant transformation related pathway analysis

leaf

Cell-cell communication analysis

leaf

Single-cell gene regulatory network inference analysis

leaf

Somatic mutation of malignant transformation related genes

leaf

Related drugs of malignant transformation related genes

Gene: AKIP1

Gene summary for AKIP1

check button Gene summary.

Gene informationSpeciesHuman
Gene symbol

AKIP1

Gene ID

56672

Gene nameA-kinase interacting protein 1
Gene AliasBCA3
Cytomap11p15.4
Gene Typeprotein-coding
GO ID

GO:0000902

UniProtAcc

Q9NQ31


Top

Malignant transformation analysis

check button Identification of the aberrant gene expression in precancerous and cancerous lesions by comparing the gene expression of stem-like cells in diseased tissues with normal stem cells
check button Malignant transformation involving gene list.
Entrez IDSymbolReplicatesSpeciesOrganTissueAdj P-valueLog2FCMalignancy
56672AKIP1LZE4THumanEsophagusESCC3.82e-093.07e-010.0811
56672AKIP1LZE7THumanEsophagusESCC2.34e-148.65e-010.0667
56672AKIP1LZE20THumanEsophagusESCC3.44e-032.33e-010.0662
56672AKIP1LZE24THumanEsophagusESCC2.29e-431.49e+000.0596
56672AKIP1LZE21THumanEsophagusESCC2.20e-055.10e-010.0655
56672AKIP1LZE6THumanEsophagusESCC9.72e-052.88e-010.0845
56672AKIP1P2T-EHumanEsophagusESCC9.98e-193.80e-010.1177
56672AKIP1P4T-EHumanEsophagusESCC5.09e-338.20e-010.1323
56672AKIP1P5T-EHumanEsophagusESCC5.66e-163.87e-010.1327
56672AKIP1P8T-EHumanEsophagusESCC8.58e-102.27e-010.0889
56672AKIP1P9T-EHumanEsophagusESCC4.32e-307.32e-010.1131
56672AKIP1P10T-EHumanEsophagusESCC4.20e-305.44e-010.116
56672AKIP1P11T-EHumanEsophagusESCC5.12e-166.36e-010.1426
56672AKIP1P12T-EHumanEsophagusESCC1.92e-408.82e-010.1122
56672AKIP1P15T-EHumanEsophagusESCC7.86e-215.32e-010.1149
56672AKIP1P16T-EHumanEsophagusESCC1.50e-161.91e-010.1153
56672AKIP1P17T-EHumanEsophagusESCC3.79e-125.96e-010.1278
56672AKIP1P19T-EHumanEsophagusESCC5.91e-138.61e-010.1662
56672AKIP1P20T-EHumanEsophagusESCC2.99e-235.75e-010.1124
56672AKIP1P21T-EHumanEsophagusESCC1.10e-265.93e-010.1617
Page: 1 2 3 4 5 6 

check button Transcriptomic changes along malignancy continuum.
TissueExpression DynamicsAbbreviation
EsophagusThe image shows the transcriptomic changes along malignancy continuum.log2FC in expression of this searched gene in stem-like cells from each diseased tissue sample relative to stem-like cells in normal samples in each tissue plotted against the malignancy continuum. Samples are colored based on if they are from different disease stage.ESCC: Esophageal squamous cell carcinoma
HGIN: High-grade intraepithelial neoplasias
LGIN: Low-grade intraepithelial neoplasias
LiverThe image shows the transcriptomic changes along malignancy continuum.log2FC in expression of this searched gene in stem-like cells from each diseased tissue sample relative to stem-like cells in normal samples in each tissue plotted against the malignancy continuum. Samples are colored based on if they are from different disease stage.
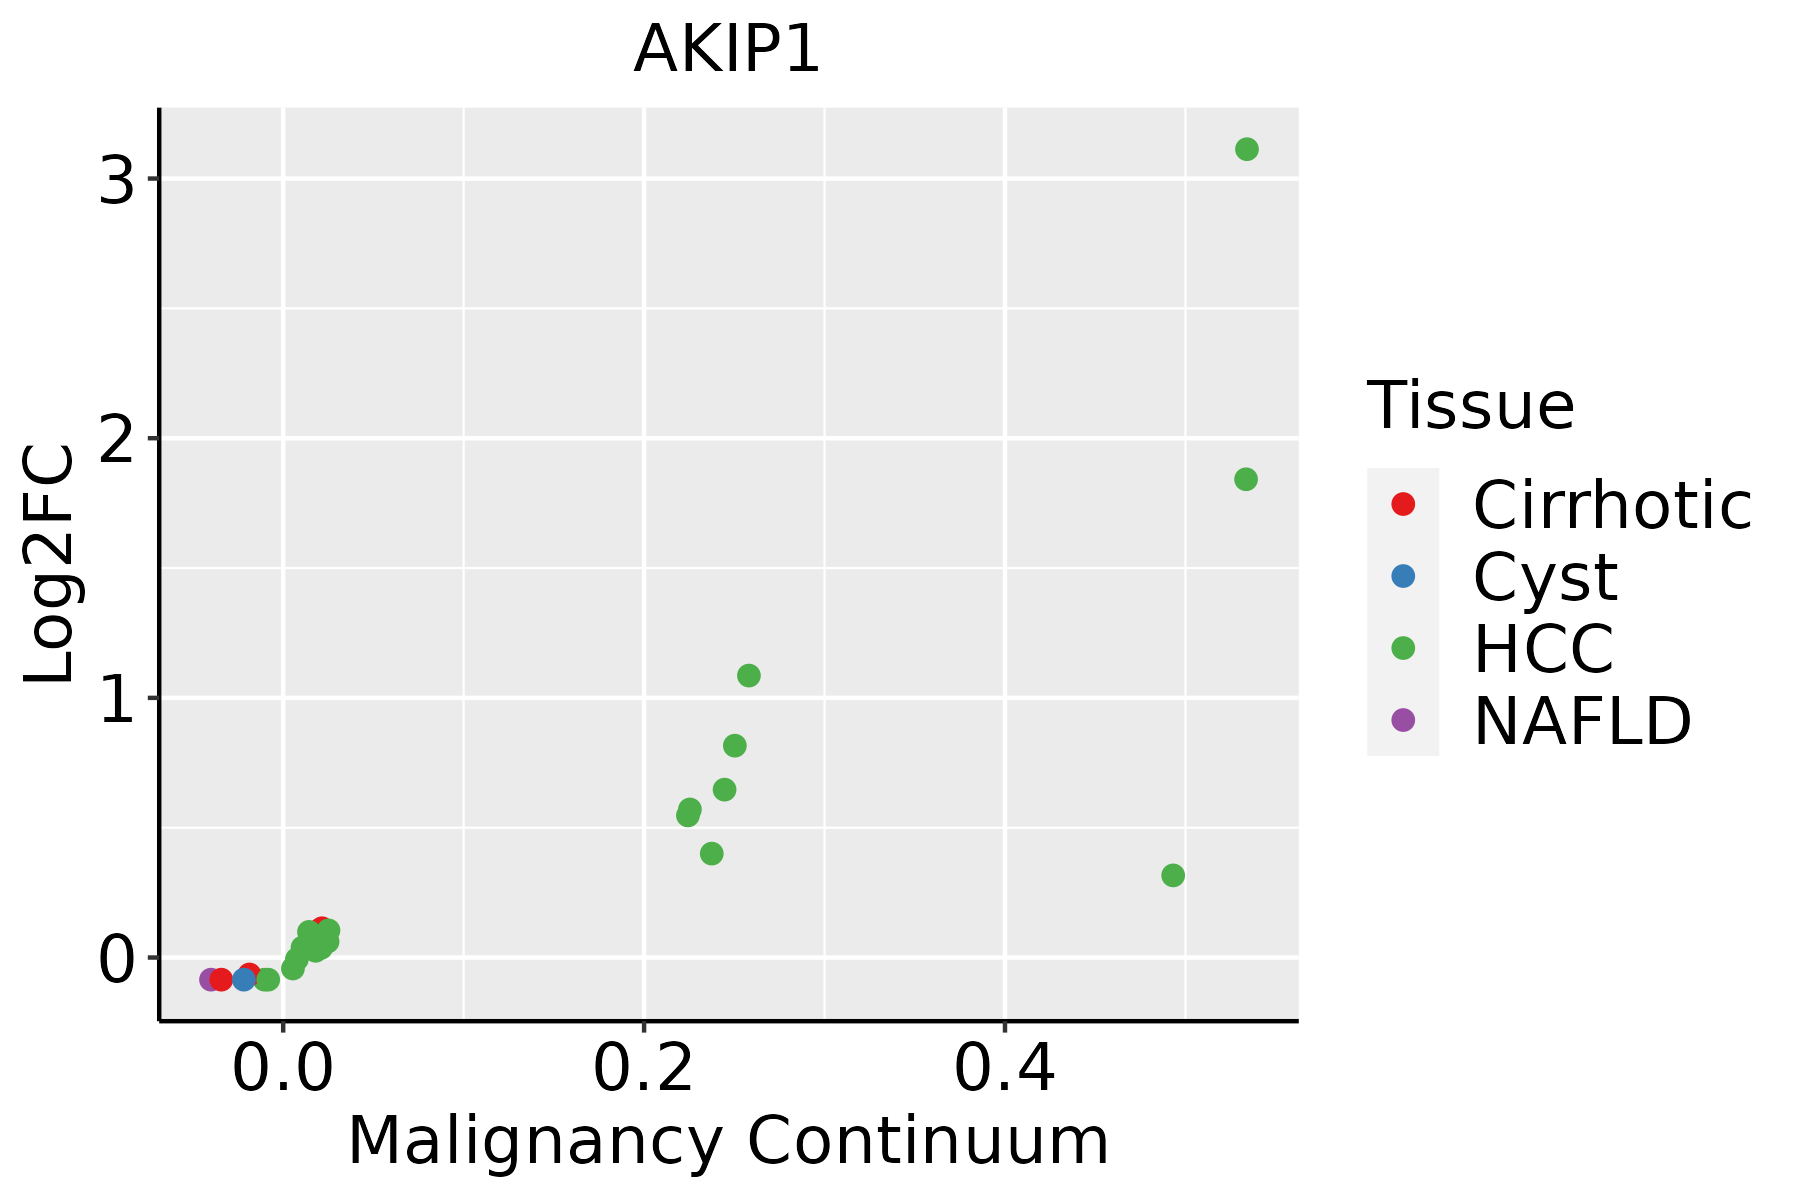
HCC: Hepatocellular carcinoma
NAFLD: Non-alcoholic fatty liver disease
Oral CavityThe image shows the transcriptomic changes along malignancy continuum.log2FC in expression of this searched gene in stem-like cells from each diseased tissue sample relative to stem-like cells in normal samples in each tissue plotted against the malignancy continuum. Samples are colored based on if they are from different disease stage.EOLP: Erosive Oral lichen planus
LP: leukoplakia
NEOLP: Non-erosive oral lichen planus
OSCC: Oral squamous cell carcinoma
SkinThe image shows the transcriptomic changes along malignancy continuum.log2FC in expression of this searched gene in stem-like cells from each diseased tissue sample relative to stem-like cells in normal samples in each tissue plotted against the malignancy continuum. Samples are colored based on if they are from different disease stage.
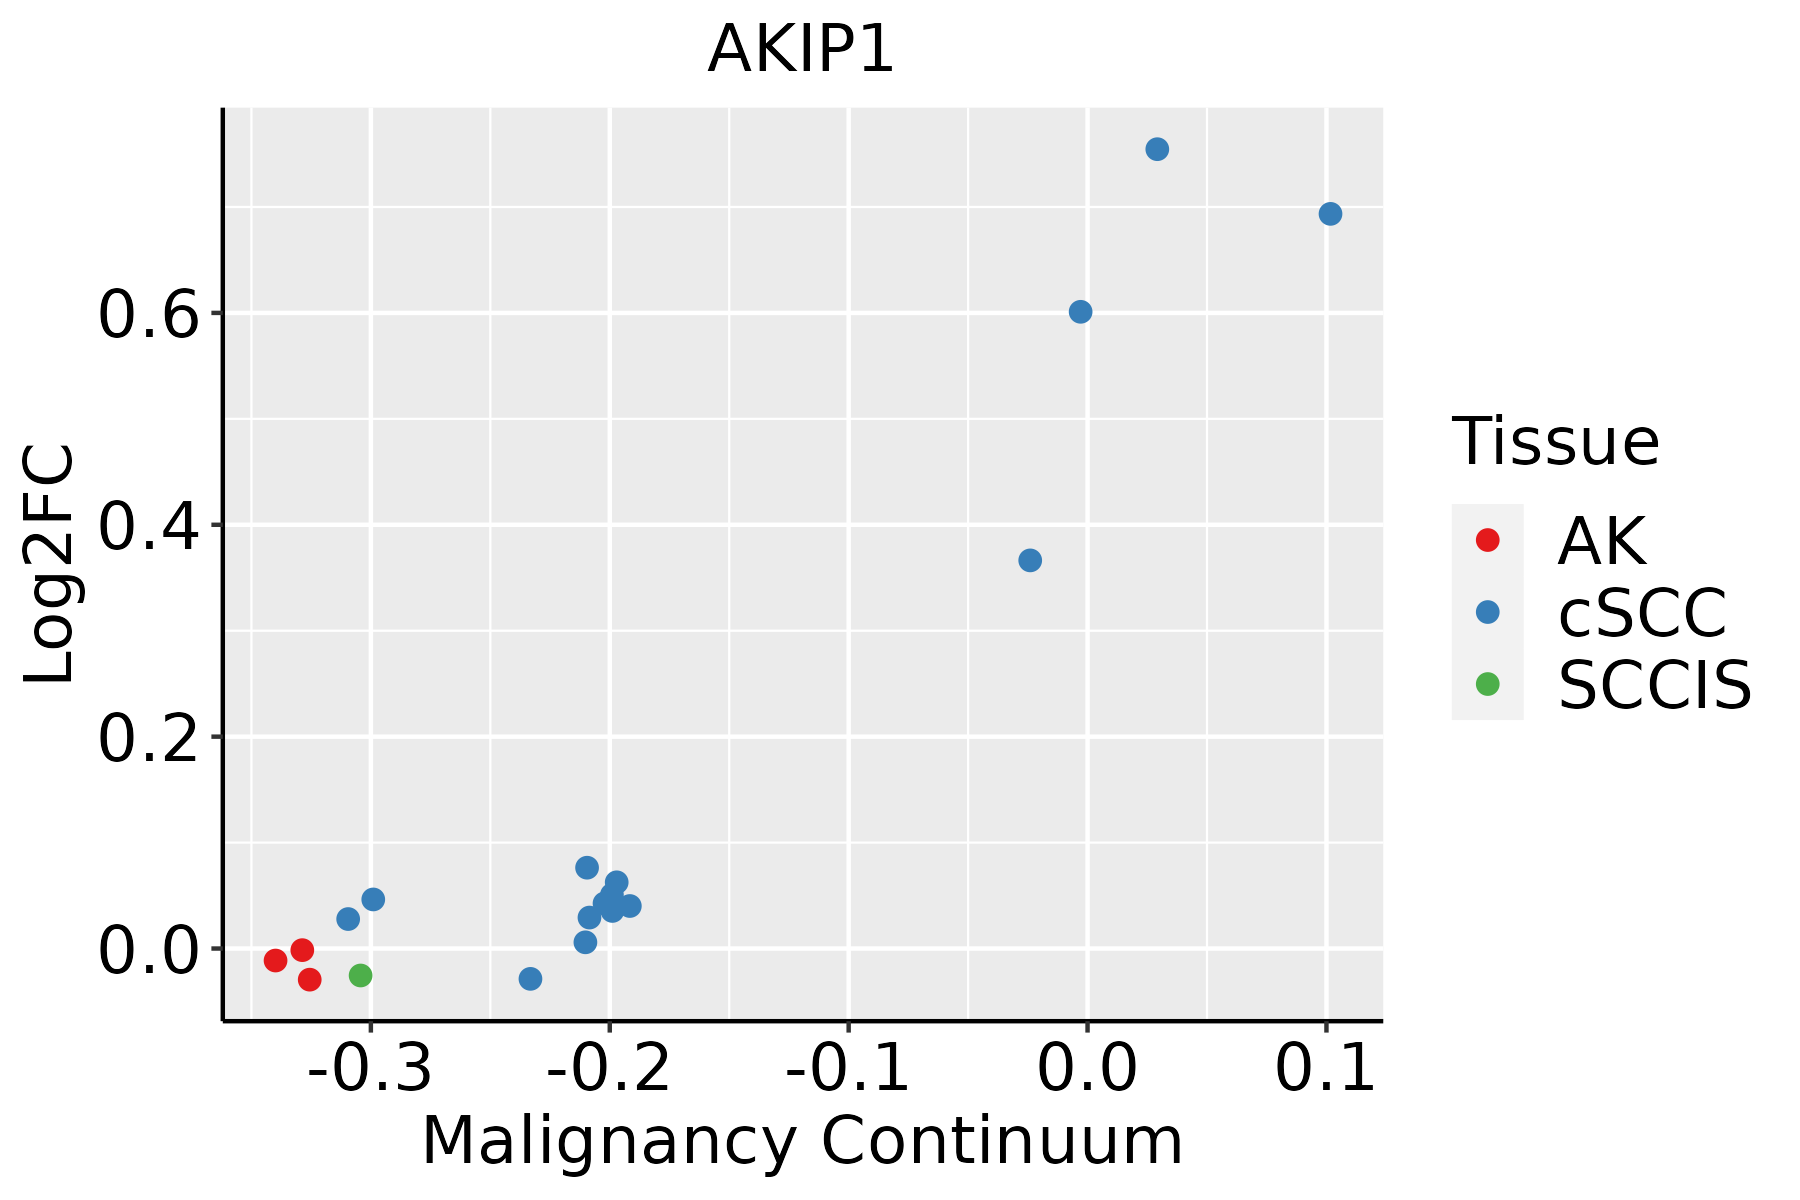
AK: Actinic keratosis
cSCC: Cutaneous squamous cell carcinoma
SCCIS:squamous cell carcinoma in situ
ThyroidThe image shows the transcriptomic changes along malignancy continuum.log2FC in expression of this searched gene in stem-like cells from each diseased tissue sample relative to stem-like cells in normal samples in each tissue plotted against the malignancy continuum. Samples are colored based on if they are from different disease stage.
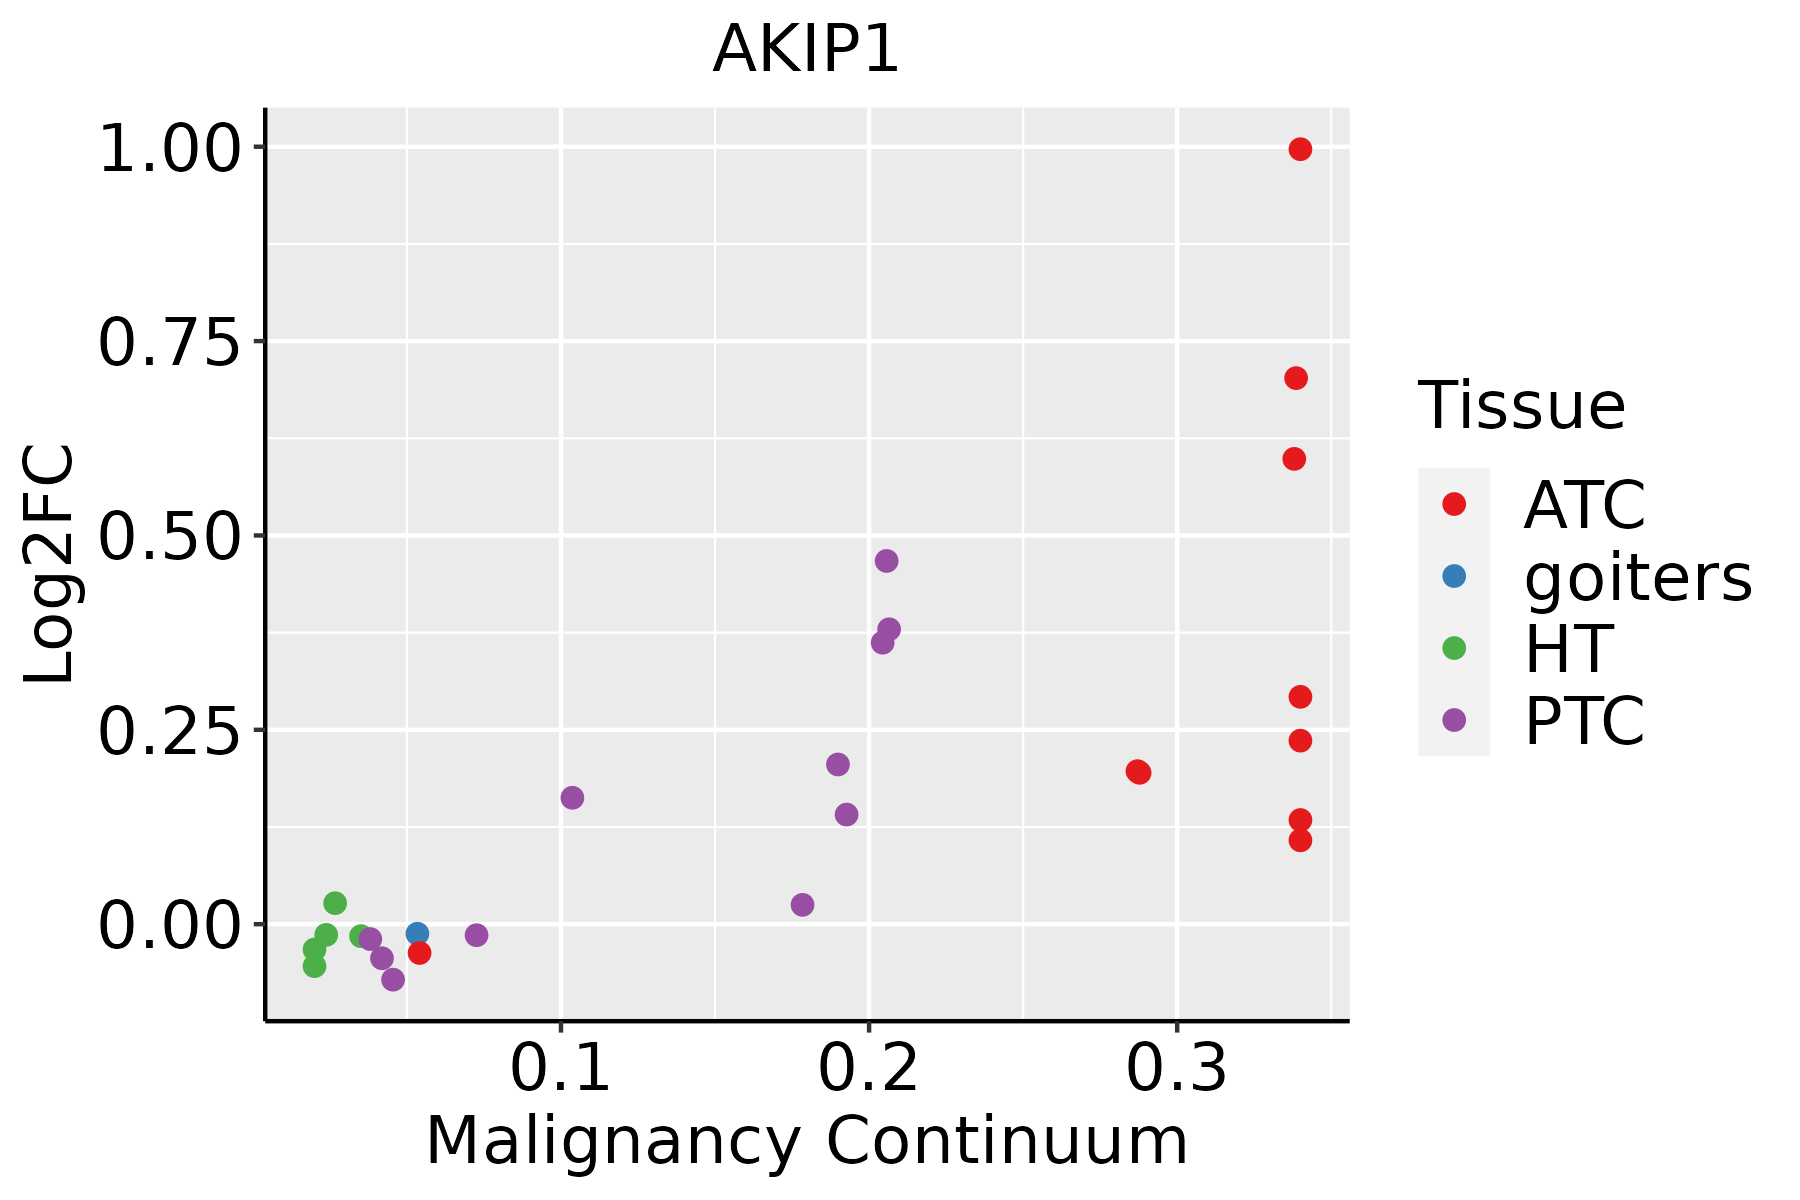
ATC: Anaplastic thyroid cancer
HT: Hashimoto's thyroiditis
PTC: Papillary thyroid cancer
∗log2FC in expression of this searched gene in stem-like cells from each diseased tissue sample relative to stem-like cells in normal samples in each tissue plotted against the malignancy continuum. Samples are colored based on if they are from different disease stage.

Top

Malignant transformation related pathway analysis

check buttonFind out the enriched GO biological processes and KEGG pathways involved in transition from healthy to precancer to cancer
check button Figure of enriched GO biological processes.
TissueDisease StageEnriched GO biological Processes
ColorectumADGO analysis - Figure of enriched GO biological processes: Top 15 enriched GO BP terms are showed in the bar plot of each disease state in each tissue. Each row represents a significant GO biological process which is colored according to the -log10(p.adjust).
ColorectumSERGO analysis - Figure of enriched GO biological processes: Top 15 enriched GO BP terms are showed in the bar plot of each disease state in each tissue. Each row represents a significant GO biological process which is colored according to the -log10(p.adjust).
ColorectumMSSGO analysis - Figure of enriched GO biological processes: Top 15 enriched GO BP terms are showed in the bar plot of each disease state in each tissue. Each row represents a significant GO biological process which is colored according to the -log10(p.adjust).
ColorectumMSI-HGO analysis - Figure of enriched GO biological processes: Top 15 enriched GO BP terms are showed in the bar plot of each disease state in each tissue. Each row represents a significant GO biological process which is colored according to the -log10(p.adjust).
ColorectumFAPGO analysis - Figure of enriched GO biological processes: Top 15 enriched GO BP terms are showed in the bar plot of each disease state in each tissue. Each row represents a significant GO biological process which is colored according to the -log10(p.adjust).
∗Top 15 enriched GO BP terms are showed in the bar plot of each disease state in each tissue. Each row represents a significant GO biological process which is colored according to the -log10(p.adjust).
Page: 1 2 3 4 5 6 7 8 9 

check button Enriched GO biological processes.
GO IDTissueDisease StageDescriptionGene RatioBg Ratiopvaluep.adjustCount
GO:003158919EsophagusESCCcell-substrate adhesion221/8552363/187233.06e-096.62e-08221
GO:003444620EsophagusESCCsubstrate adhesion-dependent cell spreading65/8552108/187231.67e-037.72e-0365
GO:00380615EsophagusESCCNIK/NF-kappaB signaling81/8552143/187235.33e-032.00e-0281
GO:003158912LiverCirrhoticcell-substrate adhesion128/4634363/187234.10e-066.90e-05128
GO:003444612LiverCirrhoticsubstrate adhesion-dependent cell spreading47/4634108/187231.48e-052.05e-0447
GO:1901222LiverCirrhoticregulation of NIK/NF-kappaB signaling46/4634112/187231.03e-041.06e-0346
GO:0038061LiverCirrhoticNIK/NF-kappaB signaling54/4634143/187233.64e-043.07e-0354
GO:003444622LiverHCCsubstrate adhesion-dependent cell spreading67/7958108/187233.24e-053.28e-0467
GO:003158922LiverHCCcell-substrate adhesion188/7958363/187232.00e-041.55e-03188
GO:00380611LiverHCCNIK/NF-kappaB signaling77/7958143/187233.98e-031.76e-0277
GO:19012221LiverHCCregulation of NIK/NF-kappaB signaling60/7958112/187231.17e-024.28e-0260
GO:003158917Oral cavityOSCCcell-substrate adhesion193/7305363/187232.48e-084.82e-07193
GO:00380614Oral cavityOSCCNIK/NF-kappaB signaling78/7305143/187231.14e-048.35e-0478
GO:003444618Oral cavityOSCCsubstrate adhesion-dependent cell spreading59/7305108/187237.01e-043.89e-0359
GO:19012224Oral cavityOSCCregulation of NIK/NF-kappaB signaling59/7305112/187232.25e-031.00e-0259
GO:190122212Oral cavityLPregulation of NIK/NF-kappaB signaling44/4623112/187234.38e-044.19e-0344
GO:003806112Oral cavityLPNIK/NF-kappaB signaling52/4623143/187231.20e-039.66e-0352
GO:003158918Oral cavityLPcell-substrate adhesion111/4623363/187235.94e-033.53e-02111
GO:003444619Oral cavityLPsubstrate adhesion-dependent cell spreading38/4623108/187239.38e-034.99e-0238
GO:003158926SkincSCCcell-substrate adhesion130/4864363/187231.87e-052.23e-04130
Page: 1 2 

check button Enriched KEGG pathways.
Pathway IDTissueDisease StageDescriptionGene RatioBg Ratiopvaluep.adjustqvalueCount
Page: 1 

Top

Cell-cell communication analysis

check buttonIdentification of potential cell-cell interactions between two cell types and their ligand-receptor pairs for different disease states
LigandReceptorLRpairPathwayTissueDisease Stage
Page: 1 

Top

Single-cell gene regulatory network inference analysis

check buttonFind out the significant the regulons (TFs) and the target genes of each regulon across cell types for different disease states
TFCell TypeTissueDisease StageTarget GeneRSSRegulon Activity
∗The dot plots of a searched regulon are shown for all cell subpopulations in each disease state of each tissue based on the regulon specific score inferred using pySCENIC and by calculating the average expression.
Page: 1 

Top

Somatic mutation of malignant transformation related genes

check buttonAnnotation of somatic variants for genes involved in malignant transformation
Hugo SymbolVariant ClassVariant ClassificationdbSNP RSHGVScHGVSpHGVSp ShortSWISSPROTBIOTYPESIFTPolyPhenTumor Sample BarcodeTissueHistologySexAgeStageTherapy TypesDrugsOutcome
AKIP1SNVMissense_Mutationnovelc.17N>Tp.Ala6Valp.A6VQ9NQ31protein_codingtolerated_low_confidence(0.37)benign(0.035)TCGA-MA-AA3X-01Cervixcervical & endocervical cancerFemale<65III/IVChemotherapycisplatinCR
AKIP1SNVMissense_Mutationc.224N>Cp.Arg75Thrp.R75TQ9NQ31protein_codingtolerated(0.06)possibly_damaging(0.836)TCGA-Q1-A6DT-01Cervixcervical & endocervical cancerFemale<65I/IIUnknownUnknownPD
AKIP1SNVMissense_Mutationc.260N>Cp.Arg87Thrp.R87TQ9NQ31protein_codingtolerated(0.08)possibly_damaging(0.836)TCGA-Q1-A73O-01Cervixcervical & endocervical cancerFemale<65I/IIChemotherapycisplatinCR
AKIP1SNVMissense_Mutationc.554N>Tp.Gly185Valp.G185VQ9NQ31protein_codingdeleterious(0.01)probably_damaging(0.938)TCGA-AZ-6598-01Colorectumcolon adenocarcinomaFemale>=65I/IIUnknownUnknownSD
AKIP1SNVMissense_Mutationnovelc.340N>Gp.Thr114Alap.T114AQ9NQ31protein_codingtolerated(0.35)benign(0.003)TCGA-AG-A002-01Colorectumrectum adenocarcinomaMale<65I/IIUnknownUnknownSD
AKIP1SNVMissense_Mutationnovelc.10N>Gp.Cys4Glyp.C4GQ9NQ31protein_codingdeleterious_low_confidence(0)possibly_damaging(0.518)TCGA-A5-A2K5-01Endometriumuterine corpus endometrioid carcinomaFemale>=65I/IIUnknownUnknownSD
AKIP1SNVMissense_Mutationnovelc.133N>Ap.Pro45Thrp.P45TQ9NQ31protein_codingdeleterious(0.01)benign(0.307)TCGA-AJ-A3EK-01Endometriumuterine corpus endometrioid carcinomaFemale<65I/IIChemotherapycarboplatinCR
AKIP1SNVMissense_Mutationrs371516259c.276N>Ap.Phe92Leup.F92LQ9NQ31protein_codingdeleterious(0.04)benign(0.352)TCGA-EO-A3AV-01Endometriumuterine corpus endometrioid carcinomaFemale<65III/IVChemotherapycarboplatinCR
AKIP1SNVMissense_Mutationnovelc.539N>Cp.Tyr180Serp.Y180SQ9NQ31protein_codingdeleterious(0)probably_damaging(0.999)TCGA-DD-AACX-01Liverliver hepatocellular carcinomaMale>=65I/IIUnknownUnknownPD
AKIP1SNVMissense_Mutationnovelc.335G>Tp.Gly112Valp.G112VQ9NQ31protein_codingdeleterious(0.03)probably_damaging(1)TCGA-43-8118-01Lunglung squamous cell carcinomaFemale<65I/IIChemotherapydocetaxelSD
Page: 1 2 

Top

Related drugs of malignant transformation related genes

check buttonIdentification of chemicals and drugs interact with genes involved in malignant transfromation
(DGIdb 4.0)
Entrez IDSymbolCategoryInteraction TypesDrug Claim NameDrug NamePMIDs
Page: 1