| Tissue | Expression Dynamics | Abbreviation |
| Breast |  | IDC: Invasive ductal carcinoma |
| DCIS: Ductal carcinoma in situ |
| Precancer(BRCA1-mut): Precancerous lesion from BRCA1 mutation carriers |
| Cervix | 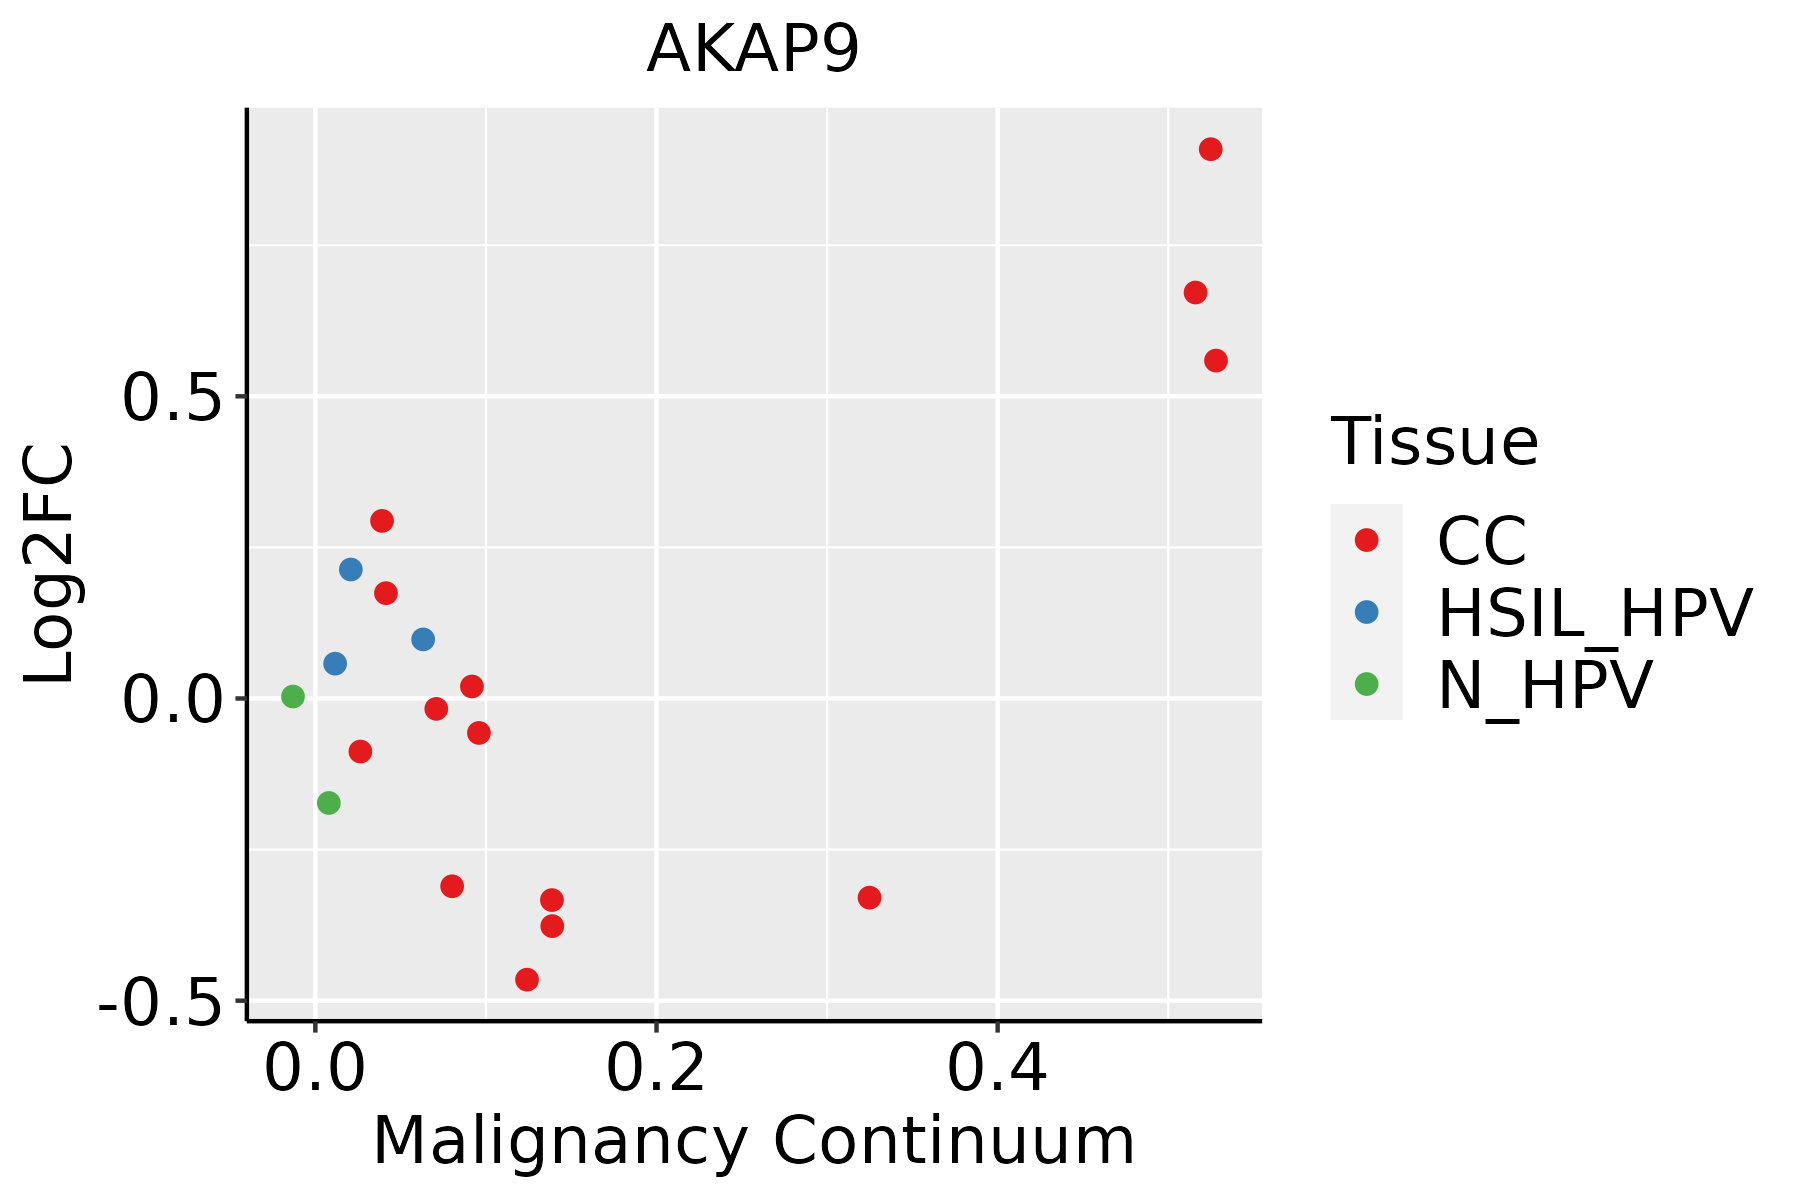 | CC: Cervix cancer |
| HSIL_HPV: HPV-infected high-grade squamous intraepithelial lesions |
| N_HPV: HPV-infected normal cervix |
| Colorectum (GSE201348) |  | FAP: Familial adenomatous polyposis |
| CRC: Colorectal cancer |
| Colorectum (HTA11) |  | AD: Adenomas |
| SER: Sessile serrated lesions |
| MSI-H: Microsatellite-high colorectal cancer |
| MSS: Microsatellite stable colorectal cancer |
| Endometrium | 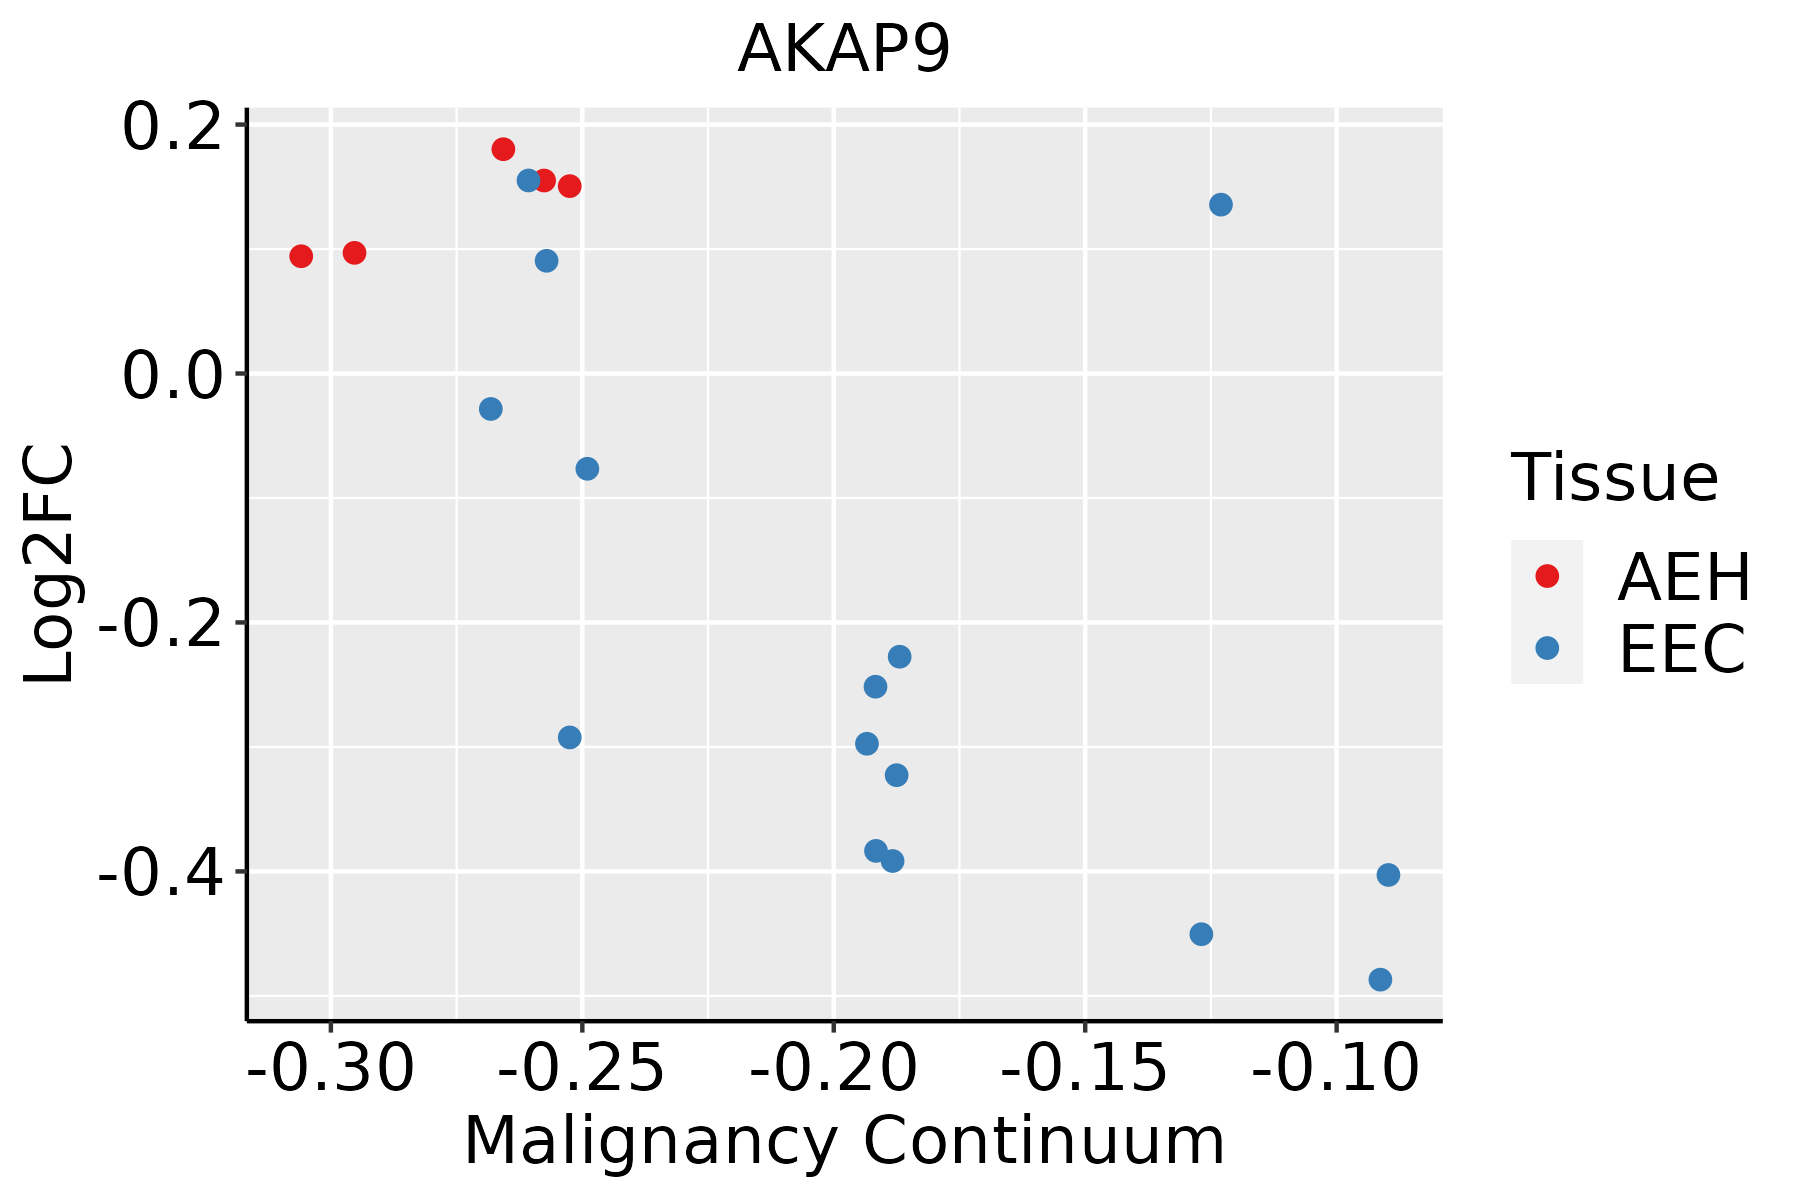 | AEH: Atypical endometrial hyperplasia |
| EEC: Endometrioid Cancer |
| Esophagus | 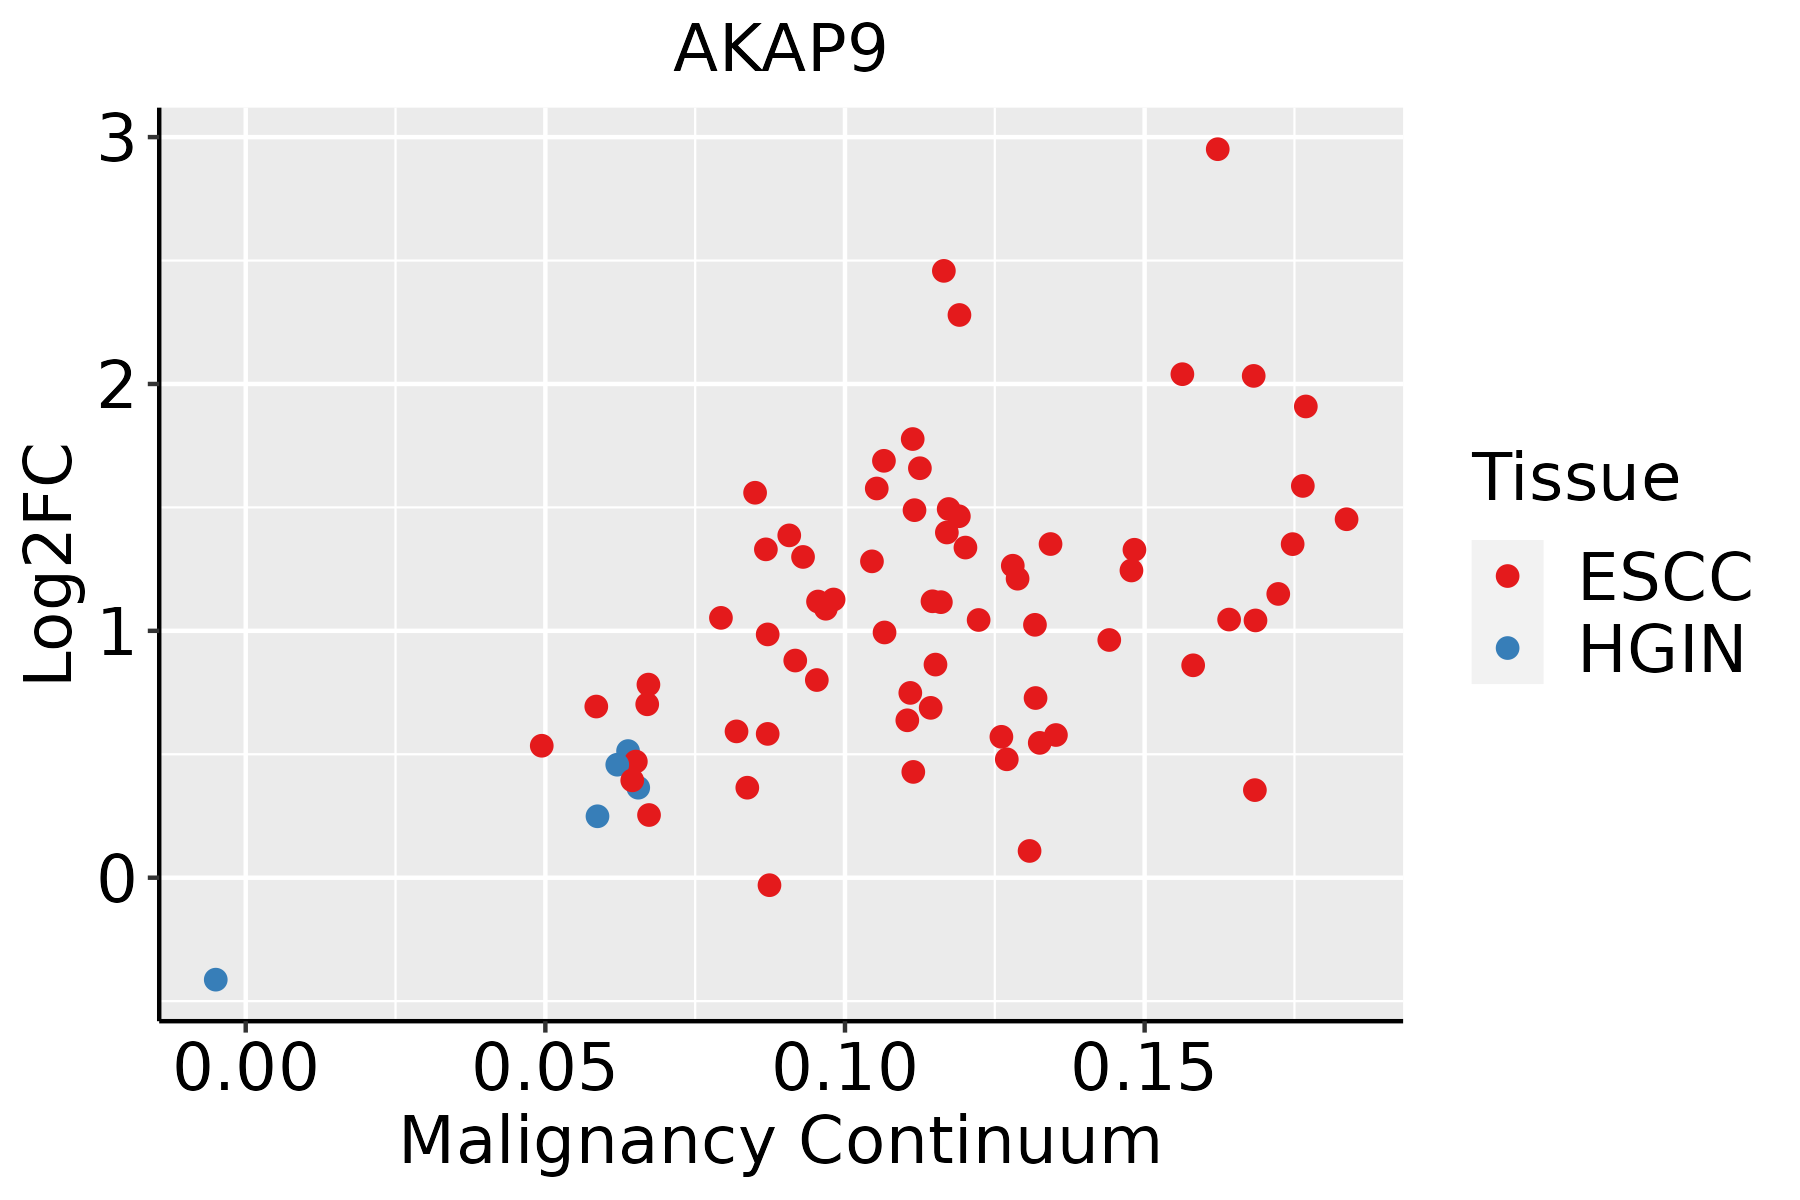 | ESCC: Esophageal squamous cell carcinoma |
| HGIN: High-grade intraepithelial neoplasias |
| LGIN: Low-grade intraepithelial neoplasias |
| GC |  | CAG: Chronic atrophic gastritis |
| CAG with IM: Chronic atrophic gastritis with intestinal metaplasia |
| CSG: Chronic superficial gastritis |
| GC: Gastric cancer |
| SIM: Severe intestinal metaplasia |
| WIM: Wild intestinal metaplasia |
| Liver | 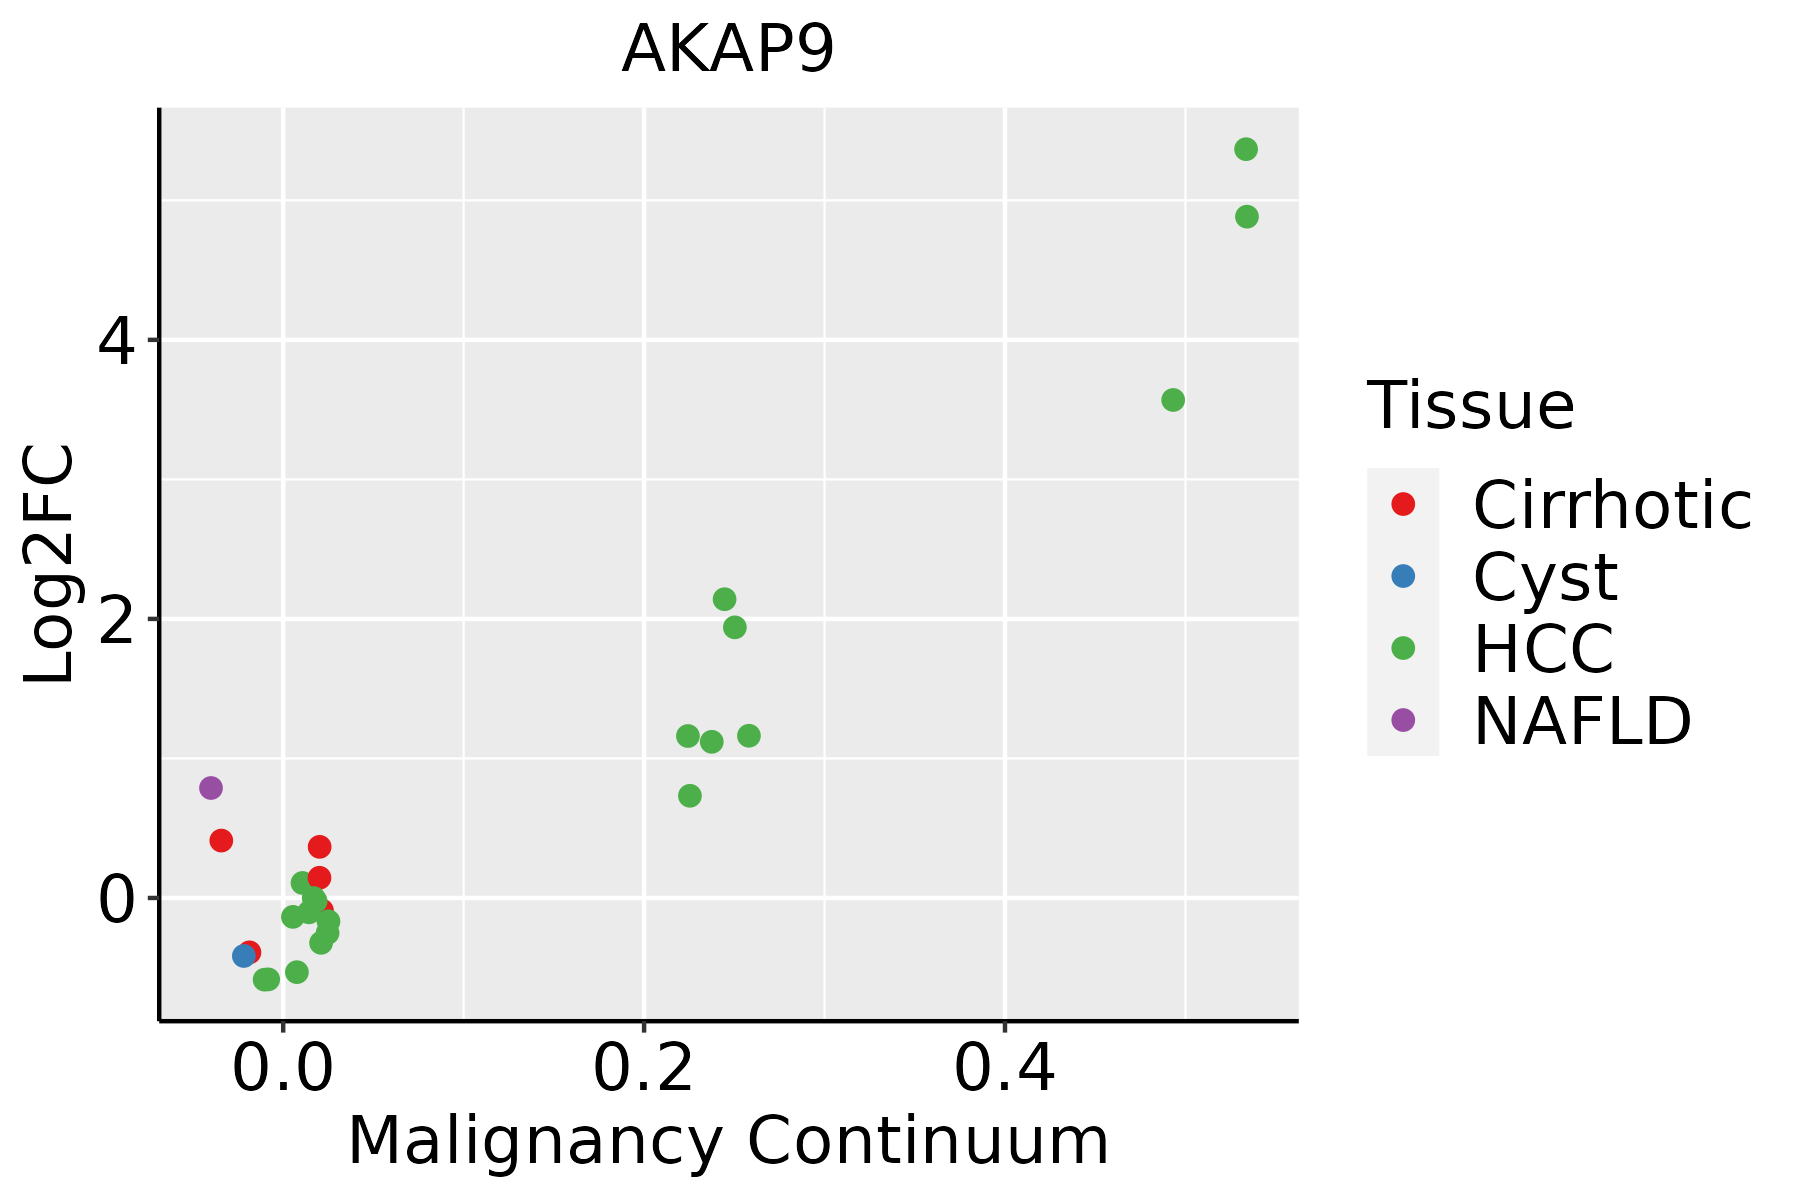 | HCC: Hepatocellular carcinoma |
| NAFLD: Non-alcoholic fatty liver disease |
| Lung |  | AAH: Atypical adenomatous hyperplasia |
| AIS: Adenocarcinoma in situ |
| IAC: Invasive lung adenocarcinoma |
| MIA: Minimally invasive adenocarcinoma |
| Oral Cavity | 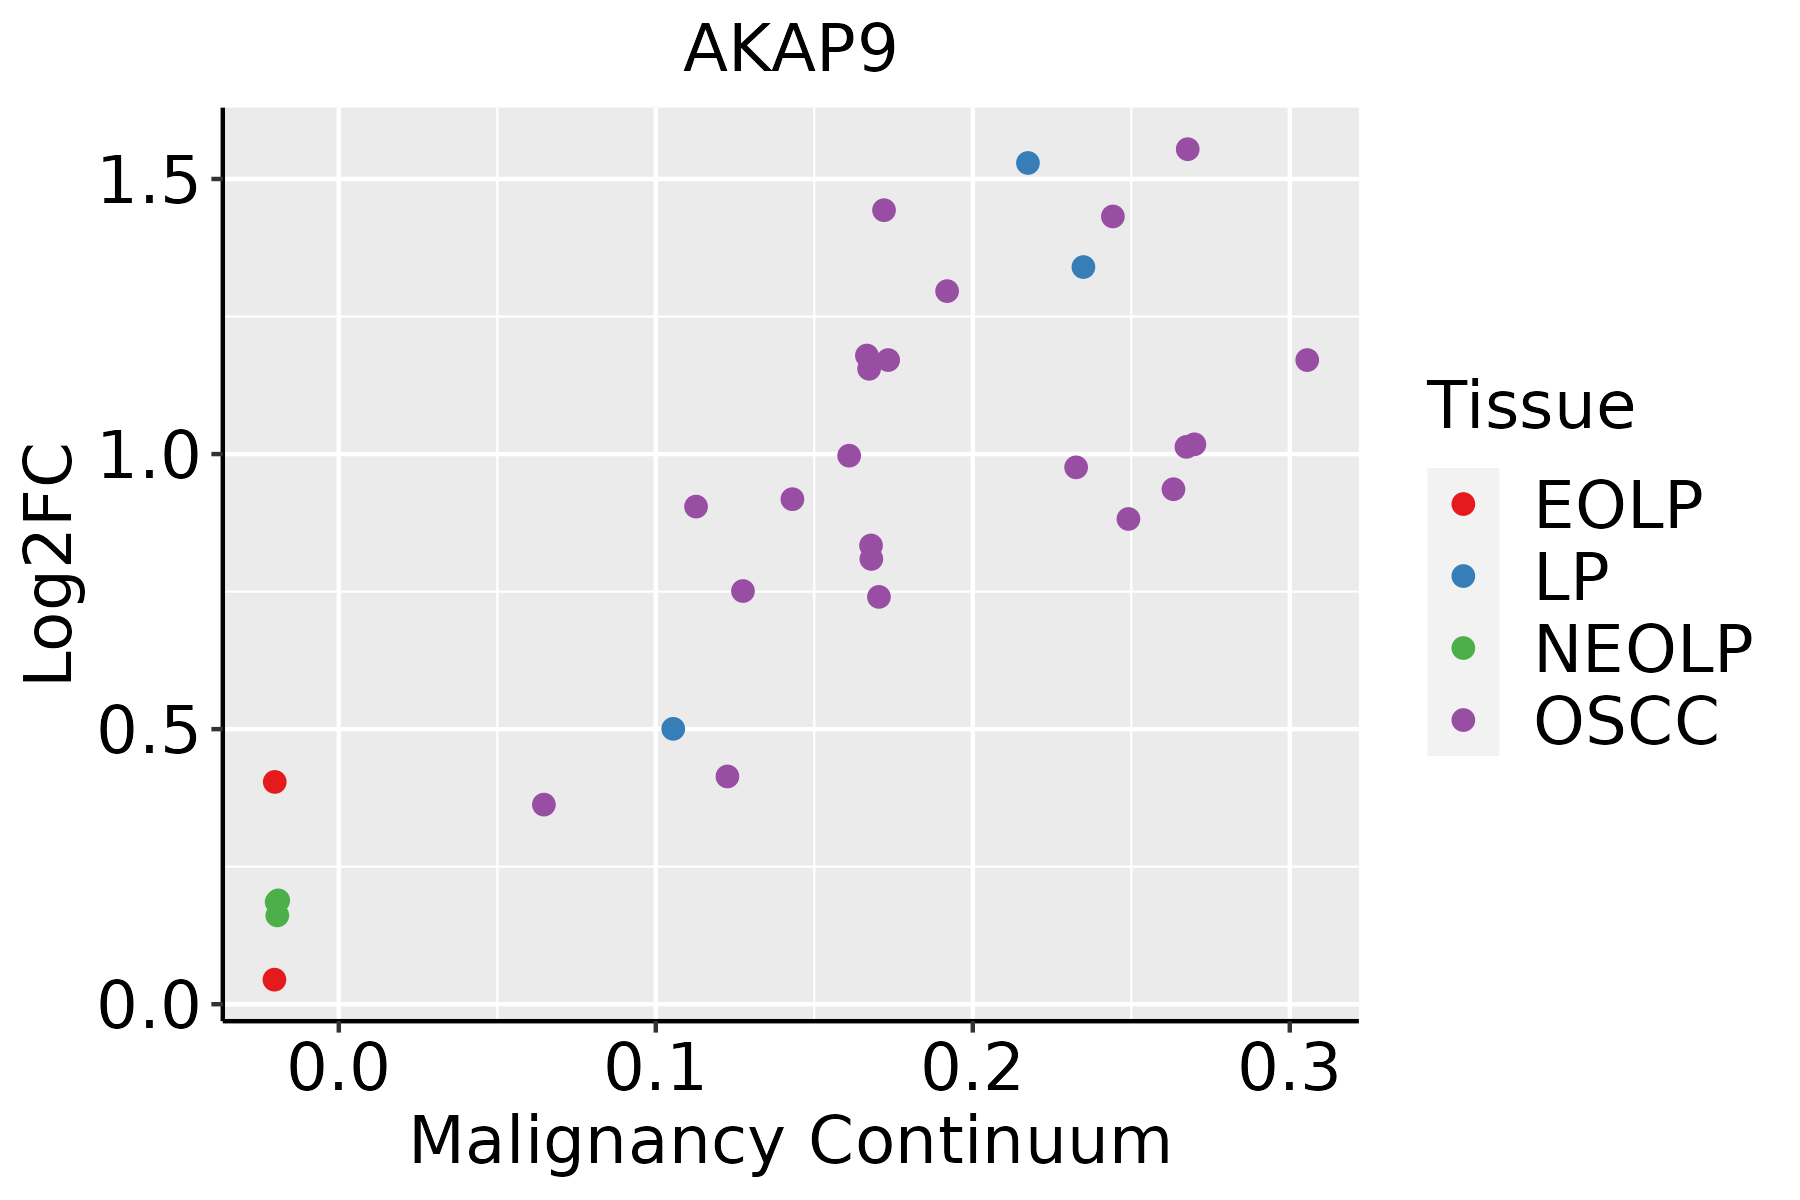 | EOLP: Erosive Oral lichen planus |
| LP: leukoplakia |
| NEOLP: Non-erosive oral lichen planus |
| OSCC: Oral squamous cell carcinoma |
| Prostate | 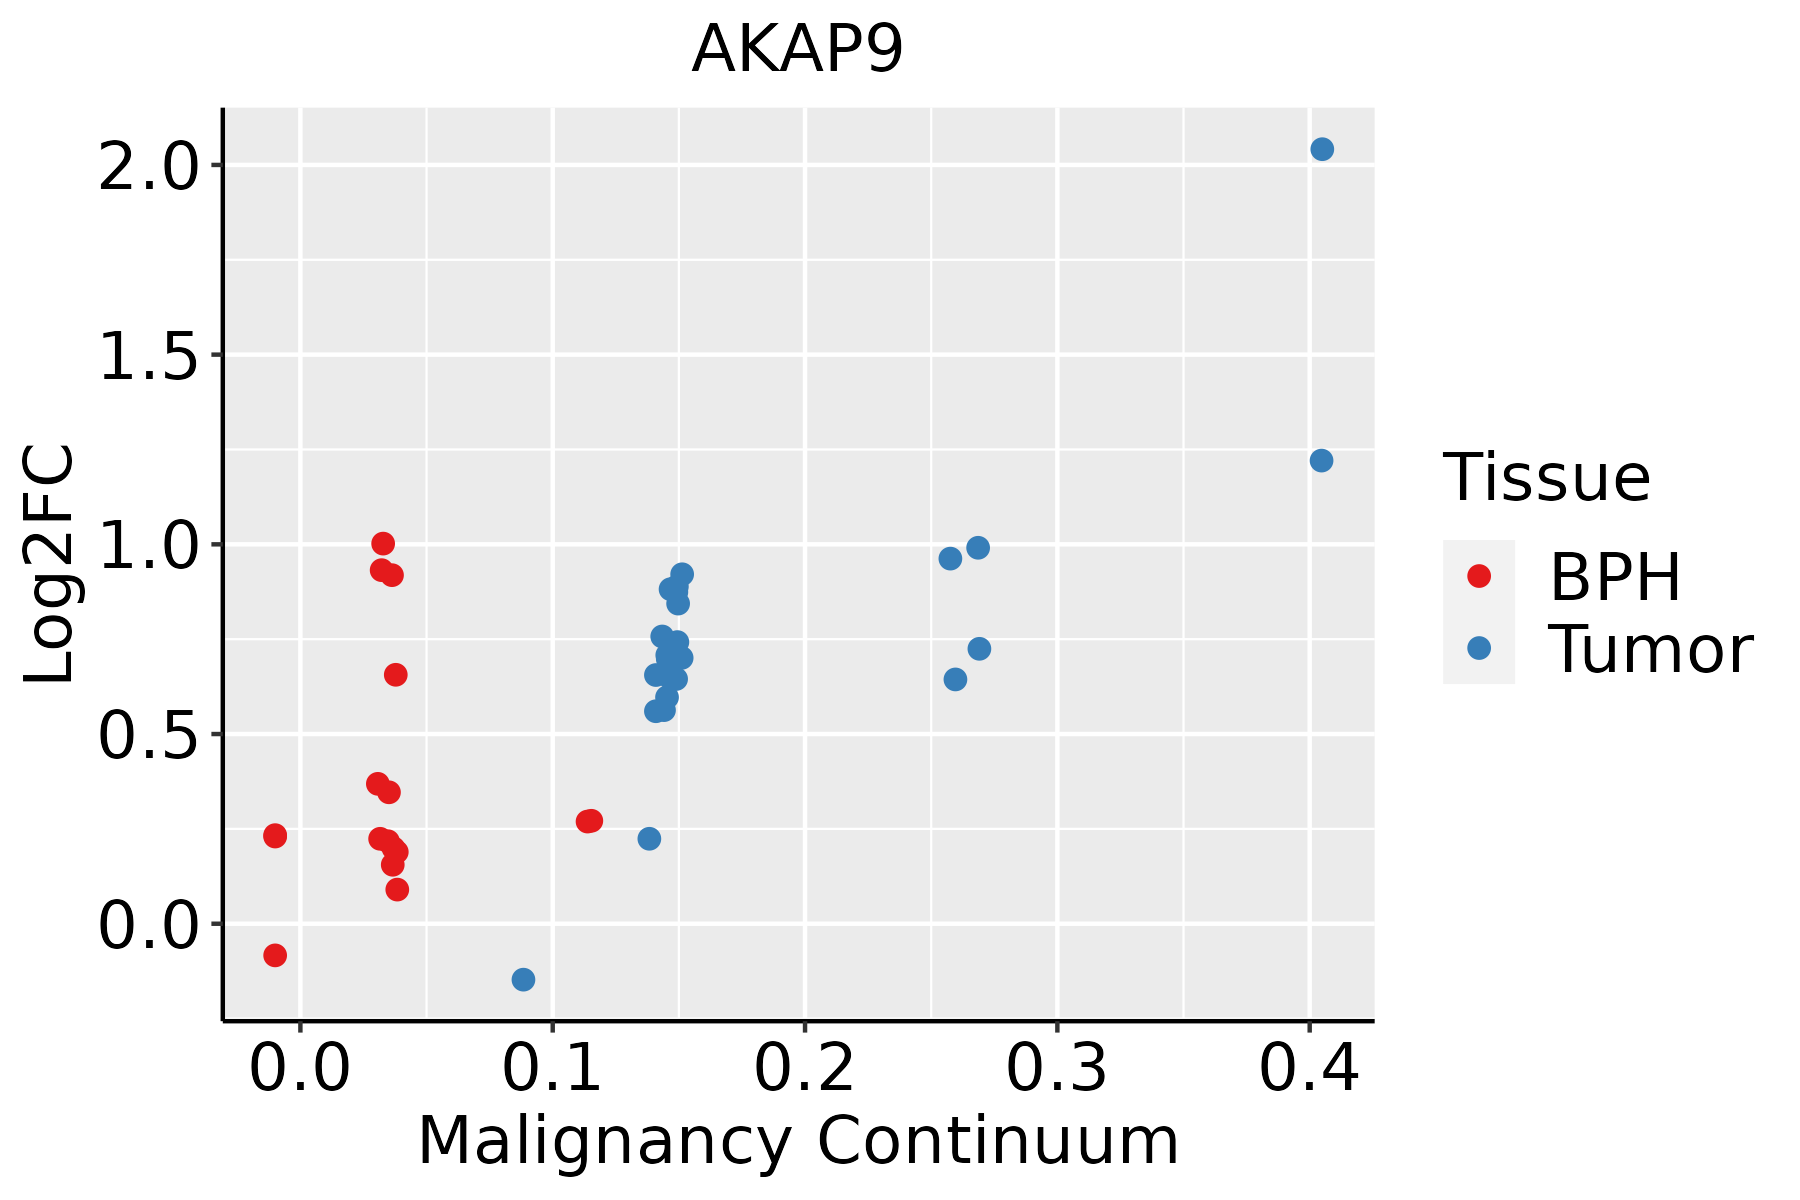 | BPH: Benign Prostatic Hyperplasia |
| Skin | 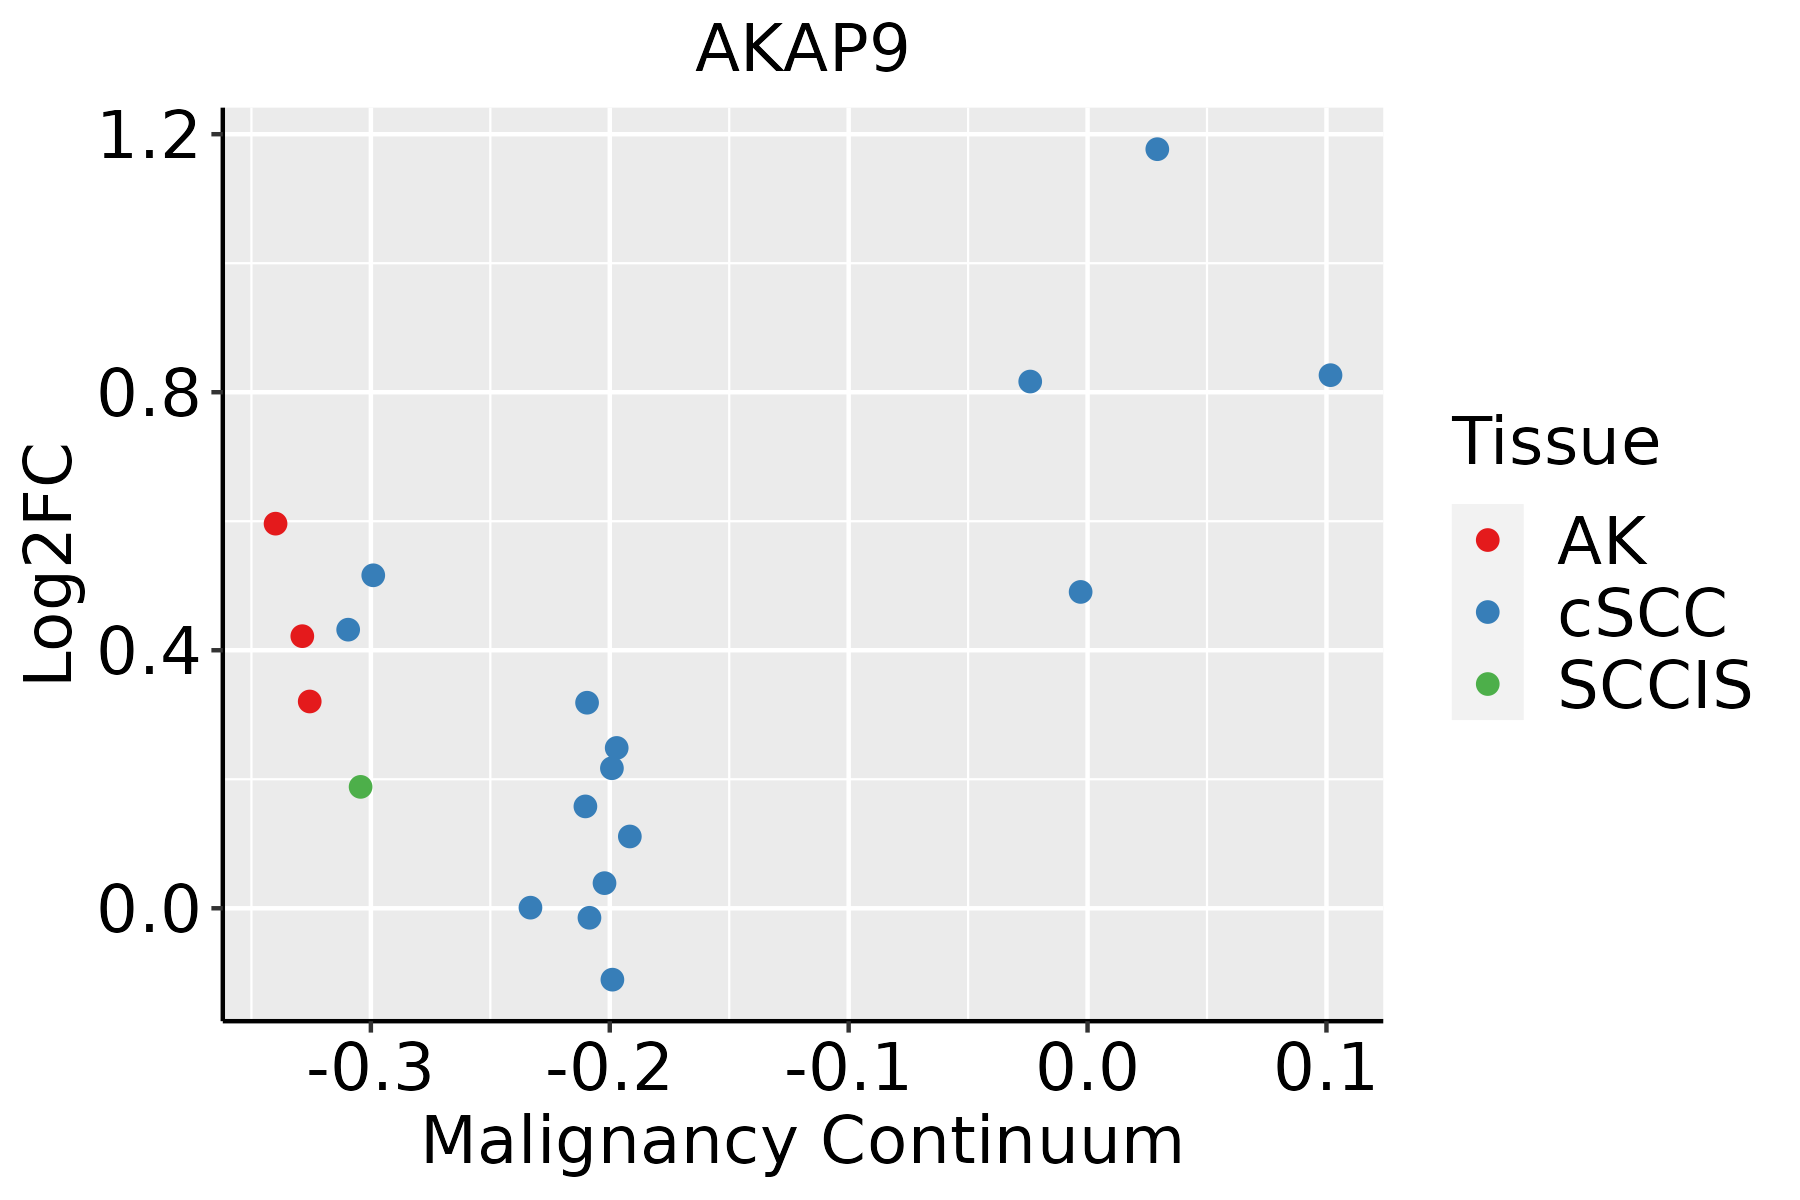 | AK: Actinic keratosis |
| cSCC: Cutaneous squamous cell carcinoma |
| SCCIS:squamous cell carcinoma in situ |
| Thyroid | 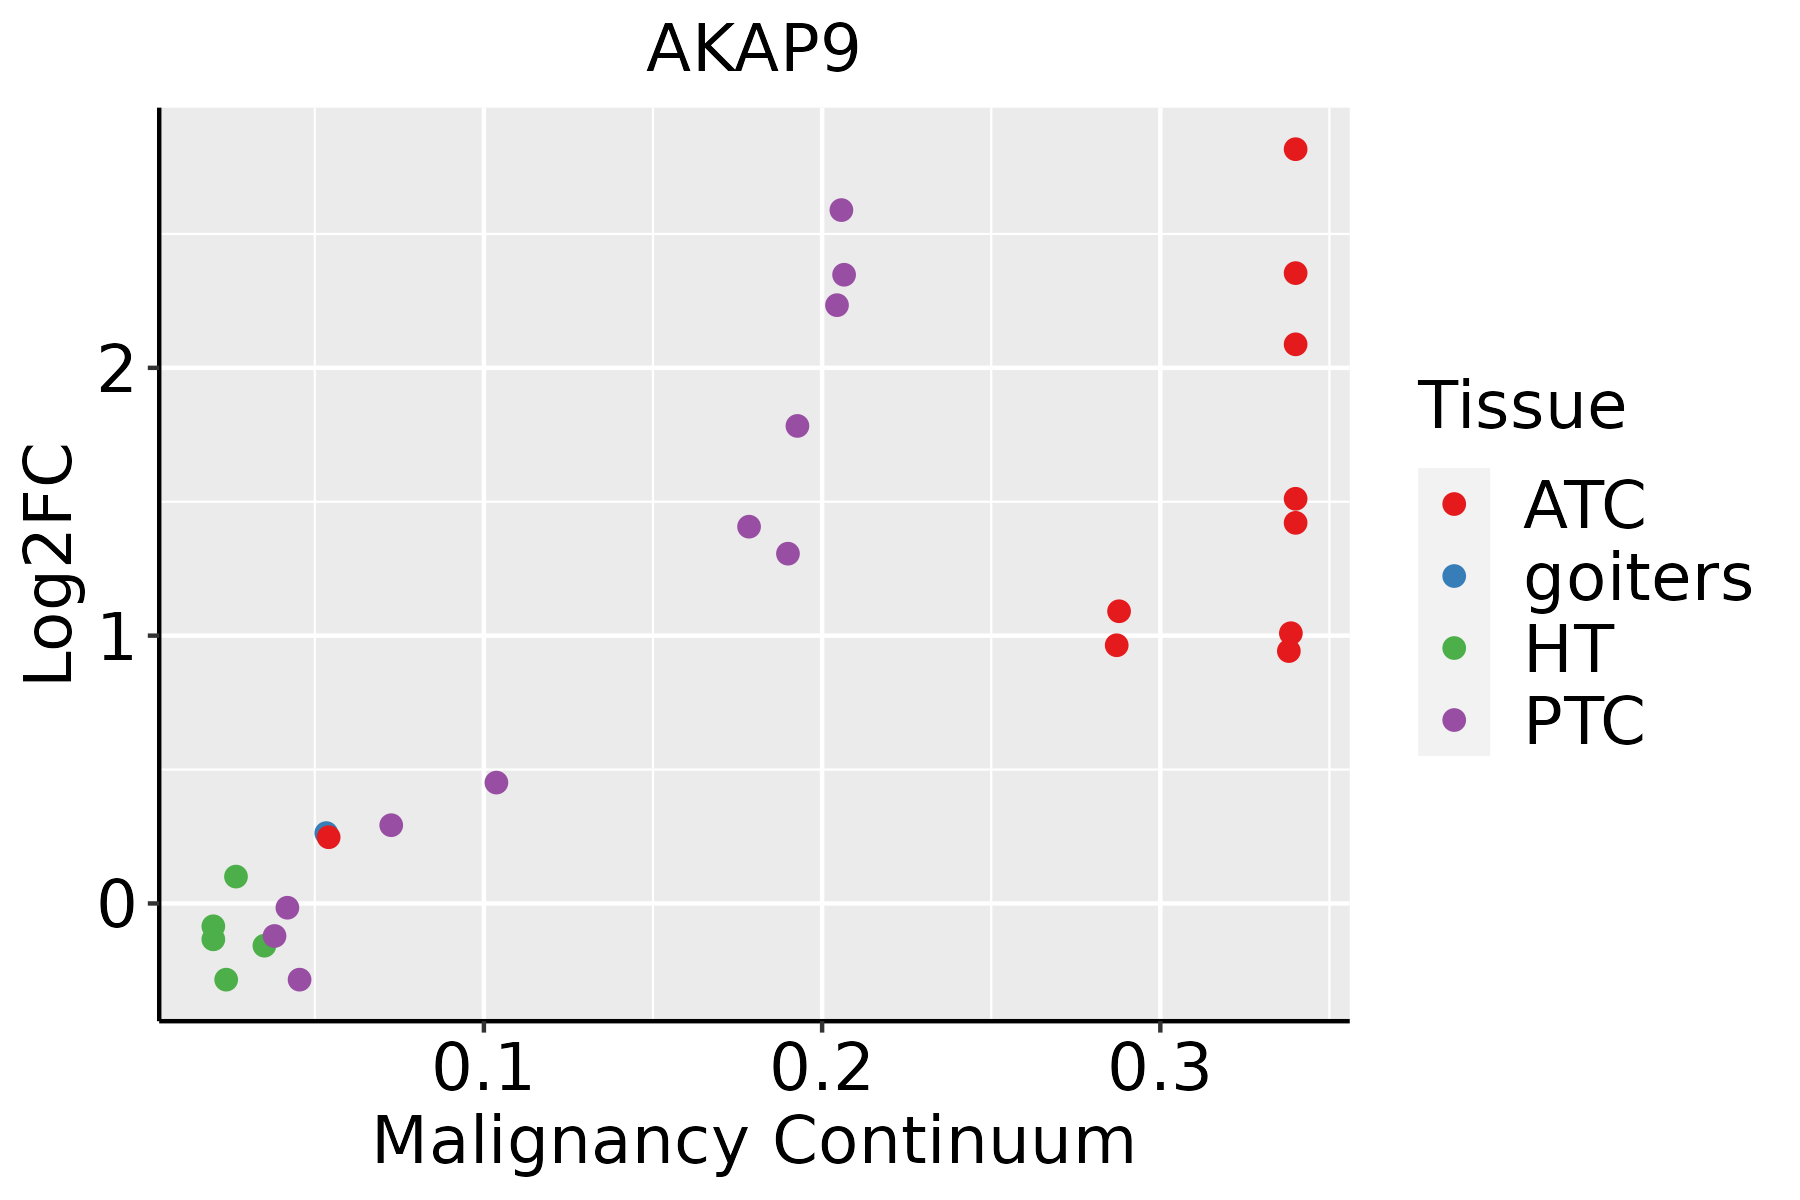 | ATC: Anaplastic thyroid cancer |
| HT: Hashimoto's thyroiditis |
| PTC: Papillary thyroid cancer |
| GO ID | Tissue | Disease Stage | Description | Gene Ratio | Bg Ratio | pvalue | p.adjust | Count |
| GO:190290514 | Breast | IDC | positive regulation of supramolecular fiber organization | 37/1434 | 209/18723 | 1.33e-06 | 5.75e-05 | 37 |
| GO:004325414 | Breast | IDC | regulation of protein-containing complex assembly | 61/1434 | 428/18723 | 1.77e-06 | 7.31e-05 | 61 |
| GO:003133414 | Breast | IDC | positive regulation of protein-containing complex assembly | 40/1434 | 237/18723 | 1.77e-06 | 7.31e-05 | 40 |
| GO:005165114 | Breast | IDC | maintenance of location in cell | 37/1434 | 214/18723 | 2.39e-06 | 9.35e-05 | 37 |
| GO:003297014 | Breast | IDC | regulation of actin filament-based process | 56/1434 | 397/18723 | 6.37e-06 | 1.99e-04 | 56 |
| GO:190290314 | Breast | IDC | regulation of supramolecular fiber organization | 54/1434 | 383/18723 | 9.40e-06 | 2.66e-04 | 54 |
| GO:005123513 | Breast | IDC | maintenance of location | 48/1434 | 327/18723 | 9.90e-06 | 2.77e-04 | 48 |
| GO:005159114 | Breast | IDC | response to cAMP | 20/1434 | 93/18723 | 2.00e-05 | 4.91e-04 | 20 |
| GO:003227314 | Breast | IDC | positive regulation of protein polymerization | 25/1434 | 138/18723 | 4.46e-05 | 1.01e-03 | 25 |
| GO:005149513 | Breast | IDC | positive regulation of cytoskeleton organization | 35/1434 | 226/18723 | 5.04e-05 | 1.09e-03 | 35 |
| GO:004668312 | Breast | IDC | response to organophosphorus | 24/1434 | 131/18723 | 5.22e-05 | 1.12e-03 | 24 |
| GO:001095913 | Breast | IDC | regulation of metal ion transport | 52/1434 | 406/18723 | 1.76e-04 | 2.97e-03 | 52 |
| GO:001407412 | Breast | IDC | response to purine-containing compound | 24/1434 | 148/18723 | 3.65e-04 | 5.23e-03 | 24 |
| GO:003241111 | Breast | IDC | positive regulation of transporter activity | 20/1434 | 120/18723 | 7.64e-04 | 9.27e-03 | 20 |
| GO:00322719 | Breast | IDC | regulation of protein polymerization | 32/1434 | 233/18723 | 9.19e-04 | 1.05e-02 | 32 |
| GO:00432703 | Breast | IDC | positive regulation of ion transport | 36/1434 | 275/18723 | 1.11e-03 | 1.22e-02 | 36 |
| GO:00512589 | Breast | IDC | protein polymerization | 38/1434 | 297/18723 | 1.26e-03 | 1.34e-02 | 38 |
| GO:002289812 | Breast | IDC | regulation of transmembrane transporter activity | 36/1434 | 278/18723 | 1.35e-03 | 1.40e-02 | 36 |
| GO:003241411 | Breast | IDC | positive regulation of ion transmembrane transporter activity | 18/1434 | 109/18723 | 1.53e-03 | 1.53e-02 | 18 |
| GO:003476711 | Breast | IDC | positive regulation of ion transmembrane transport | 24/1434 | 167/18723 | 2.07e-03 | 1.95e-02 | 24 |
| Hugo Symbol | Variant Class | Variant Classification | dbSNP RS | HGVSc | HGVSp | HGVSp Short | SWISSPROT | BIOTYPE | SIFT | PolyPhen | Tumor Sample Barcode | Tissue | Histology | Sex | Age | Stage | Therapy Types | Drugs | Outcome |
| AKAP9 | SNV | Missense_Mutation | | c.5677N>G | p.Leu1893Val | p.L1893V | Q99996 | protein_coding | tolerated(0.08) | benign(0.162) | TCGA-A2-A04P-01 | Breast | breast invasive carcinoma | Female | <65 | III/IV | Chemotherapy | taxol | PD |
| AKAP9 | SNV | Missense_Mutation | | c.5825N>T | p.Thr1942Ile | p.T1942I | Q99996 | protein_coding | tolerated(0.3) | benign(0) | TCGA-A2-A0EY-01 | Breast | breast invasive carcinoma | Female | <65 | I/II | Chemotherapy | adriamycin | SD |
| AKAP9 | SNV | Missense_Mutation | | c.10727N>A | p.Ser3576Tyr | p.S3576Y | Q99996 | protein_coding | tolerated(0.56) | benign(0.007) | TCGA-A2-A0YM-01 | Breast | breast invasive carcinoma | Female | >=65 | I/II | Unknown | Unknown | SD |
| AKAP9 | SNV | Missense_Mutation | novel | c.9220G>C | p.Glu3074Gln | p.E3074Q | Q99996 | protein_coding | tolerated(0.55) | benign(0.067) | TCGA-A7-A5ZW-01 | Breast | breast invasive carcinoma | Female | <65 | I/II | Chemotherapy | cyclophosphamide | CR |
| AKAP9 | SNV | Missense_Mutation | | c.938A>T | p.Asp313Val | p.D313V | Q99996 | protein_coding | tolerated(0.07) | benign(0.154) | TCGA-A8-A06T-01 | Breast | breast invasive carcinoma | Female | >=65 | III/IV | Hormone Therapy | anastrozole | SD |
| AKAP9 | SNV | Missense_Mutation | | c.3185N>A | p.Gly1062Glu | p.G1062E | Q99996 | protein_coding | tolerated(0.85) | benign(0) | TCGA-A8-A092-01 | Breast | breast invasive carcinoma | Female | <65 | III/IV | Chemotherapy | paclitaxel | CR |
| AKAP9 | SNV | Missense_Mutation | | c.7369N>A | p.His2457Asn | p.H2457N | Q99996 | protein_coding | tolerated(0.31) | benign(0) | TCGA-A8-A0A7-01 | Breast | breast invasive carcinoma | Female | <65 | I/II | Unknown | Unknown | SD |
| AKAP9 | SNV | Missense_Mutation | | c.5839N>T | p.Arg1947Cys | p.R1947C | Q99996 | protein_coding | deleterious(0) | probably_damaging(0.951) | TCGA-AC-A23H-01 | Breast | breast invasive carcinoma | Female | >=65 | I/II | Unknown | Unknown | PD |
| AKAP9 | SNV | Missense_Mutation | rs745335257 | c.11617N>A | p.Asp3873Asn | p.D3873N | Q99996 | protein_coding | deleterious(0) | probably_damaging(0.961) | TCGA-AC-A23H-01 | Breast | breast invasive carcinoma | Female | >=65 | I/II | Unknown | Unknown | PD |
| AKAP9 | SNV | Missense_Mutation | novel | c.4243N>A | p.Glu1415Lys | p.E1415K | Q99996 | protein_coding | tolerated(0.17) | benign(0.061) | TCGA-AC-A3BB-01 | Breast | breast invasive carcinoma | Female | <65 | III/IV | Chemotherapy | cytoxan | CR |


