
|
|||||
|
 | |
| |
| |
| |
| |
| |
|
Gene: AKAP8L |
Gene summary for AKAP8L |
| Gene information | Species | Human | Gene symbol | AKAP8L | Gene ID | 26993 |
| Gene name | A-kinase anchoring protein 8 like | |
| Gene Alias | HA95 | |
| Cytomap | 19p13.12 | |
| Gene Type | protein-coding | GO ID | GO:0000070 | UniProtAcc | Q9ULX6 |
Top |
Malignant transformation analysis |
| Identification of the aberrant gene expression in precancerous and cancerous lesions by comparing the gene expression of stem-like cells in diseased tissues with normal stem cells |
| Entrez ID | Symbol | Replicates | Species | Organ | Tissue | Adj P-value | Log2FC | Malignancy |
| 26993 | AKAP8L | LZE4T | Human | Esophagus | ESCC | 4.33e-11 | 2.64e-01 | 0.0811 |
| 26993 | AKAP8L | LZE5T | Human | Esophagus | ESCC | 9.99e-04 | 2.35e-01 | 0.0514 |
| 26993 | AKAP8L | LZE7T | Human | Esophagus | ESCC | 1.34e-08 | 4.32e-01 | 0.0667 |
| 26993 | AKAP8L | LZE20T | Human | Esophagus | ESCC | 1.37e-07 | 1.20e-01 | 0.0662 |
| 26993 | AKAP8L | LZE22T | Human | Esophagus | ESCC | 2.66e-11 | 3.96e-01 | 0.068 |
| 26993 | AKAP8L | LZE24T | Human | Esophagus | ESCC | 4.54e-12 | 2.79e-01 | 0.0596 |
| 26993 | AKAP8L | P1T-E | Human | Esophagus | ESCC | 3.36e-12 | 4.19e-01 | 0.0875 |
| 26993 | AKAP8L | P2T-E | Human | Esophagus | ESCC | 9.83e-28 | 4.37e-01 | 0.1177 |
| 26993 | AKAP8L | P4T-E | Human | Esophagus | ESCC | 3.75e-26 | 6.09e-01 | 0.1323 |
| 26993 | AKAP8L | P5T-E | Human | Esophagus | ESCC | 1.01e-20 | 3.99e-01 | 0.1327 |
| 26993 | AKAP8L | P8T-E | Human | Esophagus | ESCC | 2.17e-36 | 6.01e-01 | 0.0889 |
| 26993 | AKAP8L | P9T-E | Human | Esophagus | ESCC | 3.38e-17 | 2.52e-01 | 0.1131 |
| 26993 | AKAP8L | P10T-E | Human | Esophagus | ESCC | 2.21e-29 | 4.90e-01 | 0.116 |
| 26993 | AKAP8L | P11T-E | Human | Esophagus | ESCC | 4.20e-14 | 5.29e-01 | 0.1426 |
| 26993 | AKAP8L | P12T-E | Human | Esophagus | ESCC | 2.67e-26 | 5.10e-01 | 0.1122 |
| 26993 | AKAP8L | P15T-E | Human | Esophagus | ESCC | 4.56e-19 | 4.22e-01 | 0.1149 |
| 26993 | AKAP8L | P16T-E | Human | Esophagus | ESCC | 1.89e-13 | 2.61e-01 | 0.1153 |
| 26993 | AKAP8L | P17T-E | Human | Esophagus | ESCC | 2.03e-03 | 1.62e-01 | 0.1278 |
| 26993 | AKAP8L | P19T-E | Human | Esophagus | ESCC | 8.24e-06 | 3.01e-01 | 0.1662 |
| 26993 | AKAP8L | P20T-E | Human | Esophagus | ESCC | 2.58e-11 | 3.51e-01 | 0.1124 |
| Page: 1 2 3 4 5 6 |
| Tissue | Expression Dynamics | Abbreviation |
| Esophagus | 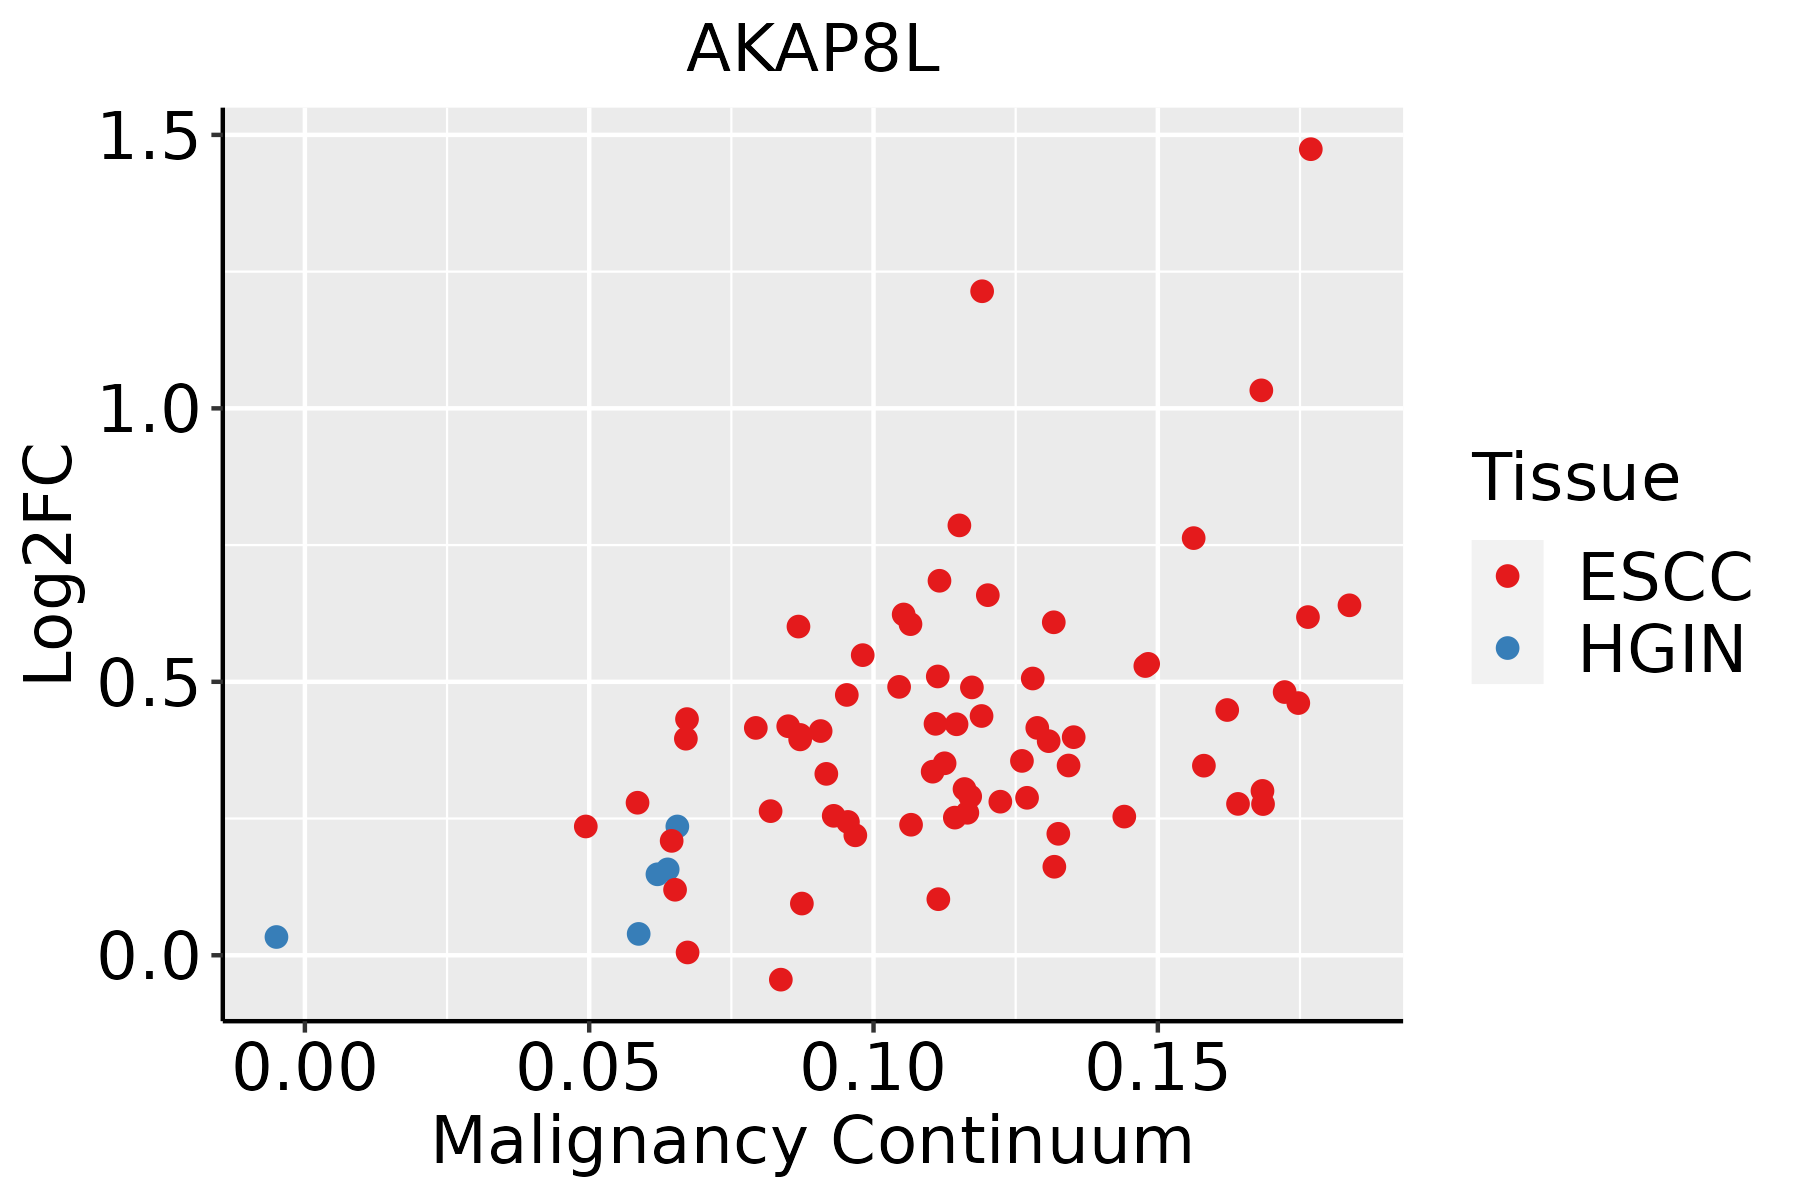 | ESCC: Esophageal squamous cell carcinoma |
| HGIN: High-grade intraepithelial neoplasias | ||
| LGIN: Low-grade intraepithelial neoplasias | ||
| Liver | 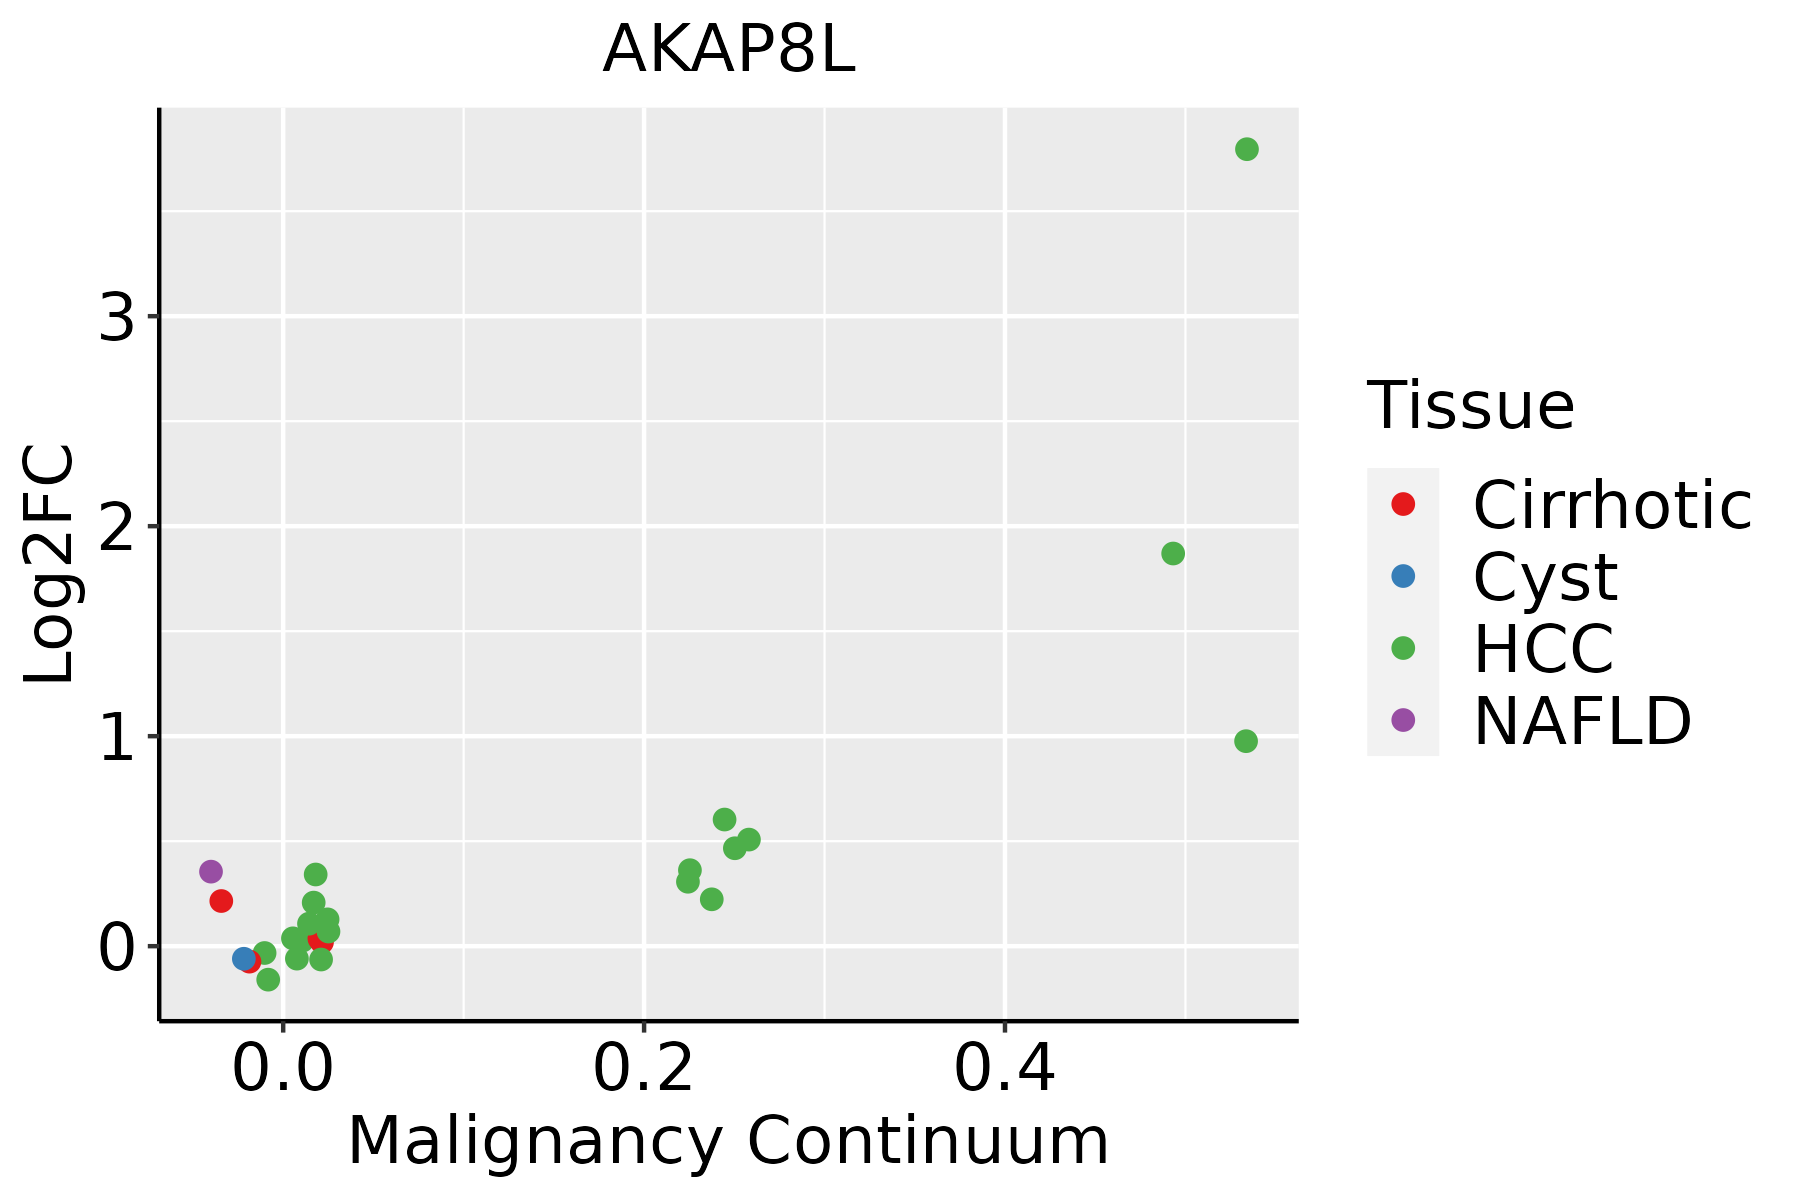 | HCC: Hepatocellular carcinoma |
| NAFLD: Non-alcoholic fatty liver disease | ||
| Lung | 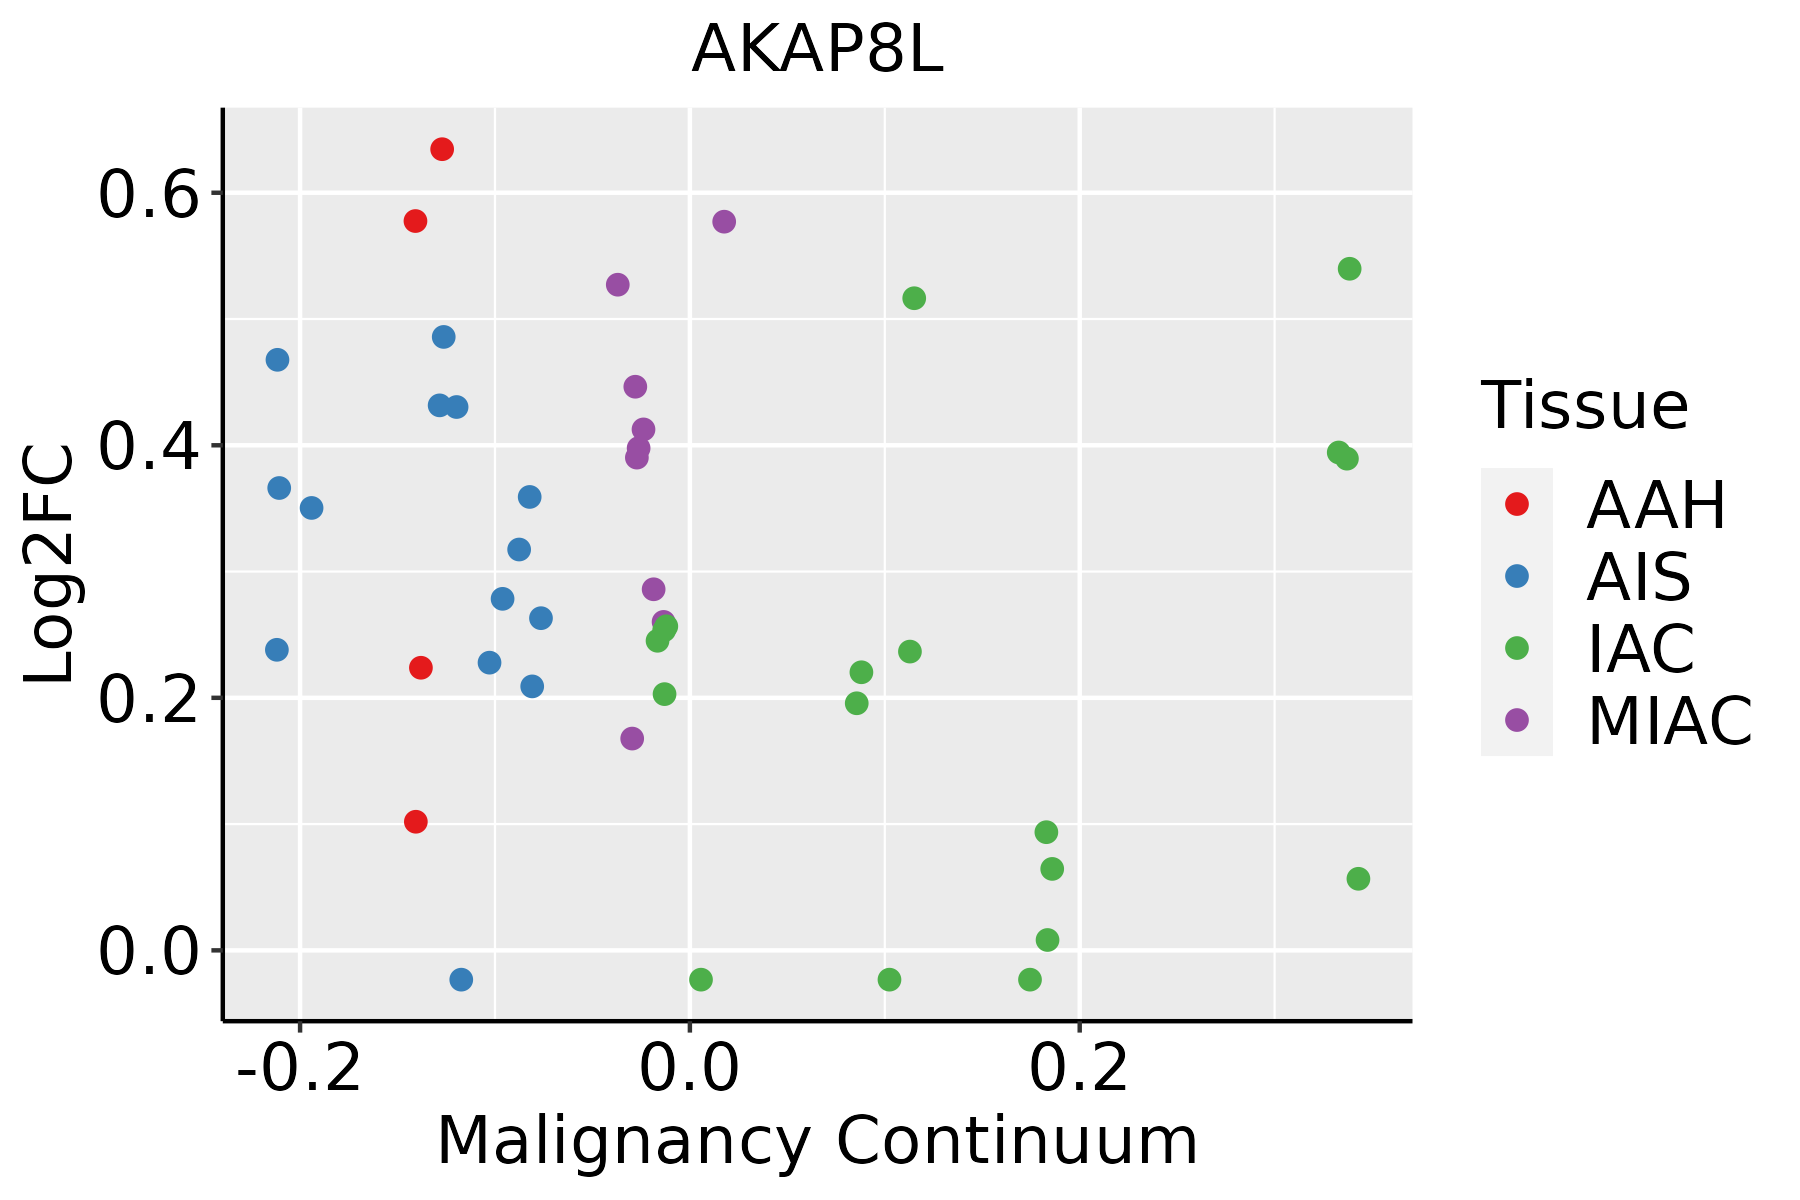 | AAH: Atypical adenomatous hyperplasia |
| AIS: Adenocarcinoma in situ | ||
| IAC: Invasive lung adenocarcinoma | ||
| MIA: Minimally invasive adenocarcinoma | ||
| Oral Cavity | 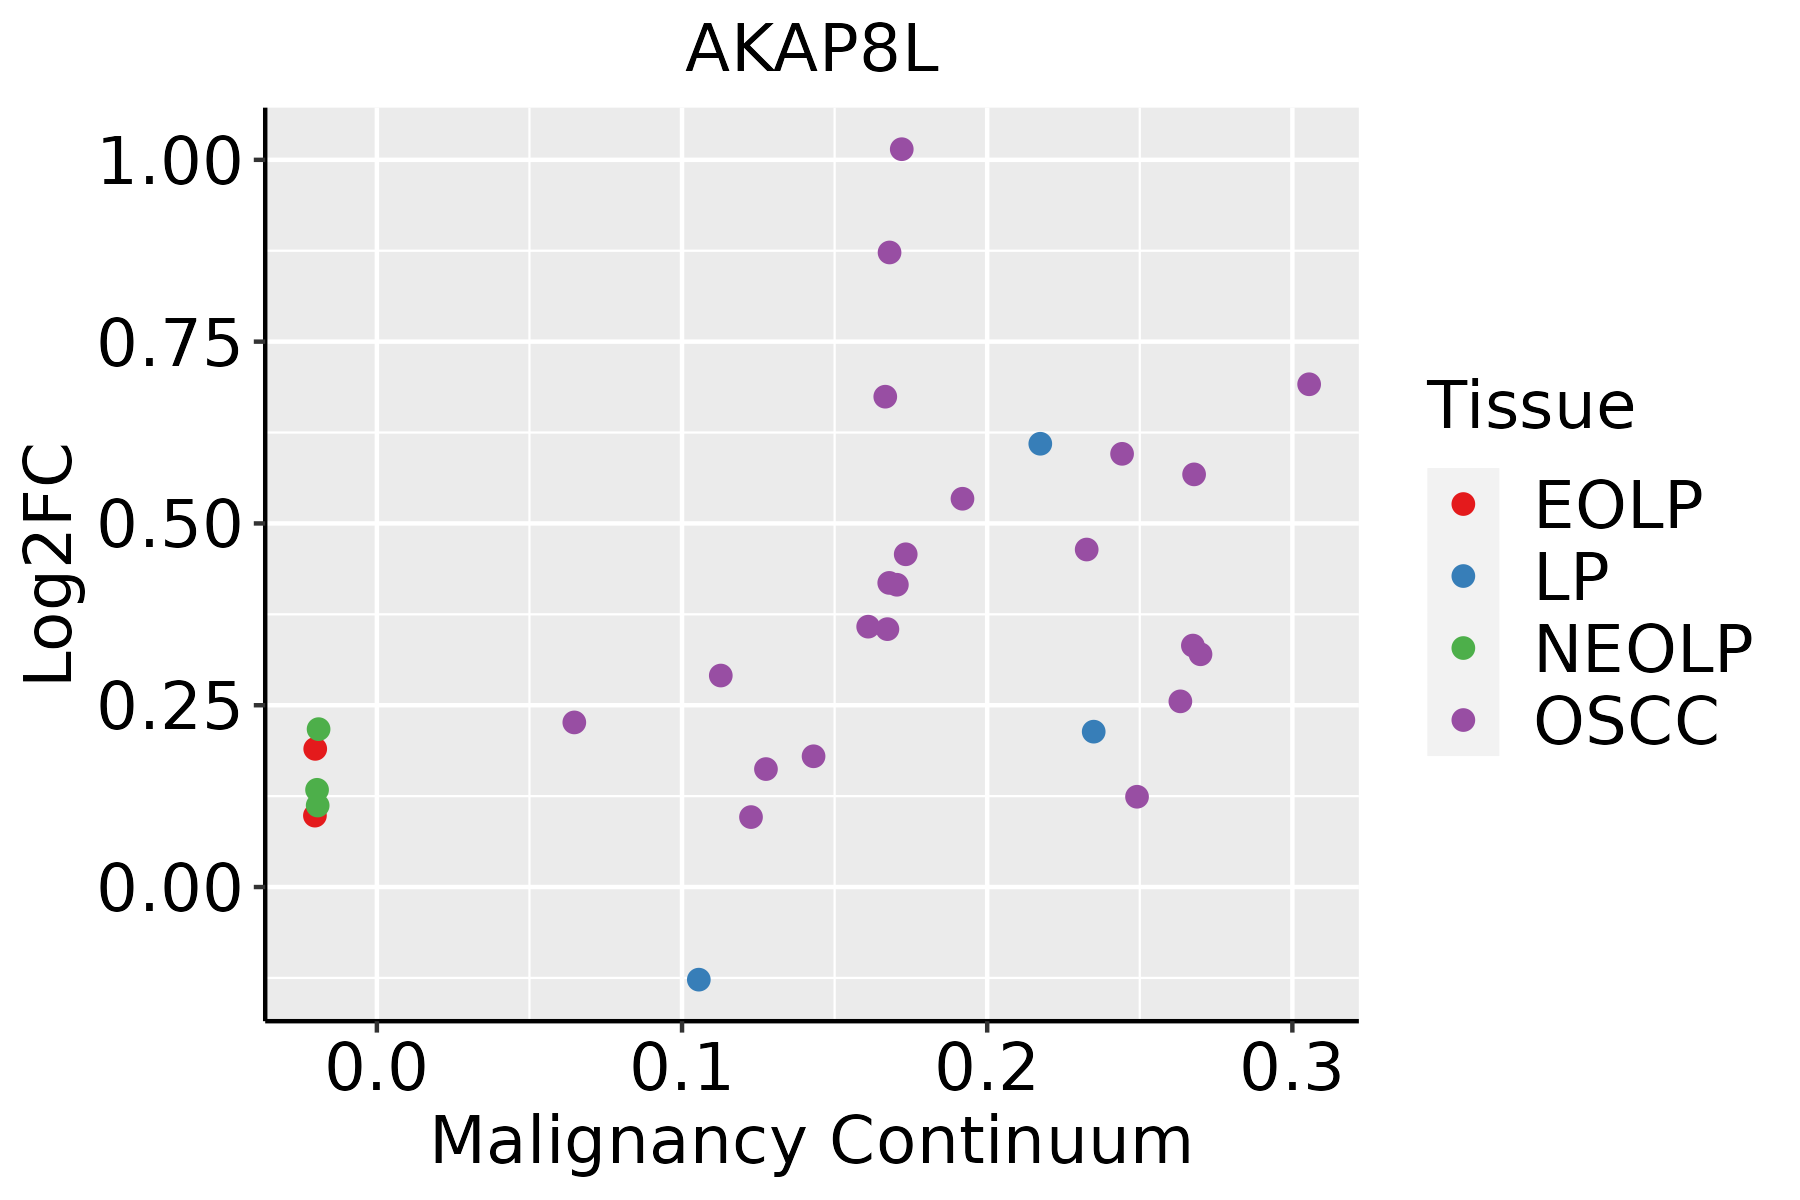 | EOLP: Erosive Oral lichen planus |
| LP: leukoplakia | ||
| NEOLP: Non-erosive oral lichen planus | ||
| OSCC: Oral squamous cell carcinoma | ||
| Thyroid | 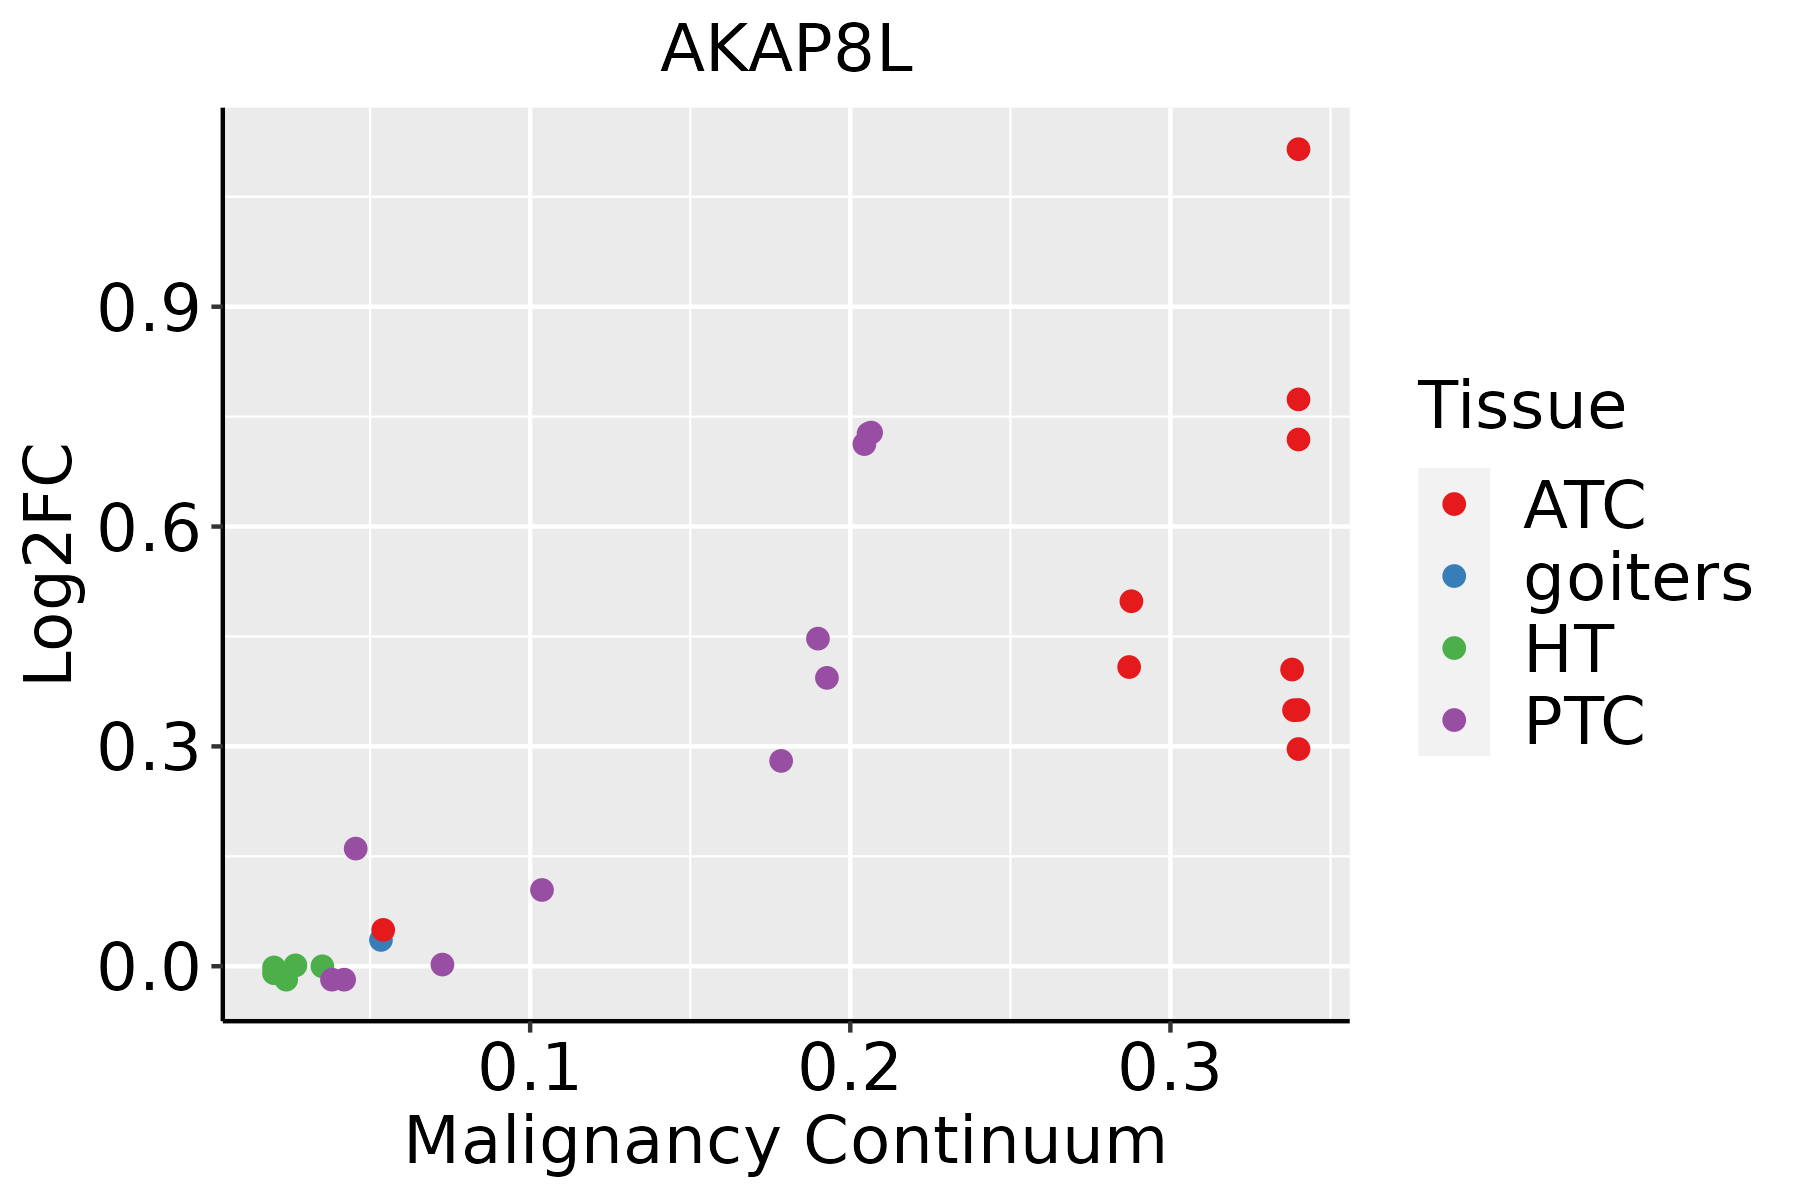 | ATC: Anaplastic thyroid cancer |
| HT: Hashimoto's thyroiditis | ||
| PTC: Papillary thyroid cancer |
| ∗log2FC in expression of this searched gene in stem-like cells from each diseased tissue sample relative to stem-like cells in normal samples in each tissue plotted against the malignancy continuum. Samples are colored based on if they are from different disease stage. |
Top |
Malignant transformation related pathway analysis |
| Find out the enriched GO biological processes and KEGG pathways involved in transition from healthy to precancer to cancer |
| Tissue | Disease Stage | Enriched GO biological Processes |
| Colorectum | AD |  |
| Colorectum | SER |  |
| Colorectum | MSS |  |
| Colorectum | MSI-H |  |
| Colorectum | FAP |  |
| ∗Top 15 enriched GO BP terms are showed in the bar plot of each disease state in each tissue. Each row represents a significant GO biological process which is colored according to the -log10(p.adjust). |
| Page: 1 2 3 4 5 6 7 8 9 |
| GO ID | Tissue | Disease Stage | Description | Gene Ratio | Bg Ratio | pvalue | p.adjust | Count |
| GO:0008380111 | Esophagus | ESCC | RNA splicing | 336/8552 | 434/18723 | 1.74e-42 | 3.67e-39 | 336 |
| GO:0006913110 | Esophagus | ESCC | nucleocytoplasmic transport | 230/8552 | 301/18723 | 6.04e-28 | 2.02e-25 | 230 |
| GO:0051169110 | Esophagus | ESCC | nuclear transport | 230/8552 | 301/18723 | 6.04e-28 | 2.02e-25 | 230 |
| GO:0006403110 | Esophagus | ESCC | RNA localization | 166/8552 | 201/18723 | 1.95e-27 | 6.18e-25 | 166 |
| GO:001657015 | Esophagus | ESCC | histone modification | 323/8552 | 463/18723 | 2.61e-26 | 7.88e-24 | 323 |
| GO:014001414 | Esophagus | ESCC | mitotic nuclear division | 218/8552 | 287/18723 | 6.17e-26 | 1.78e-23 | 218 |
| GO:0022411111 | Esophagus | ESCC | cellular component disassembly | 305/8552 | 443/18723 | 1.94e-23 | 4.57e-21 | 305 |
| GO:003238618 | Esophagus | ESCC | regulation of intracellular transport | 243/8552 | 337/18723 | 3.20e-23 | 7.25e-21 | 243 |
| GO:000007011 | Esophagus | ESCC | mitotic sister chromatid segregation | 138/8552 | 168/18723 | 1.37e-22 | 2.63e-20 | 138 |
| GO:00008194 | Esophagus | ESCC | sister chromatid segregation | 157/8552 | 202/18723 | 8.41e-21 | 1.33e-18 | 157 |
| GO:005123617 | Esophagus | ESCC | establishment of RNA localization | 134/8552 | 166/18723 | 1.23e-20 | 1.81e-18 | 134 |
| GO:0051168110 | Esophagus | ESCC | nuclear export | 126/8552 | 154/18723 | 1.88e-20 | 2.65e-18 | 126 |
| GO:005102815 | Esophagus | ESCC | mRNA transport | 110/8552 | 130/18723 | 2.76e-20 | 3.80e-18 | 110 |
| GO:005065717 | Esophagus | ESCC | nucleic acid transport | 131/8552 | 163/18723 | 6.94e-20 | 8.46e-18 | 131 |
| GO:005065817 | Esophagus | ESCC | RNA transport | 131/8552 | 163/18723 | 6.94e-20 | 8.46e-18 | 131 |
| GO:000705911 | Esophagus | ESCC | chromosome segregation | 238/8552 | 346/18723 | 1.72e-18 | 1.82e-16 | 238 |
| GO:001593117 | Esophagus | ESCC | nucleobase-containing compound transport | 162/8552 | 222/18723 | 9.87e-17 | 7.93e-15 | 162 |
| GO:0046822110 | Esophagus | ESCC | regulation of nucleocytoplasmic transport | 88/8552 | 106/18723 | 1.88e-15 | 1.19e-13 | 88 |
| GO:007116612 | Esophagus | ESCC | ribonucleoprotein complex localization | 66/8552 | 77/18723 | 2.94e-13 | 1.38e-11 | 66 |
| GO:00482853 | Esophagus | ESCC | organelle fission | 301/8552 | 488/18723 | 4.64e-13 | 2.12e-11 | 301 |
| Page: 1 2 3 4 5 6 7 8 9 10 11 12 13 14 15 16 17 18 |
| Pathway ID | Tissue | Disease Stage | Description | Gene Ratio | Bg Ratio | pvalue | p.adjust | qvalue | Count |
| Page: 1 |
Top |
Cell-cell communication analysis |
| Identification of potential cell-cell interactions between two cell types and their ligand-receptor pairs for different disease states |
| Ligand | Receptor | LRpair | Pathway | Tissue | Disease Stage |
| Page: 1 |
Top |
Single-cell gene regulatory network inference analysis |
| Find out the significant the regulons (TFs) and the target genes of each regulon across cell types for different disease states |
| TF | Cell Type | Tissue | Disease Stage | Target Gene | RSS | Regulon Activity |
| ∗The dot plots of a searched regulon are shown for all cell subpopulations in each disease state of each tissue based on the regulon specific score inferred using pySCENIC and by calculating the average expression. |
| Page: 1 |
Top |
Somatic mutation of malignant transformation related genes |
| Annotation of somatic variants for genes involved in malignant transformation |
| Hugo Symbol | Variant Class | Variant Classification | dbSNP RS | HGVSc | HGVSp | HGVSp Short | SWISSPROT | BIOTYPE | SIFT | PolyPhen | Tumor Sample Barcode | Tissue | Histology | Sex | Age | Stage | Therapy Types | Drugs | Outcome |
| AKAP8L | SNV | Missense_Mutation | novel | c.1625N>G | p.Tyr542Cys | p.Y542C | Q9ULX6 | protein_coding | deleterious(0) | probably_damaging(0.998) | TCGA-AN-A0FF-01 | Breast | breast invasive carcinoma | Female | <65 | I/II | Unknown | Unknown | SD |
| AKAP8L | SNV | Missense_Mutation | c.287N>T | p.Asn96Ile | p.N96I | Q9ULX6 | protein_coding | deleterious(0) | probably_damaging(0.997) | TCGA-AO-A0J2-01 | Breast | breast invasive carcinoma | Female | <65 | I/II | Chemotherapy | cyclophosphamide | SD | |
| AKAP8L | SNV | Missense_Mutation | novel | c.572G>C | p.Arg191Pro | p.R191P | Q9ULX6 | protein_coding | deleterious(0.02) | possibly_damaging(0.882) | TCGA-GI-A2C9-01 | Breast | breast invasive carcinoma | Female | <65 | I/II | Unspecific | SD | |
| AKAP8L | insertion | Frame_Shift_Ins | novel | c.680_681insAGCAAAGCCACCCGCACGGACTGCTCGGA | p.Pro228AlafsTer39 | p.P228Afs*39 | Q9ULX6 | protein_coding | TCGA-BH-A0HF-01 | Breast | breast invasive carcinoma | Female | >=65 | I/II | Hormone Therapy | arimidex | SD | ||
| AKAP8L | SNV | Missense_Mutation | novel | c.292N>T | p.Arg98Cys | p.R98C | Q9ULX6 | protein_coding | deleterious(0) | probably_damaging(0.997) | TCGA-2W-A8YY-01 | Cervix | cervical & endocervical cancer | Female | <65 | I/II | Chemotherapy | cisplatin | CR |
| AKAP8L | SNV | Missense_Mutation | rs570266491 | c.1088N>A | p.Arg363His | p.R363H | Q9ULX6 | protein_coding | tolerated(0.06) | benign(0.017) | TCGA-EX-A1H6-01 | Cervix | cervical & endocervical cancer | Female | <65 | I/II | Unknown | Unknown | SD |
| AKAP8L | SNV | Missense_Mutation | c.916G>A | p.Glu306Lys | p.E306K | Q9ULX6 | protein_coding | tolerated(0.06) | possibly_damaging(0.54) | TCGA-Q1-A73O-01 | Cervix | cervical & endocervical cancer | Female | <65 | I/II | Chemotherapy | cisplatin | CR | |
| AKAP8L | SNV | Missense_Mutation | novel | c.327N>A | p.Met109Ile | p.M109I | Q9ULX6 | protein_coding | tolerated(0.22) | benign(0.075) | TCGA-VS-A9UC-01 | Cervix | cervical & endocervical cancer | Female | <65 | I/II | Chemotherapy | cisplatin | SD |
| AKAP8L | SNV | Missense_Mutation | c.1336C>A | p.Leu446Ile | p.L446I | Q9ULX6 | protein_coding | deleterious(0.01) | possibly_damaging(0.543) | TCGA-AA-3663-01 | Colorectum | colon adenocarcinoma | Male | <65 | I/II | Unknown | Unknown | SD | |
| AKAP8L | SNV | Missense_Mutation | c.1532N>A | p.Arg511His | p.R511H | Q9ULX6 | protein_coding | deleterious(0) | probably_damaging(0.996) | TCGA-G4-6628-01 | Colorectum | colon adenocarcinoma | Male | >=65 | I/II | Unknown | Unknown | SD |
| Page: 1 2 3 4 5 6 7 |
Top |
Related drugs of malignant transformation related genes |
| Identification of chemicals and drugs interact with genes involved in malignant transfromation |
| (DGIdb 4.0) |
| Entrez ID | Symbol | Category | Interaction Types | Drug Claim Name | Drug Name | PMIDs |
| Page: 1 |

Copyright 2023-Present -The University of Texas Health Science Center at Houston |