
|
|||||
|
 | |
| |
| |
| |
| |
| |
|
Gene: AKAP6 |
Gene summary for AKAP6 |
| Gene information | Species | Human | Gene symbol | AKAP6 | Gene ID | 9472 |
| Gene name | A-kinase anchoring protein 6 | |
| Gene Alias | ADAP100 | |
| Cytomap | 14q12 | |
| Gene Type | protein-coding | GO ID | GO:0001508 | UniProtAcc | B2RP22 |
Top |
Malignant transformation analysis |
| Identification of the aberrant gene expression in precancerous and cancerous lesions by comparing the gene expression of stem-like cells in diseased tissues with normal stem cells |
| Entrez ID | Symbol | Replicates | Species | Organ | Tissue | Adj P-value | Log2FC | Malignancy |
| 9472 | AKAP6 | HTA11_3410_2000001011 | Human | Colorectum | AD | 3.61e-02 | 1.68e-01 | 0.0155 |
| 9472 | AKAP6 | HTA11_1938_2000001011 | Human | Colorectum | AD | 4.64e-02 | 2.20e-01 | -0.0811 |
| 9472 | AKAP6 | HTA11_347_2000001011 | Human | Colorectum | AD | 6.21e-05 | 2.62e-01 | -0.1954 |
| 9472 | AKAP6 | HTA11_411_2000001011 | Human | Colorectum | SER | 3.90e-02 | 4.59e-01 | -0.2602 |
| 9472 | AKAP6 | HTA11_83_2000001011 | Human | Colorectum | SER | 2.59e-02 | 2.12e-01 | -0.1526 |
| 9472 | AKAP6 | HTA11_696_2000001011 | Human | Colorectum | AD | 3.41e-06 | 1.80e-01 | -0.1464 |
| 9472 | AKAP6 | HTA11_866_2000001011 | Human | Colorectum | AD | 2.15e-02 | 1.41e-01 | -0.1001 |
| 9472 | AKAP6 | HTA11_5212_2000001011 | Human | Colorectum | AD | 9.17e-05 | 5.42e-01 | -0.2061 |
| 9472 | AKAP6 | HTA11_99999970781_79442 | Human | Colorectum | MSS | 7.16e-03 | 1.23e-01 | 0.294 |
| 9472 | AKAP6 | HTA11_99999965104_69814 | Human | Colorectum | MSS | 3.16e-50 | 1.94e+00 | 0.281 |
| 9472 | AKAP6 | HTA11_99999974143_84620 | Human | Colorectum | MSS | 7.20e-09 | 1.79e-01 | 0.3005 |
| 9472 | AKAP6 | RNA-P17T-P17T-6 | Human | Lung | IAC | 4.28e-05 | 5.70e-01 | 0.3385 |
| 9472 | AKAP6 | RNA-P17T-P17T-8 | Human | Lung | IAC | 5.44e-06 | 6.12e-01 | 0.3329 |
| 9472 | AKAP6 | RNA-P25T1-P25T1-4 | Human | Lung | AIS | 3.15e-03 | 3.05e-01 | -0.2119 |
| 9472 | AKAP6 | RNA-P6T2-P6T2-1 | Human | Lung | IAC | 2.64e-21 | 6.55e-01 | -0.0166 |
| 9472 | AKAP6 | RNA-P6T2-P6T2-2 | Human | Lung | IAC | 1.42e-19 | 5.67e-01 | -0.0132 |
| 9472 | AKAP6 | RNA-P6T2-P6T2-3 | Human | Lung | IAC | 5.10e-22 | 6.13e-01 | -0.013 |
| 9472 | AKAP6 | RNA-P6T2-P6T2-4 | Human | Lung | IAC | 6.45e-22 | 6.38e-01 | -0.0121 |
| Page: 1 |
| Tissue | Expression Dynamics | Abbreviation |
| Colorectum (GSE201348) |  | FAP: Familial adenomatous polyposis |
| CRC: Colorectal cancer | ||
| Colorectum (HTA11) |  | AD: Adenomas |
| SER: Sessile serrated lesions | ||
| MSI-H: Microsatellite-high colorectal cancer | ||
| MSS: Microsatellite stable colorectal cancer | ||
| Lung | 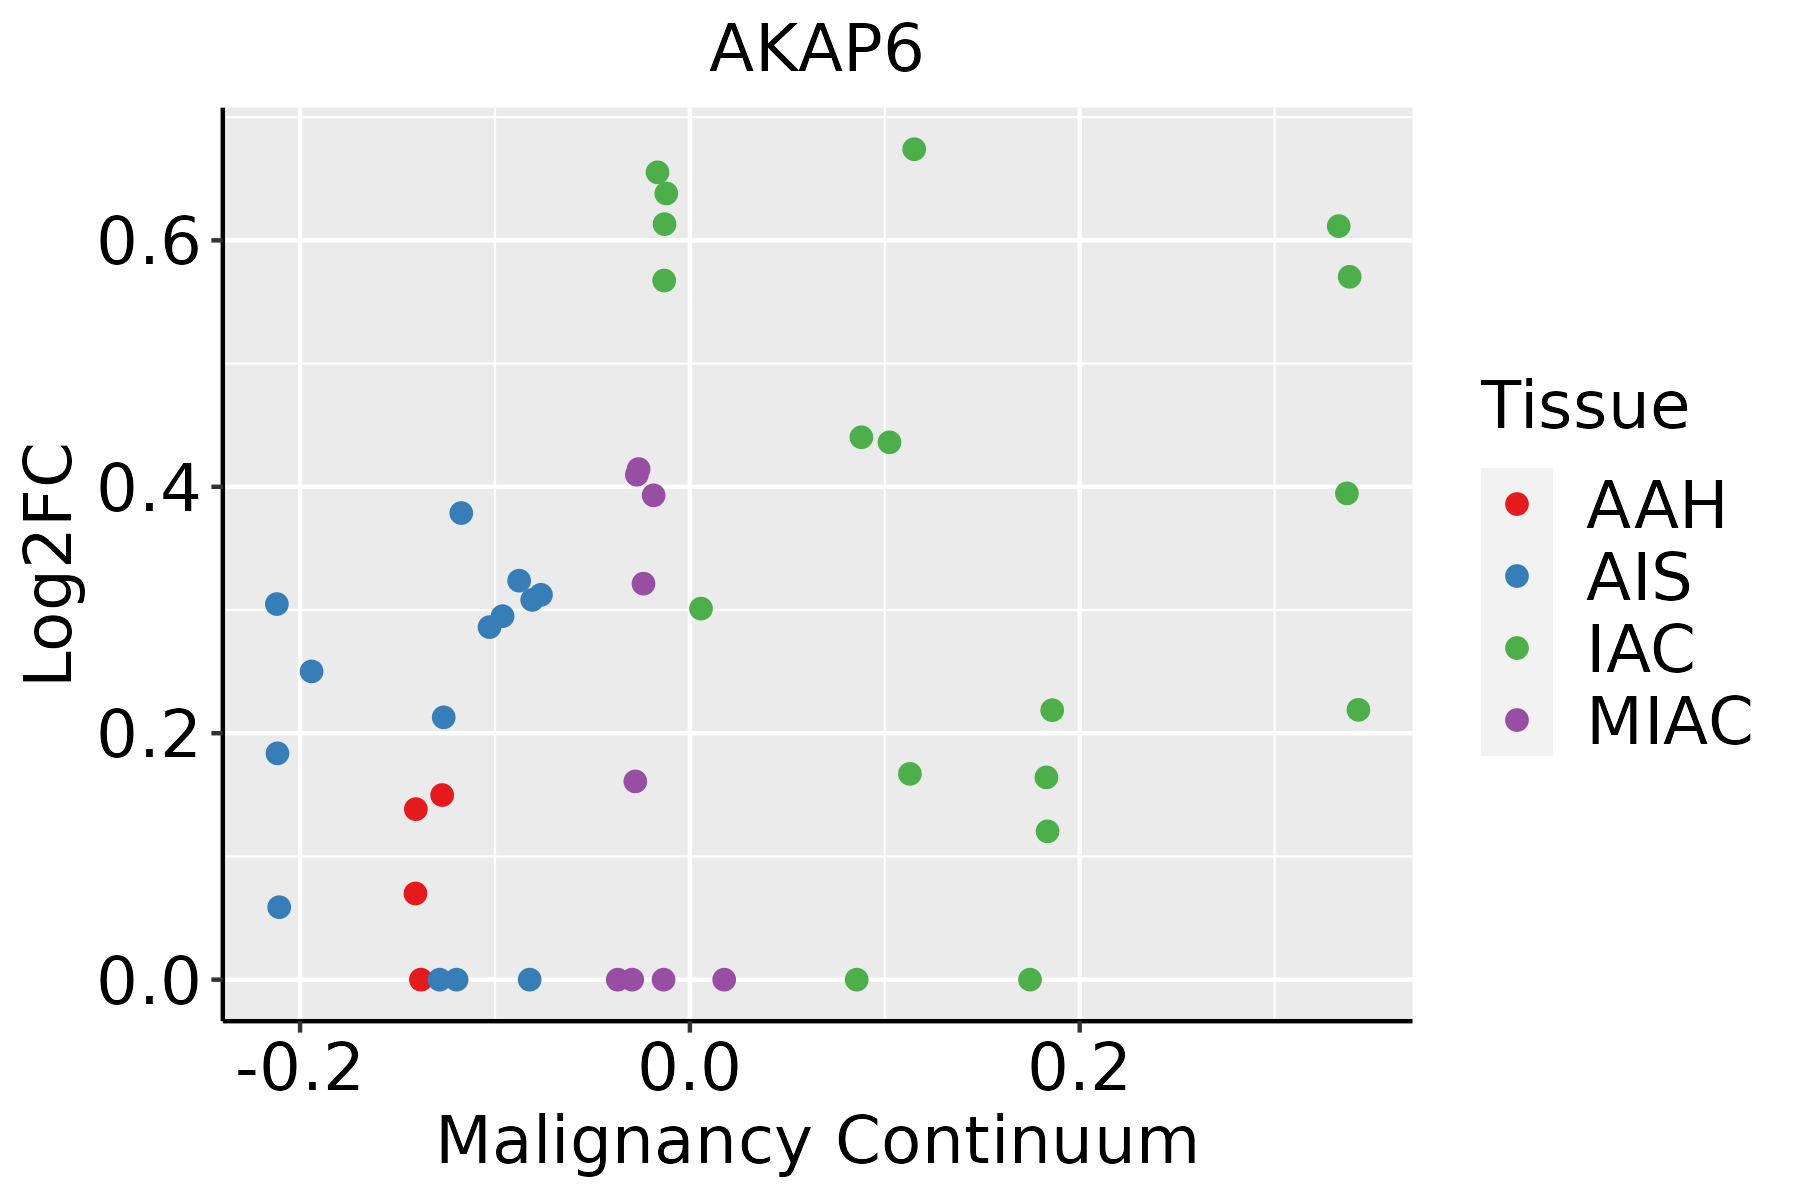 | AAH: Atypical adenomatous hyperplasia |
| AIS: Adenocarcinoma in situ | ||
| IAC: Invasive lung adenocarcinoma | ||
| MIA: Minimally invasive adenocarcinoma |
| ∗log2FC in expression of this searched gene in stem-like cells from each diseased tissue sample relative to stem-like cells in normal samples in each tissue plotted against the malignancy continuum. Samples are colored based on if they are from different disease stage. |
Top |
Malignant transformation related pathway analysis |
| Find out the enriched GO biological processes and KEGG pathways involved in transition from healthy to precancer to cancer |
| Tissue | Disease Stage | Enriched GO biological Processes |
| Colorectum | AD |  |
| Colorectum | SER |  |
| Colorectum | MSS |  |
| Colorectum | MSI-H |  |
| Colorectum | FAP |  |
| ∗Top 15 enriched GO BP terms are showed in the bar plot of each disease state in each tissue. Each row represents a significant GO biological process which is colored according to the -log10(p.adjust). |
| Page: 1 2 3 4 5 6 7 8 9 |
| GO ID | Tissue | Disease Stage | Description | Gene Ratio | Bg Ratio | pvalue | p.adjust | Count |
| GO:0006605 | Colorectum | AD | protein targeting | 105/3918 | 314/18723 | 1.39e-07 | 6.44e-06 | 105 |
| GO:0016049 | Colorectum | AD | cell growth | 143/3918 | 482/18723 | 2.83e-06 | 8.09e-05 | 143 |
| GO:0001558 | Colorectum | AD | regulation of cell growth | 124/3918 | 414/18723 | 7.67e-06 | 1.86e-04 | 124 |
| GO:0030307 | Colorectum | AD | positive regulation of cell growth | 54/3918 | 166/18723 | 3.08e-04 | 3.69e-03 | 54 |
| GO:0045927 | Colorectum | AD | positive regulation of growth | 77/3918 | 259/18723 | 4.82e-04 | 5.27e-03 | 77 |
| GO:0090257 | Colorectum | AD | regulation of muscle system process | 73/3918 | 252/18723 | 1.46e-03 | 1.24e-02 | 73 |
| GO:0048638 | Colorectum | AD | regulation of developmental growth | 92/3918 | 330/18723 | 1.48e-03 | 1.25e-02 | 92 |
| GO:0048588 | Colorectum | AD | developmental cell growth | 67/3918 | 234/18723 | 3.03e-03 | 2.25e-02 | 67 |
| GO:0048639 | Colorectum | AD | positive regulation of developmental growth | 52/3918 | 174/18723 | 3.24e-03 | 2.38e-02 | 52 |
| GO:0051591 | Colorectum | AD | response to cAMP | 31/3918 | 93/18723 | 3.59e-03 | 2.58e-02 | 31 |
| GO:0071320 | Colorectum | AD | cellular response to cAMP | 20/3918 | 53/18723 | 3.71e-03 | 2.62e-02 | 20 |
| GO:0051651 | Colorectum | AD | maintenance of location in cell | 61/3918 | 214/18723 | 5.02e-03 | 3.37e-02 | 61 |
| GO:0032411 | Colorectum | AD | positive regulation of transporter activity | 37/3918 | 120/18723 | 6.82e-03 | 4.22e-02 | 37 |
| GO:0043502 | Colorectum | AD | regulation of muscle adaptation | 31/3918 | 98/18723 | 8.45e-03 | 4.94e-02 | 31 |
| GO:00066051 | Colorectum | SER | protein targeting | 76/2897 | 314/18723 | 3.19e-05 | 8.47e-04 | 76 |
| GO:00902571 | Colorectum | SER | regulation of muscle system process | 60/2897 | 252/18723 | 3.28e-04 | 5.22e-03 | 60 |
| GO:00015581 | Colorectum | SER | regulation of cell growth | 90/2897 | 414/18723 | 4.00e-04 | 6.02e-03 | 90 |
| GO:00160491 | Colorectum | SER | cell growth | 100/2897 | 482/18723 | 1.07e-03 | 1.24e-02 | 100 |
| GO:00435021 | Colorectum | SER | regulation of muscle adaptation | 27/2897 | 98/18723 | 1.54e-03 | 1.65e-02 | 27 |
| GO:00324111 | Colorectum | SER | positive regulation of transporter activity | 31/2897 | 120/18723 | 2.25e-03 | 2.16e-02 | 31 |
| Page: 1 2 3 4 5 6 |
| Pathway ID | Tissue | Disease Stage | Description | Gene Ratio | Bg Ratio | pvalue | p.adjust | qvalue | Count |
| Page: 1 |
Top |
Cell-cell communication analysis |
| Identification of potential cell-cell interactions between two cell types and their ligand-receptor pairs for different disease states |
| Ligand | Receptor | LRpair | Pathway | Tissue | Disease Stage |
| Page: 1 |
Top |
Single-cell gene regulatory network inference analysis |
| Find out the significant the regulons (TFs) and the target genes of each regulon across cell types for different disease states |
| TF | Cell Type | Tissue | Disease Stage | Target Gene | RSS | Regulon Activity |
| ∗The dot plots of a searched regulon are shown for all cell subpopulations in each disease state of each tissue based on the regulon specific score inferred using pySCENIC and by calculating the average expression. |
| Page: 1 |
Top |
Somatic mutation of malignant transformation related genes |
| Annotation of somatic variants for genes involved in malignant transformation |
| Hugo Symbol | Variant Class | Variant Classification | dbSNP RS | HGVSc | HGVSp | HGVSp Short | SWISSPROT | BIOTYPE | SIFT | PolyPhen | Tumor Sample Barcode | Tissue | Histology | Sex | Age | Stage | Therapy Types | Drugs | Outcome |
| AKAP6 | SNV | Missense_Mutation | c.6141N>A | p.His2047Gln | p.H2047Q | Q13023 | protein_coding | tolerated(0.22) | benign(0.139) | TCGA-A2-A0T0-01 | Breast | breast invasive carcinoma | Female | <65 | I/II | Chemotherapy | taxotere | SD | |
| AKAP6 | SNV | Missense_Mutation | novel | c.445C>A | p.Leu149Ile | p.L149I | Q13023 | protein_coding | deleterious(0.04) | probably_damaging(0.991) | TCGA-A8-A095-01 | Breast | breast invasive carcinoma | Female | <65 | I/II | Chemotherapy | 5-fluorouracil | CR |
| AKAP6 | SNV | Missense_Mutation | rs141386857 | c.3082G>A | p.Val1028Ile | p.V1028I | Q13023 | protein_coding | tolerated(0.07) | benign(0.006) | TCGA-A8-A09Z-01 | Breast | breast invasive carcinoma | Female | >=65 | I/II | Unknown | Unknown | SD |
| AKAP6 | SNV | Missense_Mutation | novel | c.5953T>C | p.Ser1985Pro | p.S1985P | Q13023 | protein_coding | tolerated(1) | benign(0) | TCGA-AC-A3QQ-01 | Breast | breast invasive carcinoma | Female | <65 | I/II | Unknown | Unknown | SD |
| AKAP6 | SNV | Missense_Mutation | rs868161302 | c.676N>A | p.Glu226Lys | p.E226K | Q13023 | protein_coding | deleterious(0) | probably_damaging(0.99) | TCGA-AN-A046-01 | Breast | breast invasive carcinoma | Female | >=65 | I/II | Unknown | Unknown | SD |
| AKAP6 | SNV | Missense_Mutation | rs763532229 | c.4955N>A | p.Arg1652Gln | p.R1652Q | Q13023 | protein_coding | deleterious(0) | probably_damaging(0.992) | TCGA-AN-A046-01 | Breast | breast invasive carcinoma | Female | >=65 | I/II | Unknown | Unknown | SD |
| AKAP6 | SNV | Missense_Mutation | c.2832N>C | p.Lys944Asn | p.K944N | Q13023 | protein_coding | deleterious(0.01) | possibly_damaging(0.541) | TCGA-AR-A24H-01 | Breast | breast invasive carcinoma | Female | >=65 | I/II | Hormone Therapy | tamoxiphen | SD | |
| AKAP6 | SNV | Missense_Mutation | novel | c.2022N>A | p.Met674Ile | p.M674I | Q13023 | protein_coding | deleterious(0.02) | benign(0.068) | TCGA-BH-A0HF-01 | Breast | breast invasive carcinoma | Female | >=65 | I/II | Hormone Therapy | arimidex | SD |
| AKAP6 | SNV | Missense_Mutation | c.505C>A | p.Leu169Met | p.L169M | Q13023 | protein_coding | deleterious(0) | probably_damaging(0.998) | TCGA-BH-A0HY-01 | Breast | breast invasive carcinoma | Female | <65 | I/II | Hormone Therapy | taxotere | CR | |
| AKAP6 | SNV | Missense_Mutation | c.3652N>C | p.Glu1218Gln | p.E1218Q | Q13023 | protein_coding | deleterious(0) | probably_damaging(0.996) | TCGA-BH-A18K-01 | Breast | breast invasive carcinoma | Female | <65 | I/II | Unknown | Unknown | PD |
| Page: 1 2 3 4 5 6 7 8 9 10 11 12 13 14 15 16 17 18 19 20 21 22 23 24 25 26 27 28 29 30 31 32 |
Top |
Related drugs of malignant transformation related genes |
| Identification of chemicals and drugs interact with genes involved in malignant transfromation |
| (DGIdb 4.0) |
| Entrez ID | Symbol | Category | Interaction Types | Drug Claim Name | Drug Name | PMIDs |
| Page: 1 |

Copyright 2023-Present -The University of Texas Health Science Center at Houston |