
|
|||||
|
 | |
| |
| |
| |
| |
| |
|
Gene: AKAP5 |
Gene summary for AKAP5 |
| Gene information | Species | Human | Gene symbol | AKAP5 | Gene ID | 9495 |
| Gene name | A-kinase anchoring protein 5 | |
| Gene Alias | AKAP75 | |
| Cytomap | 14q23.3 | |
| Gene Type | protein-coding | GO ID | GO:0006810 | UniProtAcc | P24588 |
Top |
Malignant transformation analysis |
| Identification of the aberrant gene expression in precancerous and cancerous lesions by comparing the gene expression of stem-like cells in diseased tissues with normal stem cells |
| Entrez ID | Symbol | Replicates | Species | Organ | Tissue | Adj P-value | Log2FC | Malignancy |
| 9495 | AKAP5 | HCC1 | Human | Liver | HCC | 1.25e-16 | 2.02e+00 | 0.5336 |
| 9495 | AKAP5 | HCC2 | Human | Liver | HCC | 1.41e-19 | 2.13e+00 | 0.5341 |
| 9495 | AKAP5 | HCC5 | Human | Liver | HCC | 4.55e-11 | 1.66e+00 | 0.4932 |
| Page: 1 |
| Tissue | Expression Dynamics | Abbreviation |
| Liver | 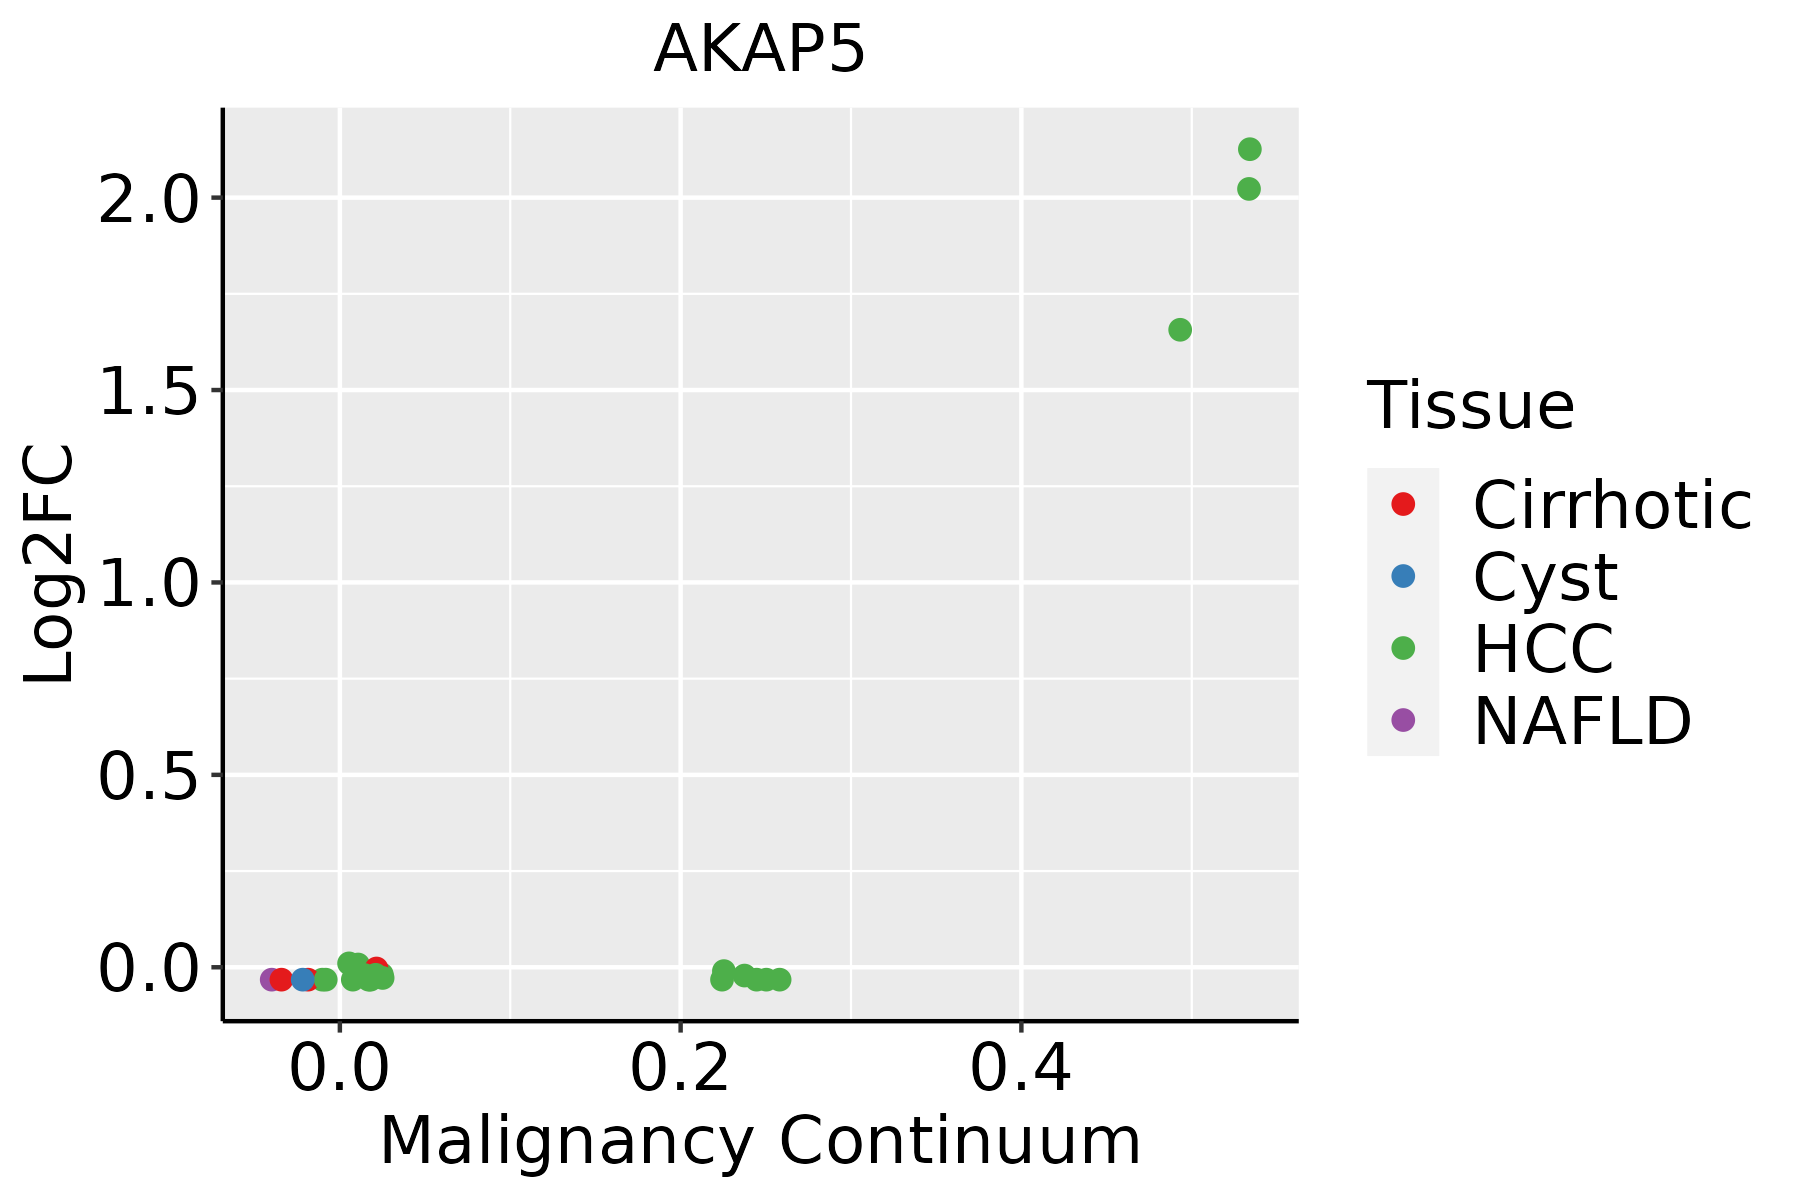 | HCC: Hepatocellular carcinoma |
| NAFLD: Non-alcoholic fatty liver disease |
| ∗log2FC in expression of this searched gene in stem-like cells from each diseased tissue sample relative to stem-like cells in normal samples in each tissue plotted against the malignancy continuum. Samples are colored based on if they are from different disease stage. |
Top |
Malignant transformation related pathway analysis |
| Find out the enriched GO biological processes and KEGG pathways involved in transition from healthy to precancer to cancer |
| Tissue | Disease Stage | Enriched GO biological Processes |
| Colorectum | AD |  |
| Colorectum | SER |  |
| Colorectum | MSS |  |
| Colorectum | MSI-H |  |
| Colorectum | FAP |  |
| ∗Top 15 enriched GO BP terms are showed in the bar plot of each disease state in each tissue. Each row represents a significant GO biological process which is colored according to the -log10(p.adjust). |
| Page: 1 2 3 4 5 6 7 8 9 |
| GO ID | Tissue | Disease Stage | Description | Gene Ratio | Bg Ratio | pvalue | p.adjust | Count |
| GO:190382922 | Liver | HCC | positive regulation of cellular protein localization | 199/7958 | 276/18723 | 1.15e-23 | 2.62e-21 | 199 |
| GO:003238621 | Liver | HCC | regulation of intracellular transport | 231/7958 | 337/18723 | 1.99e-22 | 3.40e-20 | 231 |
| GO:003315721 | Liver | HCC | regulation of intracellular protein transport | 165/7958 | 229/18723 | 8.37e-20 | 1.15e-17 | 165 |
| GO:003238821 | Liver | HCC | positive regulation of intracellular transport | 148/7958 | 202/18723 | 5.15e-19 | 6.66e-17 | 148 |
| GO:009031621 | Liver | HCC | positive regulation of intracellular protein transport | 121/7958 | 160/18723 | 1.27e-17 | 1.39e-15 | 121 |
| GO:190495122 | Liver | HCC | positive regulation of establishment of protein localization | 207/7958 | 319/18723 | 3.95e-16 | 3.29e-14 | 207 |
| GO:005122222 | Liver | HCC | positive regulation of protein transport | 194/7958 | 303/18723 | 2.41e-14 | 1.56e-12 | 194 |
| GO:001619721 | Liver | HCC | endosomal transport | 154/7958 | 230/18723 | 4.74e-14 | 2.95e-12 | 154 |
| GO:009015012 | Liver | HCC | establishment of protein localization to membrane | 168/7958 | 260/18723 | 4.07e-13 | 2.13e-11 | 168 |
| GO:007265921 | Liver | HCC | protein localization to plasma membrane | 177/7958 | 284/18723 | 1.02e-11 | 4.18e-10 | 177 |
| GO:199077821 | Liver | HCC | protein localization to cell periphery | 200/7958 | 333/18723 | 6.07e-11 | 2.23e-09 | 200 |
| GO:009887621 | Liver | HCC | vesicle-mediated transport to the plasma membrane | 92/7958 | 136/18723 | 2.57e-09 | 7.07e-08 | 92 |
| GO:190547511 | Liver | HCC | regulation of protein localization to membrane | 113/7958 | 175/18723 | 2.90e-09 | 7.78e-08 | 113 |
| GO:190437521 | Liver | HCC | regulation of protein localization to cell periphery | 83/7958 | 125/18723 | 5.60e-08 | 1.19e-06 | 83 |
| GO:190307621 | Liver | HCC | regulation of protein localization to plasma membrane | 69/7958 | 104/18723 | 7.58e-07 | 1.17e-05 | 69 |
| GO:190547711 | Liver | HCC | positive regulation of protein localization to membrane | 68/7958 | 106/18723 | 5.50e-06 | 6.82e-05 | 68 |
| GO:006195111 | Liver | HCC | establishment of protein localization to plasma membrane | 41/7958 | 60/18723 | 4.65e-05 | 4.49e-04 | 41 |
| GO:00324562 | Liver | HCC | endocytic recycling | 48/7958 | 73/18723 | 5.07e-05 | 4.83e-04 | 48 |
| GO:190437712 | Liver | HCC | positive regulation of protein localization to cell periphery | 45/7958 | 69/18723 | 1.16e-04 | 9.80e-04 | 45 |
| GO:190307812 | Liver | HCC | positive regulation of protein localization to plasma membrane | 40/7958 | 62/18723 | 3.84e-04 | 2.62e-03 | 40 |
| Page: 1 |
| Pathway ID | Tissue | Disease Stage | Description | Gene Ratio | Bg Ratio | pvalue | p.adjust | qvalue | Count |
| Page: 1 |
Top |
Cell-cell communication analysis |
| Identification of potential cell-cell interactions between two cell types and their ligand-receptor pairs for different disease states |
| Ligand | Receptor | LRpair | Pathway | Tissue | Disease Stage |
| Page: 1 |
Top |
Single-cell gene regulatory network inference analysis |
| Find out the significant the regulons (TFs) and the target genes of each regulon across cell types for different disease states |
| TF | Cell Type | Tissue | Disease Stage | Target Gene | RSS | Regulon Activity |
| ∗The dot plots of a searched regulon are shown for all cell subpopulations in each disease state of each tissue based on the regulon specific score inferred using pySCENIC and by calculating the average expression. |
| Page: 1 |
Top |
Somatic mutation of malignant transformation related genes |
| Annotation of somatic variants for genes involved in malignant transformation |
| Hugo Symbol | Variant Class | Variant Classification | dbSNP RS | HGVSc | HGVSp | HGVSp Short | SWISSPROT | BIOTYPE | SIFT | PolyPhen | Tumor Sample Barcode | Tissue | Histology | Sex | Age | Stage | Therapy Types | Drugs | Outcome |
| AKAP5 | insertion | Frame_Shift_Ins | novel | c.516_517insAAGCCCAAAGCTGGCTCTGAAGCTGCTGATGT | p.Ala173LysfsTer21 | p.A173Kfs*21 | P24588 | protein_coding | TCGA-A8-A09T-01 | Breast | breast invasive carcinoma | Female | >=65 | I/II | Hormone Therapy | anastrozole | SD | ||
| AKAP5 | insertion | In_Frame_Ins | novel | c.849_850insCATGCTTTGCTTCAAGAGAAGAAAGAAAGC | p.Ser283_Thr284insHisAlaLeuLeuGlnGluLysLysGluSer | p.S283_T284insHALLQEKKES | P24588 | protein_coding | TCGA-BH-A0E2-01 | Breast | breast invasive carcinoma | Female | <65 | III/IV | Chemotherapy | doxorubicin | SD | ||
| AKAP5 | SNV | Missense_Mutation | novel | c.401N>A | p.Arg134Lys | p.R134K | P24588 | protein_coding | tolerated(0.39) | benign(0.007) | TCGA-C5-A8ZZ-01 | Cervix | cervical & endocervical cancer | Female | <65 | I/II | Unspecific | Cisplatin | SD |
| AKAP5 | SNV | Missense_Mutation | c.1058N>T | p.Thr353Ile | p.T353I | P24588 | protein_coding | deleterious(0.02) | benign(0.039) | TCGA-EA-A556-01 | Cervix | cervical & endocervical cancer | Female | <65 | I/II | Unknown | Unknown | SD | |
| AKAP5 | SNV | Missense_Mutation | c.284N>T | p.Ser95Leu | p.S95L | P24588 | protein_coding | deleterious(0.02) | benign(0.046) | TCGA-A6-2686-01 | Colorectum | colon adenocarcinoma | Female | >=65 | I/II | Unknown | Unknown | SD | |
| AKAP5 | SNV | Missense_Mutation | c.776A>G | p.Gln259Arg | p.Q259R | P24588 | protein_coding | tolerated(0.55) | benign(0) | TCGA-AA-3710-01 | Colorectum | colon adenocarcinoma | Female | >=65 | I/II | Unknown | Unknown | SD | |
| AKAP5 | SNV | Missense_Mutation | c.1273N>A | p.Leu425Ile | p.L425I | P24588 | protein_coding | tolerated(0.1) | possibly_damaging(0.494) | TCGA-AA-A010-01 | Colorectum | colon adenocarcinoma | Female | <65 | I/II | Chemotherapy | folinic | CR | |
| AKAP5 | SNV | Missense_Mutation | c.853N>G | p.Leu285Val | p.L285V | P24588 | protein_coding | tolerated(0.26) | benign(0.034) | TCGA-DM-A1D9-01 | Colorectum | colon adenocarcinoma | Female | >=65 | I/II | Unknown | Unknown | SD | |
| AKAP5 | SNV | Missense_Mutation | c.704N>T | p.Thr235Met | p.T235M | P24588 | protein_coding | tolerated(0.16) | benign(0.015) | TCGA-WS-AB45-01 | Colorectum | colon adenocarcinoma | Female | <65 | I/II | Unknown | Unknown | SD | |
| AKAP5 | SNV | Missense_Mutation | novel | c.1171N>G | p.Leu391Val | p.L391V | P24588 | protein_coding | deleterious(0) | probably_damaging(0.998) | TCGA-AG-A014-01 | Colorectum | rectum adenocarcinoma | Male | >=65 | I/II | Unknown | Unknown | SD |
| Page: 1 2 3 4 5 |
Top |
Related drugs of malignant transformation related genes |
| Identification of chemicals and drugs interact with genes involved in malignant transfromation |
| (DGIdb 4.0) |
| Entrez ID | Symbol | Category | Interaction Types | Drug Claim Name | Drug Name | PMIDs |
| Page: 1 |

Copyright 2023-Present -The University of Texas Health Science Center at Houston |