
|
|||||
|
 | |
| |
| |
| |
| |
| |
|
Gene: AKAP17A |
Gene summary for AKAP17A |
| Gene information | Species | Human | Gene symbol | AKAP17A | Gene ID | 8227 |
| Gene name | A-kinase anchoring protein 17A | |
| Gene Alias | 721P | |
| Cytomap | X | |
| Gene Type | protein-coding | GO ID | GO:0001775 | UniProtAcc | Q02040 |
Top |
Malignant transformation analysis |
| Identification of the aberrant gene expression in precancerous and cancerous lesions by comparing the gene expression of stem-like cells in diseased tissues with normal stem cells |
| Entrez ID | Symbol | Replicates | Species | Organ | Tissue | Adj P-value | Log2FC | Malignancy |
| 8227 | AKAP17A | LZE2T | Human | Esophagus | ESCC | 2.18e-02 | 2.79e-01 | 0.082 |
| 8227 | AKAP17A | LZE20T | Human | Esophagus | ESCC | 2.26e-03 | 5.86e-02 | 0.0662 |
| 8227 | AKAP17A | LZE24T | Human | Esophagus | ESCC | 4.19e-04 | 4.47e-02 | 0.0596 |
| 8227 | AKAP17A | P1T-E | Human | Esophagus | ESCC | 9.79e-11 | 7.18e-01 | 0.0875 |
| 8227 | AKAP17A | P2T-E | Human | Esophagus | ESCC | 1.10e-39 | 7.43e-01 | 0.1177 |
| 8227 | AKAP17A | P4T-E | Human | Esophagus | ESCC | 2.09e-20 | 3.03e-01 | 0.1323 |
| 8227 | AKAP17A | P5T-E | Human | Esophagus | ESCC | 4.41e-17 | 3.73e-01 | 0.1327 |
| 8227 | AKAP17A | P8T-E | Human | Esophagus | ESCC | 6.38e-18 | 3.56e-01 | 0.0889 |
| 8227 | AKAP17A | P9T-E | Human | Esophagus | ESCC | 6.49e-03 | 8.57e-02 | 0.1131 |
| 8227 | AKAP17A | P10T-E | Human | Esophagus | ESCC | 2.72e-09 | 2.48e-01 | 0.116 |
| 8227 | AKAP17A | P11T-E | Human | Esophagus | ESCC | 3.08e-09 | 4.07e-01 | 0.1426 |
| 8227 | AKAP17A | P12T-E | Human | Esophagus | ESCC | 7.04e-18 | 4.73e-01 | 0.1122 |
| 8227 | AKAP17A | P15T-E | Human | Esophagus | ESCC | 6.67e-06 | 1.90e-01 | 0.1149 |
| 8227 | AKAP17A | P16T-E | Human | Esophagus | ESCC | 2.70e-12 | 3.06e-01 | 0.1153 |
| 8227 | AKAP17A | P17T-E | Human | Esophagus | ESCC | 8.29e-04 | 1.70e-01 | 0.1278 |
| 8227 | AKAP17A | P20T-E | Human | Esophagus | ESCC | 2.63e-07 | 6.93e-02 | 0.1124 |
| 8227 | AKAP17A | P21T-E | Human | Esophagus | ESCC | 2.76e-08 | 8.01e-02 | 0.1617 |
| 8227 | AKAP17A | P22T-E | Human | Esophagus | ESCC | 1.87e-10 | 2.23e-01 | 0.1236 |
| 8227 | AKAP17A | P23T-E | Human | Esophagus | ESCC | 1.18e-11 | 4.20e-01 | 0.108 |
| 8227 | AKAP17A | P24T-E | Human | Esophagus | ESCC | 3.78e-02 | 7.26e-02 | 0.1287 |
| Page: 1 2 3 4 5 |
| Tissue | Expression Dynamics | Abbreviation |
| Esophagus | 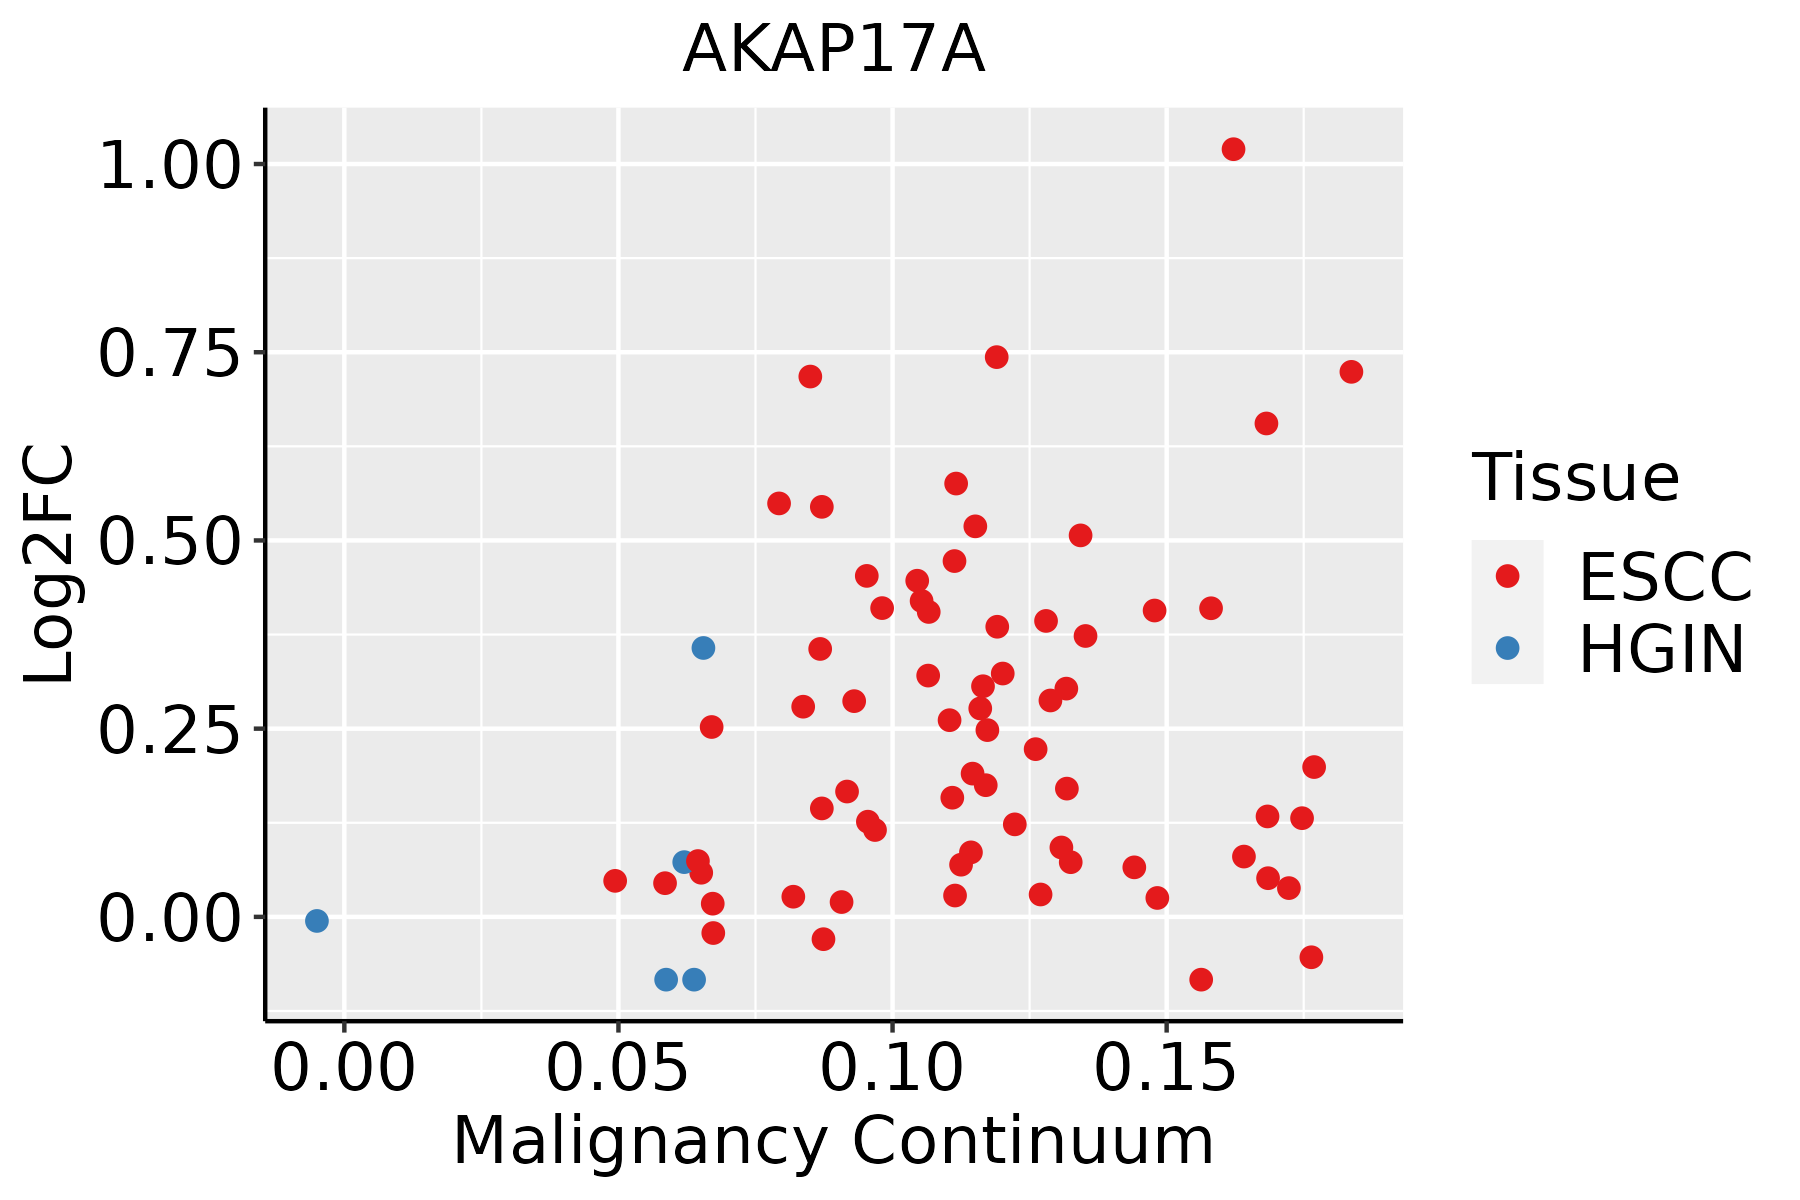 | ESCC: Esophageal squamous cell carcinoma |
| HGIN: High-grade intraepithelial neoplasias | ||
| LGIN: Low-grade intraepithelial neoplasias | ||
| Liver |  | HCC: Hepatocellular carcinoma |
| NAFLD: Non-alcoholic fatty liver disease | ||
| Oral Cavity |  | EOLP: Erosive Oral lichen planus |
| LP: leukoplakia | ||
| NEOLP: Non-erosive oral lichen planus | ||
| OSCC: Oral squamous cell carcinoma | ||
| Thyroid | 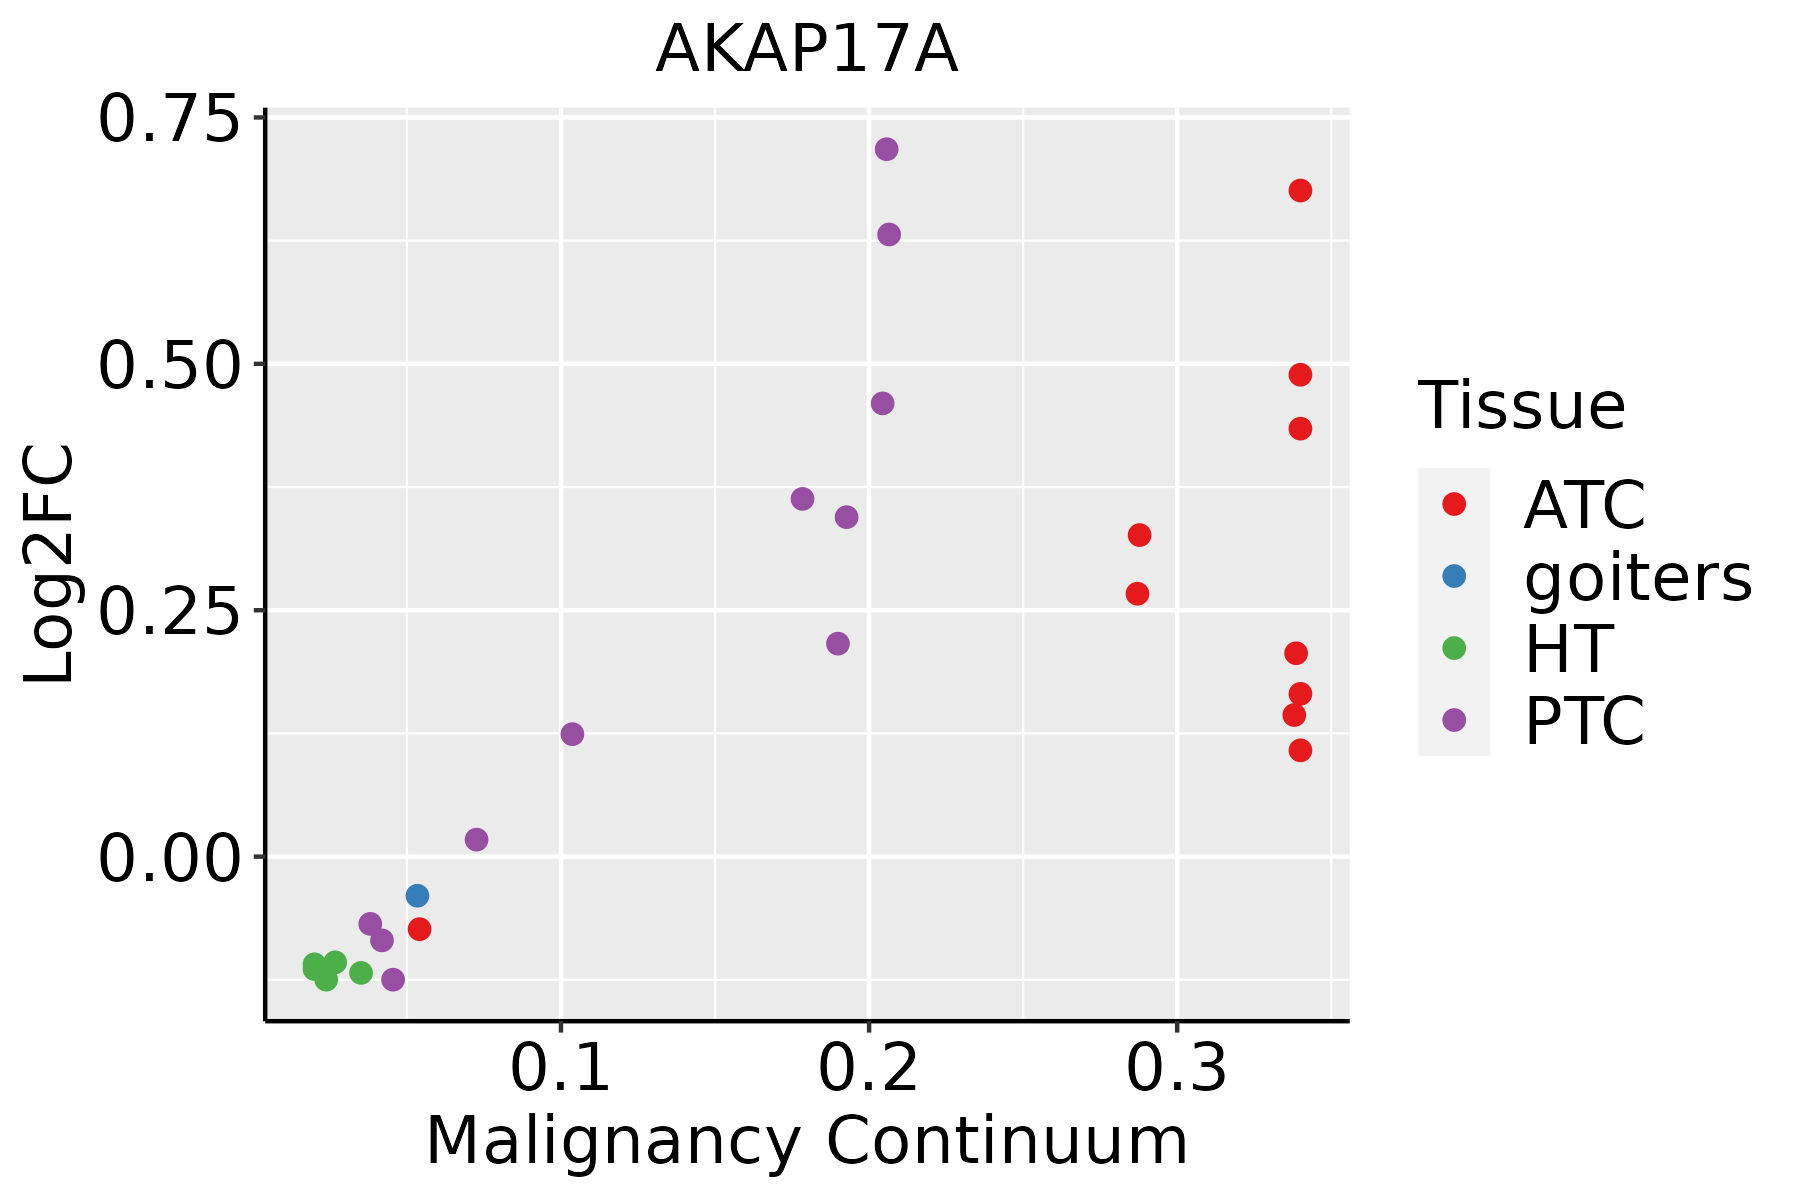 | ATC: Anaplastic thyroid cancer |
| HT: Hashimoto's thyroiditis | ||
| PTC: Papillary thyroid cancer |
| ∗log2FC in expression of this searched gene in stem-like cells from each diseased tissue sample relative to stem-like cells in normal samples in each tissue plotted against the malignancy continuum. Samples are colored based on if they are from different disease stage. |
Top |
Malignant transformation related pathway analysis |
| Find out the enriched GO biological processes and KEGG pathways involved in transition from healthy to precancer to cancer |
| Tissue | Disease Stage | Enriched GO biological Processes |
| Colorectum | AD |  |
| Colorectum | SER |  |
| Colorectum | MSS |  |
| Colorectum | MSI-H |  |
| Colorectum | FAP |  |
| ∗Top 15 enriched GO BP terms are showed in the bar plot of each disease state in each tissue. Each row represents a significant GO biological process which is colored according to the -log10(p.adjust). |
| Page: 1 2 3 4 5 6 7 8 9 |
| GO ID | Tissue | Disease Stage | Description | Gene Ratio | Bg Ratio | pvalue | p.adjust | Count |
| GO:0008380111 | Esophagus | ESCC | RNA splicing | 336/8552 | 434/18723 | 1.74e-42 | 3.67e-39 | 336 |
| GO:0043484111 | Esophagus | ESCC | regulation of RNA splicing | 116/8552 | 148/18723 | 3.18e-16 | 2.38e-14 | 116 |
| GO:000838022 | Liver | HCC | RNA splicing | 313/7958 | 434/18723 | 1.36e-36 | 1.73e-33 | 313 |
| GO:004348422 | Liver | HCC | regulation of RNA splicing | 113/7958 | 148/18723 | 4.32e-17 | 4.15e-15 | 113 |
| GO:000838020 | Oral cavity | OSCC | RNA splicing | 308/7305 | 434/18723 | 2.43e-42 | 7.70e-39 | 308 |
| GO:004348420 | Oral cavity | OSCC | regulation of RNA splicing | 108/7305 | 148/18723 | 4.25e-17 | 3.69e-15 | 108 |
| GO:0008380110 | Oral cavity | LP | RNA splicing | 237/4623 | 434/18723 | 1.82e-41 | 3.79e-38 | 237 |
| GO:0043484110 | Oral cavity | LP | regulation of RNA splicing | 81/4623 | 148/18723 | 4.34e-15 | 5.79e-13 | 81 |
| GO:0008380113 | Thyroid | PTC | RNA splicing | 273/5968 | 434/18723 | 4.44e-41 | 1.40e-37 | 273 |
| GO:0043484113 | Thyroid | PTC | regulation of RNA splicing | 102/5968 | 148/18723 | 2.03e-20 | 3.21e-18 | 102 |
| GO:000838034 | Thyroid | ATC | RNA splicing | 270/6293 | 434/18723 | 7.50e-35 | 1.19e-31 | 270 |
| GO:004348435 | Thyroid | ATC | regulation of RNA splicing | 100/6293 | 148/18723 | 2.75e-17 | 2.72e-15 | 100 |
| Page: 1 |
| Pathway ID | Tissue | Disease Stage | Description | Gene Ratio | Bg Ratio | pvalue | p.adjust | qvalue | Count |
| Page: 1 |
Top |
Cell-cell communication analysis |
| Identification of potential cell-cell interactions between two cell types and their ligand-receptor pairs for different disease states |
| Ligand | Receptor | LRpair | Pathway | Tissue | Disease Stage |
| Page: 1 |
Top |
Single-cell gene regulatory network inference analysis |
| Find out the significant the regulons (TFs) and the target genes of each regulon across cell types for different disease states |
| TF | Cell Type | Tissue | Disease Stage | Target Gene | RSS | Regulon Activity |
| ∗The dot plots of a searched regulon are shown for all cell subpopulations in each disease state of each tissue based on the regulon specific score inferred using pySCENIC and by calculating the average expression. |
| Page: 1 |
Top |
Somatic mutation of malignant transformation related genes |
| Annotation of somatic variants for genes involved in malignant transformation |
| Hugo Symbol | Variant Class | Variant Classification | dbSNP RS | HGVSc | HGVSp | HGVSp Short | SWISSPROT | BIOTYPE | SIFT | PolyPhen | Tumor Sample Barcode | Tissue | Histology | Sex | Age | Stage | Therapy Types | Drugs | Outcome |
| AKAP17A | SNV | Missense_Mutation | rs748366855 | c.953N>C | p.Arg318Thr | p.R318T | Q02040 | protein_coding | deleterious(0) | possibly_damaging(0.708) | TCGA-AC-A23H-01 | Breast | breast invasive carcinoma | Female | >=65 | I/II | Unknown | Unknown | PD |
| AKAP17A | SNV | Missense_Mutation | c.272C>G | p.Ser91Cys | p.S91C | Q02040 | protein_coding | tolerated(0.06) | possibly_damaging(0.753) | TCGA-AC-A2B8-01 | Breast | breast invasive carcinoma | Female | >=65 | I/II | Chemotherapy | chemo | PD | |
| AKAP17A | SNV | Missense_Mutation | novel | c.434N>A | p.Arg145Gln | p.R145Q | Q02040 | protein_coding | deleterious(0.03) | probably_damaging(0.921) | TCGA-AN-A0FW-01 | Breast | breast invasive carcinoma | Female | >=65 | III/IV | Unknown | Unknown | SD |
| AKAP17A | SNV | Missense_Mutation | rs762688186 | c.599C>T | p.Thr200Met | p.T200M | Q02040 | protein_coding | tolerated(0.1) | benign(0.312) | TCGA-E2-A159-01 | Breast | breast invasive carcinoma | Female | <65 | I/II | Chemotherapy | cyclophosphamide | SD |
| AKAP17A | SNV | Missense_Mutation | novel | c.1153N>A | p.Ala385Thr | p.A385T | Q02040 | protein_coding | tolerated(0.09) | benign(0.206) | TCGA-E9-A5FL-01 | Breast | breast invasive carcinoma | Female | >=65 | I/II | Unknown | Unknown | SD |
| AKAP17A | SNV | Missense_Mutation | novel | c.838G>A | p.Glu280Lys | p.E280K | Q02040 | protein_coding | tolerated(0.07) | possibly_damaging(0.702) | TCGA-PE-A5DE-01 | Breast | breast invasive carcinoma | Female | <65 | I/II | Chemotherapy | taxotere | CR |
| AKAP17A | SNV | Missense_Mutation | rs374350278 | c.1492N>C | p.Glu498Gln | p.E498Q | Q02040 | protein_coding | tolerated_low_confidence(0.07) | probably_damaging(0.972) | TCGA-C5-A1BJ-01 | Cervix | cervical & endocervical cancer | Female | <65 | I/II | Unknown | Unknown | SD |
| AKAP17A | SNV | Missense_Mutation | novel | c.872N>C | p.Arg291Thr | p.R291T | Q02040 | protein_coding | deleterious(0) | benign(0.083) | TCGA-HM-A4S6-01 | Cervix | cervical & endocervical cancer | Female | <65 | III/IV | Chemotherapy | cisplatin | CR |
| AKAP17A | SNV | Missense_Mutation | c.34G>C | p.Glu12Gln | p.E12Q | Q02040 | protein_coding | deleterious(0) | probably_damaging(0.964) | TCGA-IR-A3LH-01 | Cervix | cervical & endocervical cancer | Female | <65 | I/II | Chemotherapy | cisplatin | CR | |
| AKAP17A | insertion | Frame_Shift_Ins | novel | c.507_508insGAGGTGGGAGGTGCGAAAGA | p.Ser170GlufsTer37 | p.S170Efs*37 | Q02040 | protein_coding | TCGA-DS-A1OA-01 | Cervix | cervical & endocervical cancer | Female | >=65 | I/II | Chemotherapy | carboplatin | PD |
| Page: 1 2 3 4 5 6 7 8 9 |
Top |
Related drugs of malignant transformation related genes |
| Identification of chemicals and drugs interact with genes involved in malignant transfromation |
| (DGIdb 4.0) |
| Entrez ID | Symbol | Category | Interaction Types | Drug Claim Name | Drug Name | PMIDs |
| Page: 1 |

Copyright 2023-Present -The University of Texas Health Science Center at Houston |