| Tissue | Expression Dynamics | Abbreviation |
| Cervix |  | CC: Cervix cancer |
| HSIL_HPV: HPV-infected high-grade squamous intraepithelial lesions |
| N_HPV: HPV-infected normal cervix |
| Colorectum (GSE201348) |  | FAP: Familial adenomatous polyposis |
| CRC: Colorectal cancer |
| Colorectum (HTA11) |  | AD: Adenomas |
| SER: Sessile serrated lesions |
| MSI-H: Microsatellite-high colorectal cancer |
| MSS: Microsatellite stable colorectal cancer |
| Endometrium |  | AEH: Atypical endometrial hyperplasia |
| EEC: Endometrioid Cancer |
| Esophagus |  | ESCC: Esophageal squamous cell carcinoma |
| HGIN: High-grade intraepithelial neoplasias |
| LGIN: Low-grade intraepithelial neoplasias |
| GC |  | CAG: Chronic atrophic gastritis |
| CAG with IM: Chronic atrophic gastritis with intestinal metaplasia |
| CSG: Chronic superficial gastritis |
| GC: Gastric cancer |
| SIM: Severe intestinal metaplasia |
| WIM: Wild intestinal metaplasia |
| Liver |  | HCC: Hepatocellular carcinoma |
| NAFLD: Non-alcoholic fatty liver disease |
| Lung |  | AAH: Atypical adenomatous hyperplasia |
| AIS: Adenocarcinoma in situ |
| IAC: Invasive lung adenocarcinoma |
| MIA: Minimally invasive adenocarcinoma |
| Oral Cavity | 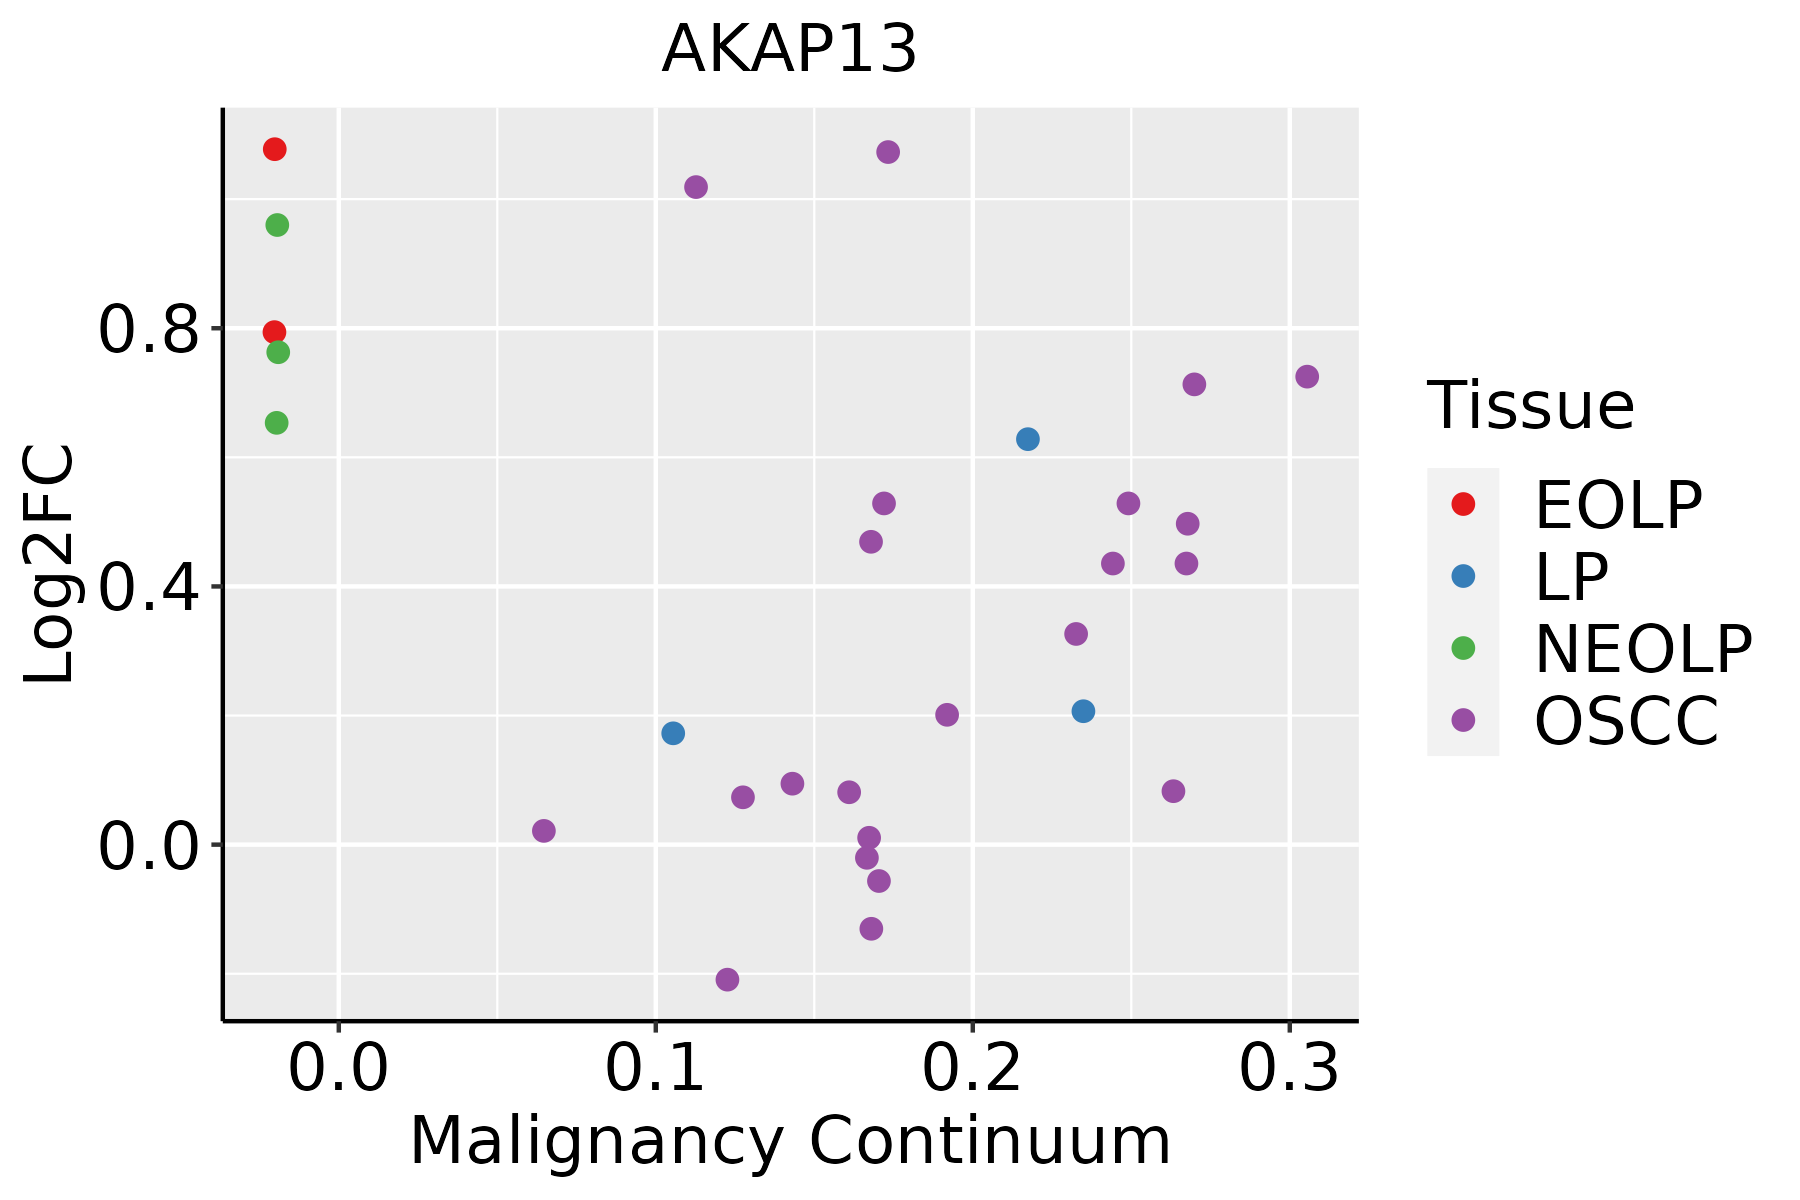 | EOLP: Erosive Oral lichen planus |
| LP: leukoplakia |
| NEOLP: Non-erosive oral lichen planus |
| OSCC: Oral squamous cell carcinoma |
| Prostate | 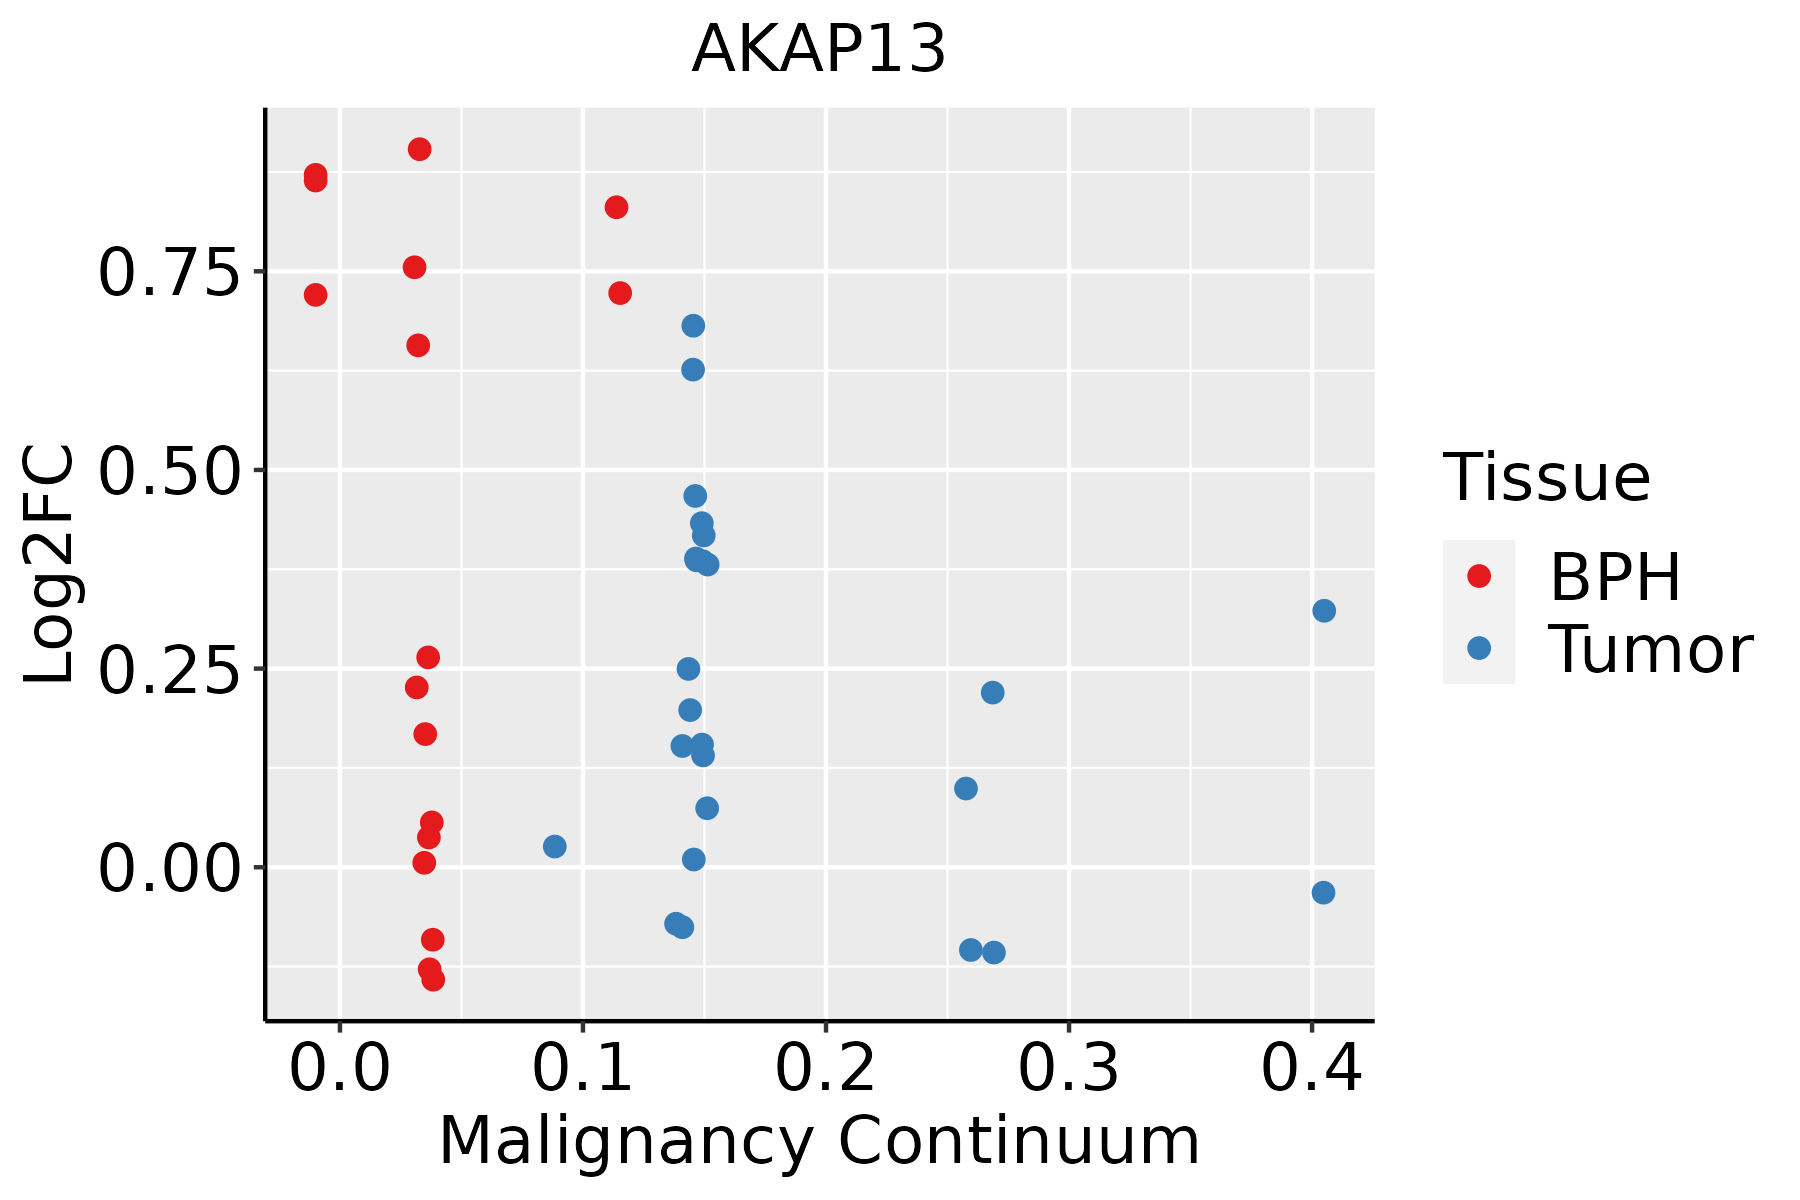 | BPH: Benign Prostatic Hyperplasia |
| Skin | 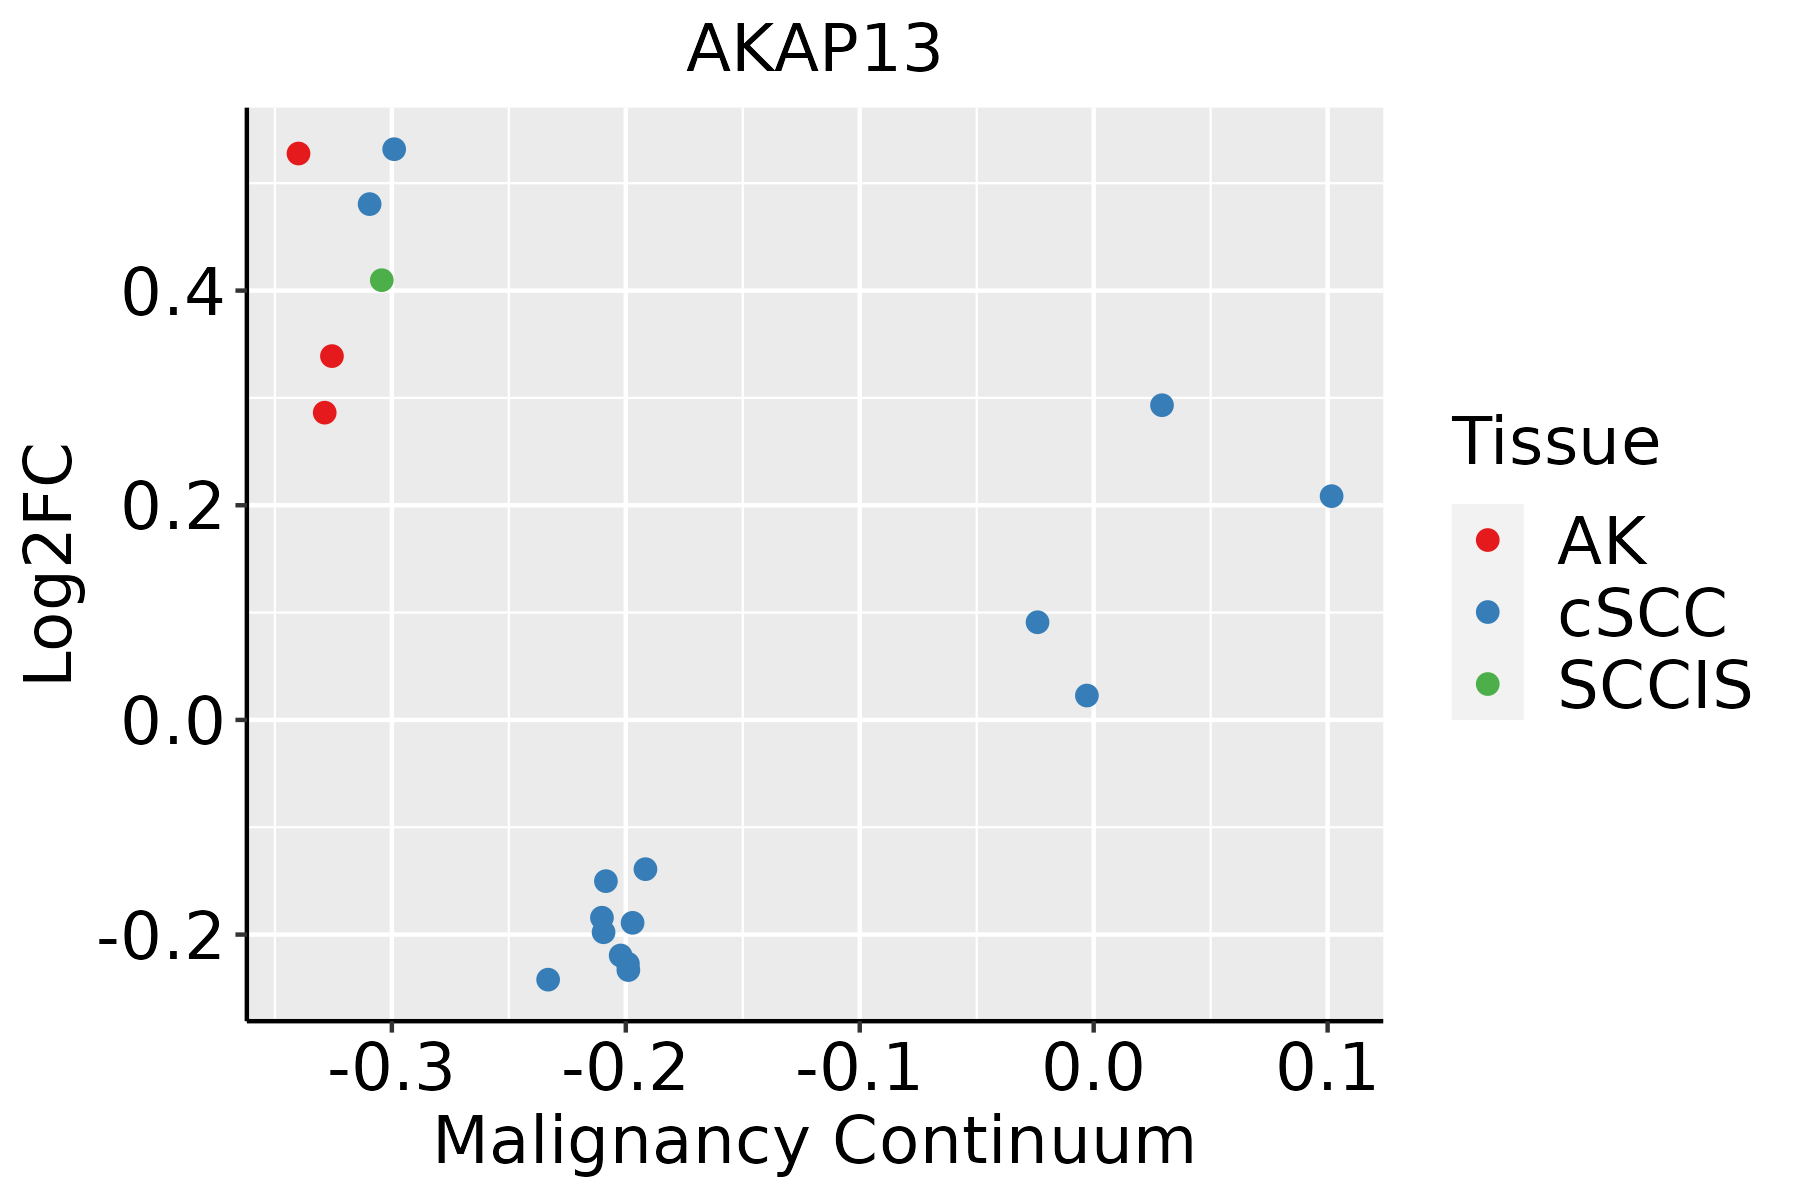 | AK: Actinic keratosis |
| cSCC: Cutaneous squamous cell carcinoma |
| SCCIS:squamous cell carcinoma in situ |
| Thyroid |  | ATC: Anaplastic thyroid cancer |
| HT: Hashimoto's thyroiditis |
| PTC: Papillary thyroid cancer |
| GO ID | Tissue | Disease Stage | Description | Gene Ratio | Bg Ratio | pvalue | p.adjust | Count |
| GO:003297010 | Cervix | CC | regulation of actin filament-based process | 96/2311 | 397/18723 | 4.00e-11 | 8.54e-09 | 96 |
| GO:190290310 | Cervix | CC | regulation of supramolecular fiber organization | 92/2311 | 383/18723 | 1.49e-10 | 2.48e-08 | 92 |
| GO:003295610 | Cervix | CC | regulation of actin cytoskeleton organization | 86/2311 | 358/18723 | 5.90e-10 | 7.51e-08 | 86 |
| GO:00510566 | Cervix | CC | regulation of small GTPase mediated signal transduction | 75/2311 | 302/18723 | 1.54e-09 | 1.74e-07 | 75 |
| GO:003367410 | Cervix | CC | positive regulation of kinase activity | 101/2311 | 467/18723 | 8.66e-09 | 7.22e-07 | 101 |
| GO:00072656 | Cervix | CC | Ras protein signal transduction | 79/2311 | 337/18723 | 9.49e-09 | 7.77e-07 | 79 |
| GO:00069139 | Cervix | CC | nucleocytoplasmic transport | 71/2311 | 301/18723 | 4.04e-08 | 2.54e-06 | 71 |
| GO:00511699 | Cervix | CC | nuclear transport | 71/2311 | 301/18723 | 4.04e-08 | 2.54e-06 | 71 |
| GO:00458608 | Cervix | CC | positive regulation of protein kinase activity | 85/2311 | 386/18723 | 5.61e-08 | 3.29e-06 | 85 |
| GO:00719007 | Cervix | CC | regulation of protein serine/threonine kinase activity | 75/2311 | 359/18723 | 2.76e-06 | 8.02e-05 | 75 |
| GO:00160498 | Cervix | CC | cell growth | 92/2311 | 482/18723 | 1.16e-05 | 2.49e-04 | 92 |
| GO:00072666 | Cervix | CC | Rho protein signal transduction | 35/2311 | 137/18723 | 1.77e-05 | 3.33e-04 | 35 |
| GO:00511689 | Cervix | CC | nuclear export | 38/2311 | 154/18723 | 1.86e-05 | 3.46e-04 | 38 |
| GO:00719025 | Cervix | CC | positive regulation of protein serine/threonine kinase activity | 46/2311 | 200/18723 | 1.87e-05 | 3.47e-04 | 46 |
| GO:00465785 | Cervix | CC | regulation of Ras protein signal transduction | 44/2311 | 189/18723 | 2.05e-05 | 3.73e-04 | 44 |
| GO:00434104 | Cervix | CC | positive regulation of MAPK cascade | 90/2311 | 480/18723 | 2.92e-05 | 4.83e-04 | 90 |
| GO:00431228 | Cervix | CC | regulation of I-kappaB kinase/NF-kappaB signaling | 53/2311 | 249/18723 | 4.50e-05 | 6.87e-04 | 53 |
| GO:011002010 | Cervix | CC | regulation of actomyosin structure organization | 27/2311 | 100/18723 | 5.55e-05 | 8.10e-04 | 27 |
| GO:00605375 | Cervix | CC | muscle tissue development | 76/2311 | 403/18723 | 9.76e-05 | 1.27e-03 | 76 |
| GO:00310329 | Cervix | CC | actomyosin structure organization | 43/2311 | 196/18723 | 1.11e-04 | 1.40e-03 | 43 |
| Pathway ID | Tissue | Disease Stage | Description | Gene Ratio | Bg Ratio | pvalue | p.adjust | qvalue | Count |
| hsa05163 | Colorectum | AD | Human cytomegalovirus infection | 75/2092 | 225/8465 | 2.00e-03 | 1.10e-02 | 7.01e-03 | 75 |
| hsa04928 | Colorectum | AD | Parathyroid hormone synthesis, secretion and action | 38/2092 | 106/8465 | 6.60e-03 | 2.77e-02 | 1.76e-02 | 38 |
| hsa051631 | Colorectum | AD | Human cytomegalovirus infection | 75/2092 | 225/8465 | 2.00e-03 | 1.10e-02 | 7.01e-03 | 75 |
| hsa049281 | Colorectum | AD | Parathyroid hormone synthesis, secretion and action | 38/2092 | 106/8465 | 6.60e-03 | 2.77e-02 | 1.76e-02 | 38 |
| hsa049282 | Colorectum | SER | Parathyroid hormone synthesis, secretion and action | 31/1580 | 106/8465 | 5.20e-03 | 3.28e-02 | 2.38e-02 | 31 |
| hsa051632 | Colorectum | SER | Human cytomegalovirus infection | 57/1580 | 225/8465 | 7.40e-03 | 3.84e-02 | 2.79e-02 | 57 |
| hsa049283 | Colorectum | SER | Parathyroid hormone synthesis, secretion and action | 31/1580 | 106/8465 | 5.20e-03 | 3.28e-02 | 2.38e-02 | 31 |
| hsa051633 | Colorectum | SER | Human cytomegalovirus infection | 57/1580 | 225/8465 | 7.40e-03 | 3.84e-02 | 2.79e-02 | 57 |
| hsa051634 | Colorectum | MSS | Human cytomegalovirus infection | 74/1875 | 225/8465 | 1.12e-04 | 1.01e-03 | 6.19e-04 | 74 |
| hsa049284 | Colorectum | MSS | Parathyroid hormone synthesis, secretion and action | 37/1875 | 106/8465 | 1.72e-03 | 9.13e-03 | 5.59e-03 | 37 |
| hsa051635 | Colorectum | MSS | Human cytomegalovirus infection | 74/1875 | 225/8465 | 1.12e-04 | 1.01e-03 | 6.19e-04 | 74 |
| hsa049285 | Colorectum | MSS | Parathyroid hormone synthesis, secretion and action | 37/1875 | 106/8465 | 1.72e-03 | 9.13e-03 | 5.59e-03 | 37 |
| hsa051636 | Colorectum | FAP | Human cytomegalovirus infection | 55/1404 | 225/8465 | 1.42e-03 | 7.67e-03 | 4.67e-03 | 55 |
| hsa049286 | Colorectum | FAP | Parathyroid hormone synthesis, secretion and action | 29/1404 | 106/8465 | 3.37e-03 | 1.44e-02 | 8.77e-03 | 29 |
| hsa051637 | Colorectum | FAP | Human cytomegalovirus infection | 55/1404 | 225/8465 | 1.42e-03 | 7.67e-03 | 4.67e-03 | 55 |
| hsa049287 | Colorectum | FAP | Parathyroid hormone synthesis, secretion and action | 29/1404 | 106/8465 | 3.37e-03 | 1.44e-02 | 8.77e-03 | 29 |
| hsa051638 | Colorectum | CRC | Human cytomegalovirus infection | 45/1091 | 225/8465 | 1.54e-03 | 1.17e-02 | 7.94e-03 | 45 |
| hsa049288 | Colorectum | CRC | Parathyroid hormone synthesis, secretion and action | 24/1091 | 106/8465 | 3.71e-03 | 2.29e-02 | 1.55e-02 | 24 |
| hsa051639 | Colorectum | CRC | Human cytomegalovirus infection | 45/1091 | 225/8465 | 1.54e-03 | 1.17e-02 | 7.94e-03 | 45 |
| hsa049289 | Colorectum | CRC | Parathyroid hormone synthesis, secretion and action | 24/1091 | 106/8465 | 3.71e-03 | 2.29e-02 | 1.55e-02 | 24 |
| Hugo Symbol | Variant Class | Variant Classification | dbSNP RS | HGVSc | HGVSp | HGVSp Short | SWISSPROT | BIOTYPE | SIFT | PolyPhen | Tumor Sample Barcode | Tissue | Histology | Sex | Age | Stage | Therapy Types | Drugs | Outcome |
| AKAP13 | SNV | Missense_Mutation | | c.5207N>T | p.Pro1736Leu | p.P1736L | Q12802 | protein_coding | deleterious(0.03) | benign(0.015) | TCGA-A2-A0CL-01 | Breast | breast invasive carcinoma | Female | <65 | III/IV | Chemotherapy | cytoxan | SD |
| AKAP13 | SNV | Missense_Mutation | | c.4555G>A | p.Glu1519Lys | p.E1519K | Q12802 | protein_coding | deleterious(0.01) | probably_damaging(0.994) | TCGA-A2-A0YD-01 | Breast | breast invasive carcinoma | Female | <65 | I/II | Chemotherapy | cytoxan | SD |
| AKAP13 | SNV | Missense_Mutation | | c.8128N>C | p.Glu2710Gln | p.E2710Q | Q12802 | protein_coding | tolerated(0.07) | possibly_damaging(0.892) | TCGA-A2-A3XY-01 | Breast | breast invasive carcinoma | Female | <65 | I/II | Chemotherapy | adriamycin | PD |
| AKAP13 | SNV | Missense_Mutation | novel | c.2128N>A | p.Glu710Lys | p.E710K | Q12802 | protein_coding | deleterious_low_confidence(0.01) | benign(0.003) | TCGA-A2-A4RW-01 | Breast | breast invasive carcinoma | Female | <65 | III/IV | Unknown | Unknown | SD |
| AKAP13 | SNV | Missense_Mutation | rs747774362 | c.2233G>T | p.Asp745Tyr | p.D745Y | Q12802 | protein_coding | deleterious_low_confidence(0) | possibly_damaging(0.875) | TCGA-AN-A046-01 | Breast | breast invasive carcinoma | Female | >=65 | I/II | Unknown | Unknown | SD |
| AKAP13 | SNV | Missense_Mutation | novel | c.3318G>T | p.Glu1106Asp | p.E1106D | Q12802 | protein_coding | deleterious_low_confidence(0.01) | benign(0.007) | TCGA-AN-A046-01 | Breast | breast invasive carcinoma | Female | >=65 | I/II | Unknown | Unknown | SD |
| AKAP13 | SNV | Missense_Mutation | rs768166553 | c.1220G>A | p.Cys407Tyr | p.C407Y | Q12802 | protein_coding | deleterious(0.02) | benign(0.003) | TCGA-AN-A0FX-01 | Breast | breast invasive carcinoma | Female | <65 | I/II | Unknown | Unknown | SD |
| AKAP13 | SNV | Missense_Mutation | | c.1078G>A | p.Val360Ile | p.V360I | Q12802 | protein_coding | tolerated(0.42) | benign(0.003) | TCGA-AO-A0JD-01 | Breast | breast invasive carcinoma | Female | <65 | III/IV | Chemotherapy | cyclophosphamide | SD |
| AKAP13 | SNV | Missense_Mutation | rs748198504 | c.2512N>T | p.Arg838Trp | p.R838W | Q12802 | protein_coding | deleterious_low_confidence(0.02) | benign(0.01) | TCGA-B6-A0IK-01 | Breast | breast invasive carcinoma | Female | <65 | III/IV | Unknown | Unknown | PD |
| AKAP13 | SNV | Missense_Mutation | novel | c.1228A>C | p.Lys410Gln | p.K410Q | Q12802 | protein_coding | deleterious(0.02) | benign(0.332) | TCGA-E2-A15M-01 | Breast | breast invasive carcinoma | Female | >=65 | I/II | Hormone Therapy | arimidex | SD |


