
|
|||||
|
 | |
| |
| |
| |
| |
| |
|
Gene: AKAP11 |
Gene summary for AKAP11 |
| Gene information | Species | Human | Gene symbol | AKAP11 | Gene ID | 11215 |
| Gene name | A-kinase anchoring protein 11 | |
| Gene Alias | AKAP-11 | |
| Cytomap | 13q14.11 | |
| Gene Type | protein-coding | GO ID | GO:0003008 | UniProtAcc | Q9UKA4 |
Top |
Malignant transformation analysis |
| Identification of the aberrant gene expression in precancerous and cancerous lesions by comparing the gene expression of stem-like cells in diseased tissues with normal stem cells |
| Entrez ID | Symbol | Replicates | Species | Organ | Tissue | Adj P-value | Log2FC | Malignancy |
| 11215 | AKAP11 | HCC1_Meng | Human | Liver | HCC | 4.53e-51 | 2.93e-02 | 0.0246 |
| 11215 | AKAP11 | HCC2_Meng | Human | Liver | HCC | 7.46e-25 | 2.05e-01 | 0.0107 |
| 11215 | AKAP11 | HCC1 | Human | Liver | HCC | 2.18e-06 | 4.20e+00 | 0.5336 |
| 11215 | AKAP11 | HCC2 | Human | Liver | HCC | 1.74e-09 | 4.09e+00 | 0.5341 |
| 11215 | AKAP11 | S028 | Human | Liver | HCC | 1.81e-09 | 4.87e-01 | 0.2503 |
| 11215 | AKAP11 | S029 | Human | Liver | HCC | 9.88e-03 | 3.58e-01 | 0.2581 |
| 11215 | AKAP11 | Dong_P1 | Human | Prostate | Tumor | 1.12e-08 | 6.22e-02 | 0.035 |
| 11215 | AKAP11 | Dong_P3 | Human | Prostate | Tumor | 2.20e-11 | 1.44e-01 | 0.0278 |
| 11215 | AKAP11 | GSM5353215_PA_AUG_PB_1B_S2 | Human | Prostate | Tumor | 4.82e-02 | 5.35e-01 | 0.1557 |
| 11215 | AKAP11 | GSM5353216_PA_PB1A_Pool_1_3_S50_L002 | Human | Prostate | Tumor | 1.53e-04 | 6.82e-01 | 0.159 |
| 11215 | AKAP11 | GSM5353221_PA_PB2A_Pool_1_3_S25_L001 | Human | Prostate | Tumor | 8.91e-11 | 5.24e-01 | 0.1633 |
| 11215 | AKAP11 | GSM5353222_PA_PB2B_Pool_1_3_S52_L002 | Human | Prostate | Tumor | 4.61e-08 | 4.25e-01 | 0.1608 |
| 11215 | AKAP11 | GSM5353223_PA_PB2B_Pool_2_S26_L001 | Human | Prostate | Tumor | 7.65e-07 | 4.23e-01 | 0.1604 |
| 11215 | AKAP11 | GSM5353224_PA_PR5186_Pool_1_2_3_S27_L001 | Human | Prostate | Tumor | 4.64e-02 | 2.23e-01 | 0.1621 |
| 11215 | AKAP11 | GSM5353227_PA_PR5199-193K_Pool_1_2_3_S55_L002 | Human | Prostate | Tumor | 3.13e-03 | 3.56e-01 | 0.1602 |
| 11215 | AKAP11 | GSM5353244_PA_PR5261_T2_S24_L002 | Human | Prostate | Tumor | 2.18e-02 | 3.09e-01 | 0.1569 |
| 11215 | AKAP11 | male-WTA | Human | Thyroid | PTC | 6.70e-32 | 2.42e-01 | 0.1037 |
| 11215 | AKAP11 | PTC01 | Human | Thyroid | PTC | 1.64e-09 | 1.09e-01 | 0.1899 |
| 11215 | AKAP11 | PTC03 | Human | Thyroid | PTC | 5.71e-04 | 1.73e-01 | 0.1784 |
| 11215 | AKAP11 | PTC04 | Human | Thyroid | PTC | 2.05e-09 | 2.17e-01 | 0.1927 |
| Page: 1 2 |
| Tissue | Expression Dynamics | Abbreviation |
| Liver |  | HCC: Hepatocellular carcinoma |
| NAFLD: Non-alcoholic fatty liver disease | ||
| Prostate | 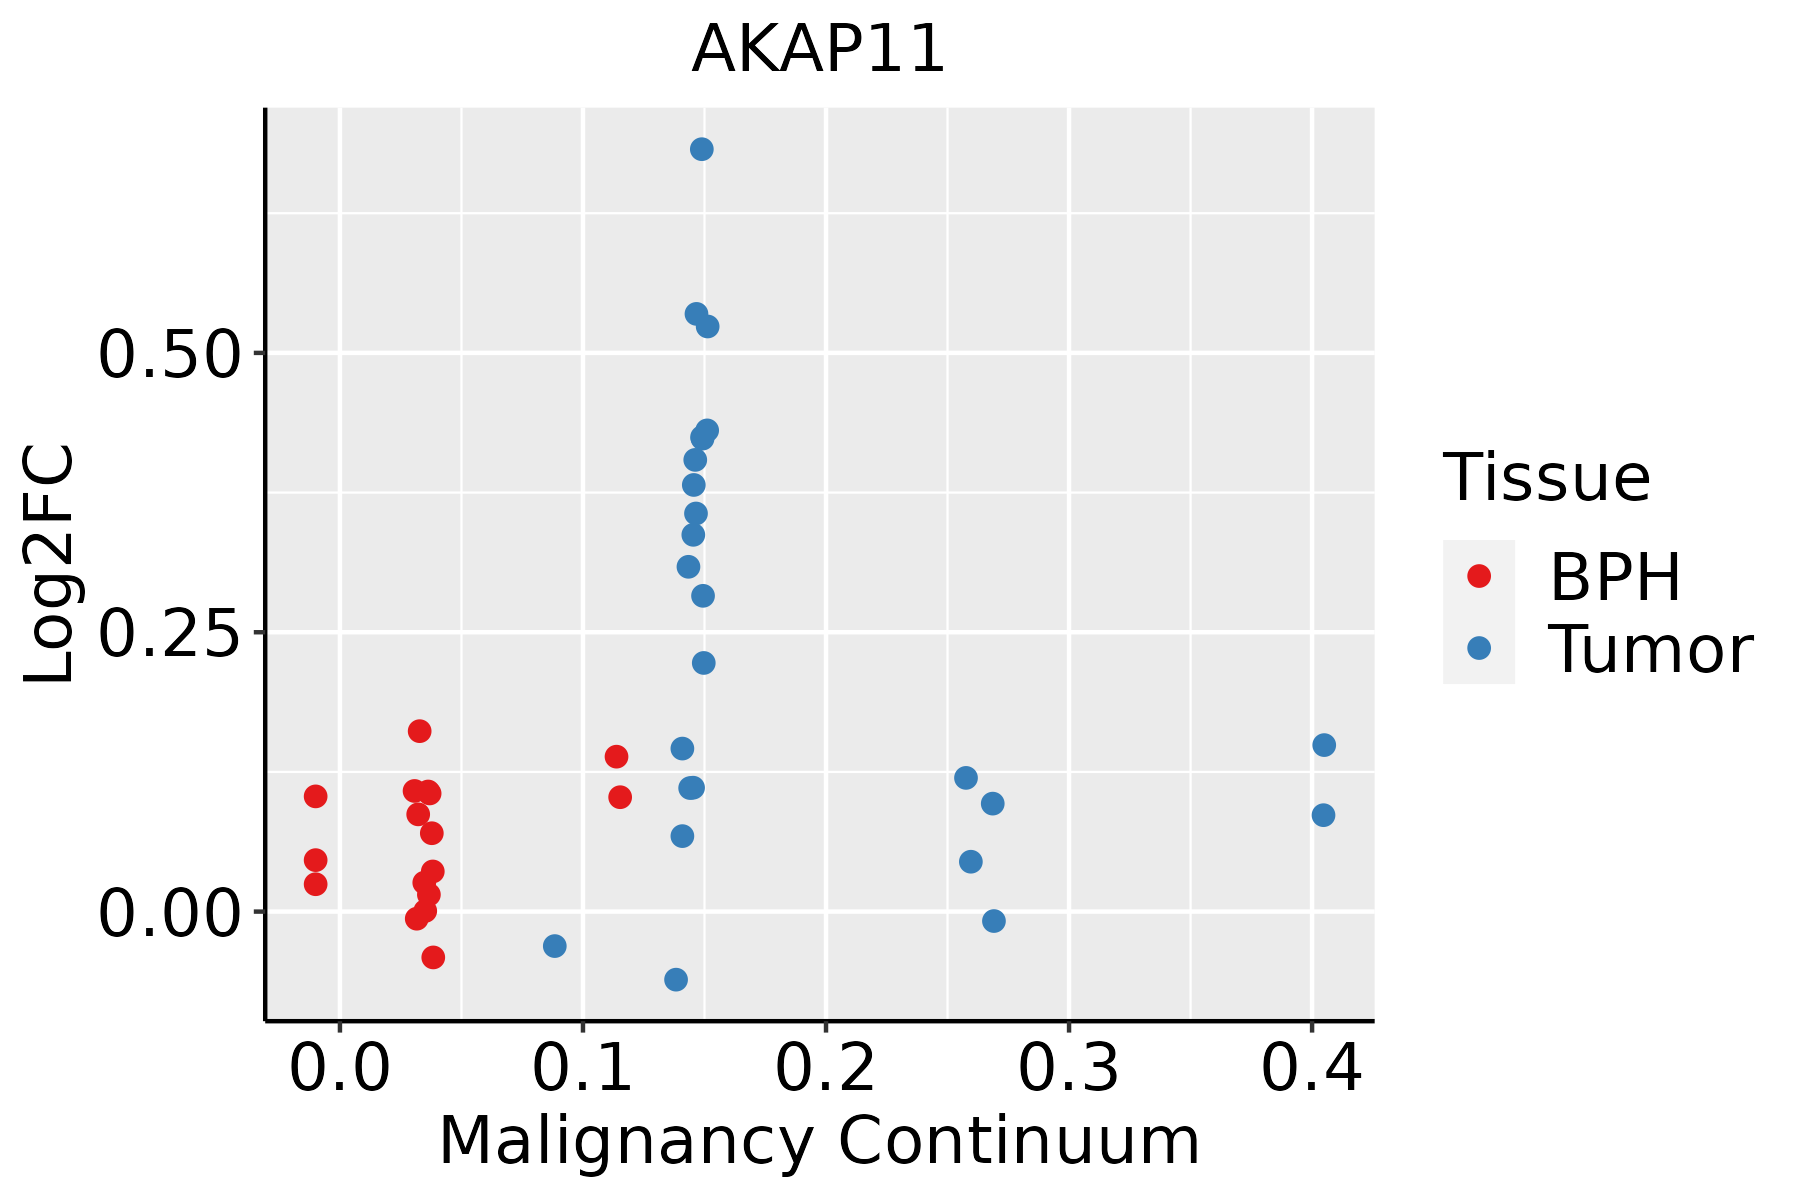 | BPH: Benign Prostatic Hyperplasia |
| Thyroid | 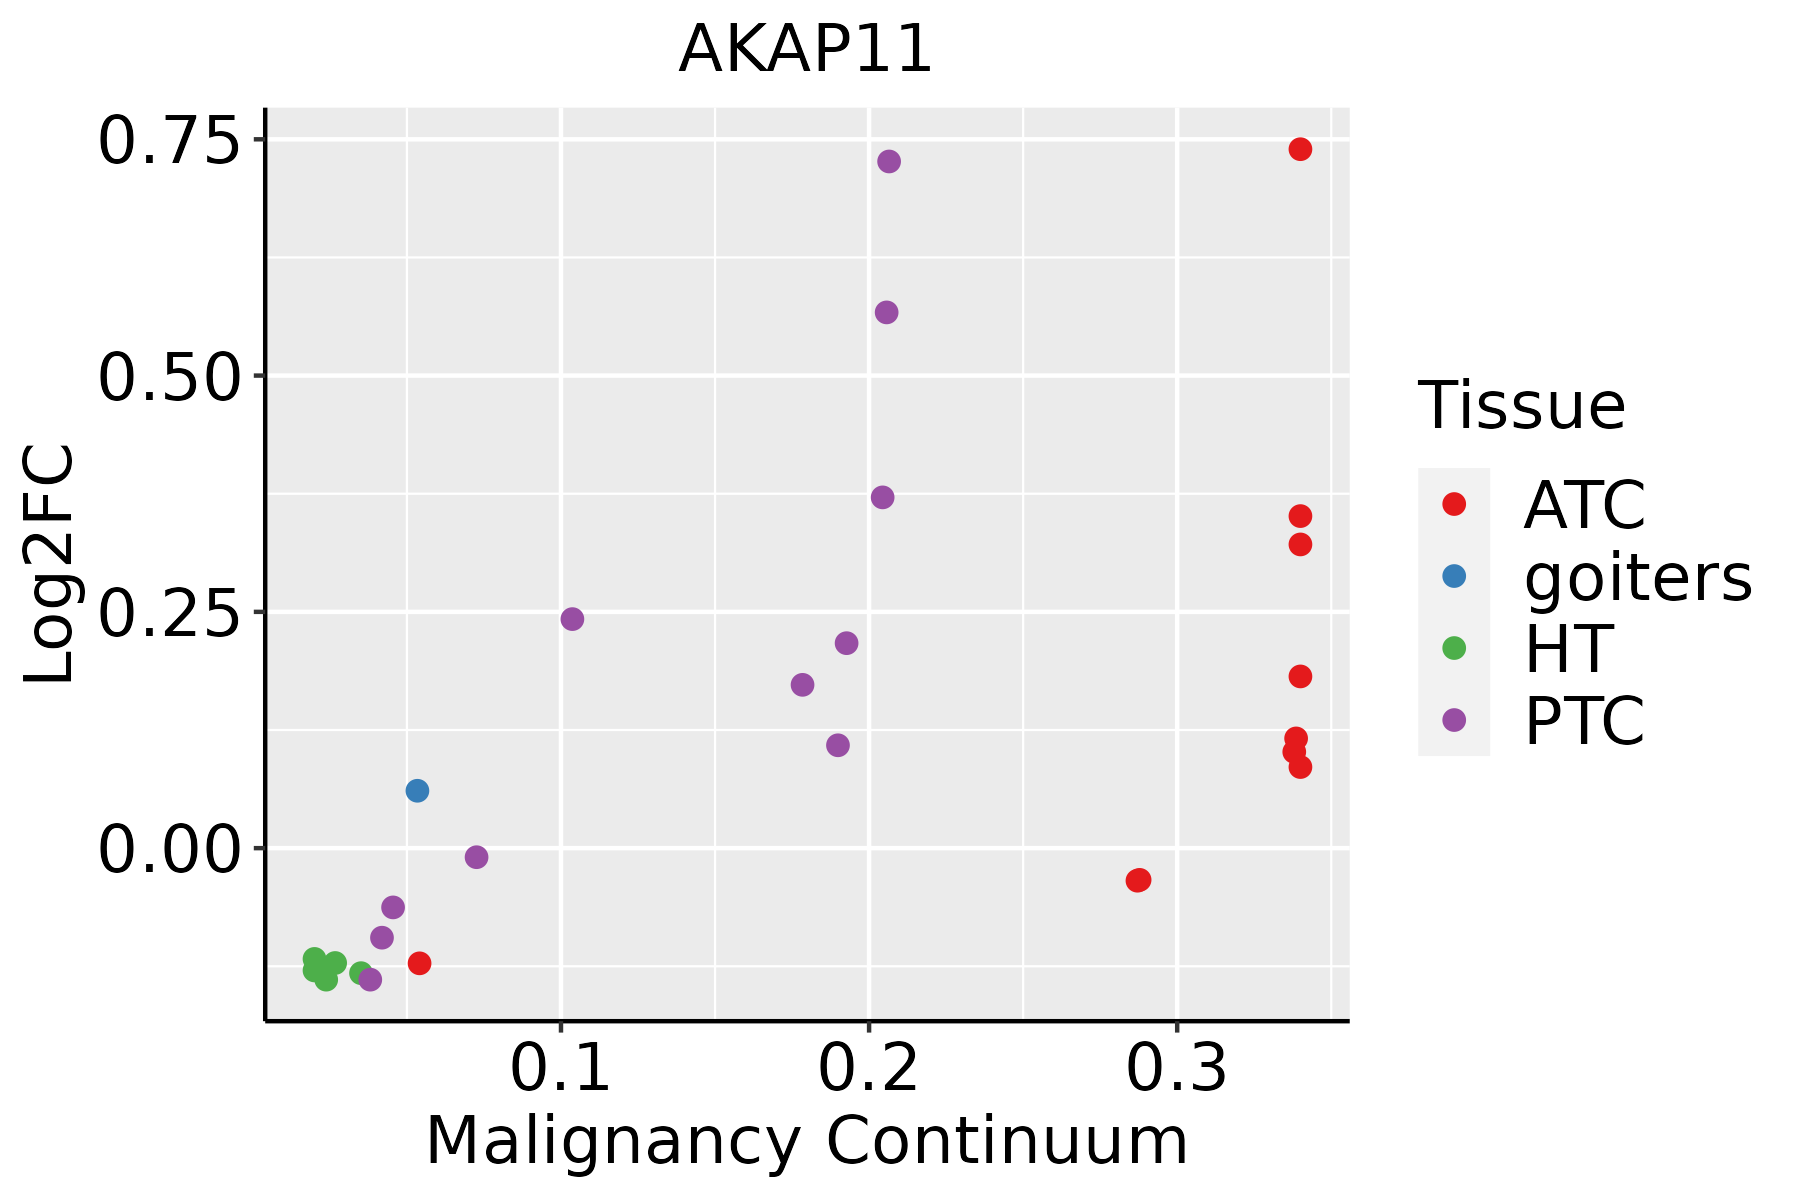 | ATC: Anaplastic thyroid cancer |
| HT: Hashimoto's thyroiditis | ||
| PTC: Papillary thyroid cancer |
| ∗log2FC in expression of this searched gene in stem-like cells from each diseased tissue sample relative to stem-like cells in normal samples in each tissue plotted against the malignancy continuum. Samples are colored based on if they are from different disease stage. |
Top |
Malignant transformation related pathway analysis |
| Find out the enriched GO biological processes and KEGG pathways involved in transition from healthy to precancer to cancer |
| Tissue | Disease Stage | Enriched GO biological Processes |
| Colorectum | AD |  |
| Colorectum | SER |  |
| Colorectum | MSS |  |
| Colorectum | MSI-H |  |
| Colorectum | FAP |  |
| ∗Top 15 enriched GO BP terms are showed in the bar plot of each disease state in each tissue. Each row represents a significant GO biological process which is colored according to the -log10(p.adjust). |
| Page: 1 2 3 4 5 6 7 8 9 |
| GO ID | Tissue | Disease Stage | Description | Gene Ratio | Bg Ratio | pvalue | p.adjust | Count |
| GO:003086512 | Liver | HCC | cortical cytoskeleton organization | 47/7958 | 61/18723 | 4.03e-08 | 8.69e-07 | 47 |
| GO:003086612 | Liver | HCC | cortical actin cytoskeleton organization | 30/7958 | 40/18723 | 3.04e-05 | 3.12e-04 | 30 |
| GO:00360103 | Liver | HCC | protein localization to endosome | 19/7958 | 24/18723 | 2.80e-04 | 2.02e-03 | 19 |
| GO:005087822 | Liver | HCC | regulation of body fluid levels | 191/7958 | 379/18723 | 1.06e-03 | 6.11e-03 | 191 |
| GO:003086515 | Prostate | Tumor | cortical cytoskeleton organization | 24/3246 | 61/18723 | 3.91e-05 | 4.52e-04 | 24 |
| GO:005087818 | Prostate | Tumor | regulation of body fluid levels | 91/3246 | 379/18723 | 5.37e-04 | 3.91e-03 | 91 |
| GO:003086613 | Prostate | Tumor | cortical actin cytoskeleton organization | 15/3246 | 40/18723 | 1.91e-03 | 1.11e-02 | 15 |
| GO:003601011 | Prostate | Tumor | protein localization to endosome | 10/3246 | 24/18723 | 4.46e-03 | 2.20e-02 | 10 |
| GO:0030865110 | Thyroid | PTC | cortical cytoskeleton organization | 38/5968 | 61/18723 | 9.77e-07 | 1.46e-05 | 38 |
| GO:003086616 | Thyroid | PTC | cortical actin cytoskeleton organization | 25/5968 | 40/18723 | 6.51e-05 | 5.72e-04 | 25 |
| GO:003086523 | Thyroid | ATC | cortical cytoskeleton organization | 41/6293 | 61/18723 | 8.28e-08 | 1.43e-06 | 41 |
| GO:003086617 | Thyroid | ATC | cortical actin cytoskeleton organization | 28/6293 | 40/18723 | 2.77e-06 | 3.19e-05 | 28 |
| GO:0050878112 | Thyroid | ATC | regulation of body fluid levels | 149/6293 | 379/18723 | 1.08e-02 | 3.90e-02 | 149 |
| Page: 1 |
| Pathway ID | Tissue | Disease Stage | Description | Gene Ratio | Bg Ratio | pvalue | p.adjust | qvalue | Count |
| Page: 1 |
Top |
Cell-cell communication analysis |
| Identification of potential cell-cell interactions between two cell types and their ligand-receptor pairs for different disease states |
| Ligand | Receptor | LRpair | Pathway | Tissue | Disease Stage |
| Page: 1 |
Top |
Single-cell gene regulatory network inference analysis |
| Find out the significant the regulons (TFs) and the target genes of each regulon across cell types for different disease states |
| TF | Cell Type | Tissue | Disease Stage | Target Gene | RSS | Regulon Activity |
| ∗The dot plots of a searched regulon are shown for all cell subpopulations in each disease state of each tissue based on the regulon specific score inferred using pySCENIC and by calculating the average expression. |
| Page: 1 |
Top |
Somatic mutation of malignant transformation related genes |
| Annotation of somatic variants for genes involved in malignant transformation |
| Hugo Symbol | Variant Class | Variant Classification | dbSNP RS | HGVSc | HGVSp | HGVSp Short | SWISSPROT | BIOTYPE | SIFT | PolyPhen | Tumor Sample Barcode | Tissue | Histology | Sex | Age | Stage | Therapy Types | Drugs | Outcome |
| AKAP11 | SNV | Missense_Mutation | c.2686N>A | p.Val896Ile | p.V896I | Q9UKA4 | protein_coding | tolerated(0.13) | benign(0.007) | TCGA-A2-A0CQ-01 | Breast | breast invasive carcinoma | Female | <65 | I/II | Chemotherapy | adriamycin | SD | |
| AKAP11 | SNV | Missense_Mutation | novel | c.4930C>G | p.Leu1644Val | p.L1644V | Q9UKA4 | protein_coding | tolerated(0.31) | benign(0.116) | TCGA-A2-A0YK-01 | Breast | breast invasive carcinoma | Female | <65 | I/II | Chemotherapy | cytoxan | SD |
| AKAP11 | SNV | Missense_Mutation | c.659N>T | p.Ser220Phe | p.S220F | Q9UKA4 | protein_coding | deleterious(0.01) | probably_damaging(0.919) | TCGA-AC-A23H-01 | Breast | breast invasive carcinoma | Female | >=65 | I/II | Unknown | Unknown | PD | |
| AKAP11 | SNV | Missense_Mutation | c.2377N>A | p.His793Asn | p.H793N | Q9UKA4 | protein_coding | deleterious(0.04) | benign(0.003) | TCGA-AC-A23H-01 | Breast | breast invasive carcinoma | Female | >=65 | I/II | Unknown | Unknown | PD | |
| AKAP11 | SNV | Missense_Mutation | c.2704N>A | p.Glu902Lys | p.E902K | Q9UKA4 | protein_coding | tolerated(0.1) | benign(0.007) | TCGA-AC-A23H-01 | Breast | breast invasive carcinoma | Female | >=65 | I/II | Unknown | Unknown | PD | |
| AKAP11 | SNV | Missense_Mutation | rs146952263 | c.3527N>A | p.Ser1176Asn | p.S1176N | Q9UKA4 | protein_coding | tolerated(0.1) | benign(0.063) | TCGA-AN-A0FN-01 | Breast | breast invasive carcinoma | Female | <65 | I/II | Unknown | Unknown | SD |
| AKAP11 | SNV | Missense_Mutation | c.3640N>A | p.Ala1214Thr | p.A1214T | Q9UKA4 | protein_coding | deleterious(0.03) | possibly_damaging(0.808) | TCGA-B6-A0X1-01 | Breast | breast invasive carcinoma | Female | <65 | I/II | Unknown | Unknown | PD | |
| AKAP11 | SNV | Missense_Mutation | novel | c.788C>T | p.Ser263Phe | p.S263F | Q9UKA4 | protein_coding | deleterious(0.04) | possibly_damaging(0.874) | TCGA-BH-A0B6-01 | Breast | breast invasive carcinoma | Female | <65 | I/II | Unknown | Unknown | SD |
| AKAP11 | SNV | Missense_Mutation | c.223N>A | p.Ala75Thr | p.A75T | Q9UKA4 | protein_coding | tolerated(0.12) | possibly_damaging(0.791) | TCGA-BH-A0HF-01 | Breast | breast invasive carcinoma | Female | >=65 | I/II | Hormone Therapy | arimidex | SD | |
| AKAP11 | SNV | Missense_Mutation | novel | c.1972G>T | p.Gly658Cys | p.G658C | Q9UKA4 | protein_coding | deleterious(0) | probably_damaging(1) | TCGA-C8-A8HR-01 | Breast | breast invasive carcinoma | Female | <65 | III/IV | Chemotherapy | 5-fluorouracil | CR |
| Page: 1 2 3 4 5 6 7 8 9 10 11 12 13 14 15 16 17 18 19 20 |
Top |
Related drugs of malignant transformation related genes |
| Identification of chemicals and drugs interact with genes involved in malignant transfromation |
| (DGIdb 4.0) |
| Entrez ID | Symbol | Category | Interaction Types | Drug Claim Name | Drug Name | PMIDs |
| Page: 1 |

Copyright 2023-Present -The University of Texas Health Science Center at Houston |