
|
|||||
|
 | |
| |
| |
| |
| |
| |
|
Gene: AKAP1 |
Gene summary for AKAP1 |
| Gene information | Species | Human | Gene symbol | AKAP1 | Gene ID | 8165 |
| Gene name | A-kinase anchoring protein 1 | |
| Gene Alias | AKAP | |
| Cytomap | 17q22 | |
| Gene Type | protein-coding | GO ID | GO:0002376 | UniProtAcc | A0A140VK05 |
Top |
Malignant transformation analysis |
| Identification of the aberrant gene expression in precancerous and cancerous lesions by comparing the gene expression of stem-like cells in diseased tissues with normal stem cells |
| Entrez ID | Symbol | Replicates | Species | Organ | Tissue | Adj P-value | Log2FC | Malignancy |
| 8165 | AKAP1 | HTA11_3410_2000001011 | Human | Colorectum | AD | 1.46e-02 | -9.81e-03 | 0.0155 |
| 8165 | AKAP1 | HTA11_1938_2000001011 | Human | Colorectum | AD | 4.26e-06 | 5.18e-01 | -0.0811 |
| 8165 | AKAP1 | HTA11_78_2000001011 | Human | Colorectum | AD | 2.48e-05 | 4.43e-01 | -0.1088 |
| 8165 | AKAP1 | HTA11_347_2000001011 | Human | Colorectum | AD | 5.77e-28 | 8.23e-01 | -0.1954 |
| 8165 | AKAP1 | HTA11_83_2000001011 | Human | Colorectum | SER | 1.02e-06 | 6.00e-01 | -0.1526 |
| 8165 | AKAP1 | HTA11_696_2000001011 | Human | Colorectum | AD | 6.73e-03 | 2.66e-01 | -0.1464 |
| 8165 | AKAP1 | HTA11_866_2000001011 | Human | Colorectum | AD | 5.43e-05 | 3.13e-01 | -0.1001 |
| 8165 | AKAP1 | HTA11_1391_2000001011 | Human | Colorectum | AD | 8.72e-09 | 6.63e-01 | -0.059 |
| 8165 | AKAP1 | HTA11_866_3004761011 | Human | Colorectum | AD | 5.29e-03 | 3.73e-01 | 0.096 |
| 8165 | AKAP1 | HTA11_7663_2000001011 | Human | Colorectum | SER | 5.37e-03 | 6.07e-01 | 0.0131 |
| 8165 | AKAP1 | HTA11_7696_3000711011 | Human | Colorectum | AD | 8.94e-07 | 3.81e-01 | 0.0674 |
| 8165 | AKAP1 | HTA11_99999970781_79442 | Human | Colorectum | MSS | 9.99e-06 | 4.55e-01 | 0.294 |
| 8165 | AKAP1 | HTA11_99999965104_69814 | Human | Colorectum | MSS | 4.15e-13 | 8.57e-01 | 0.281 |
| 8165 | AKAP1 | HTA11_99999971662_82457 | Human | Colorectum | MSS | 5.13e-19 | 9.74e-01 | 0.3859 |
| 8165 | AKAP1 | HTA11_99999974143_84620 | Human | Colorectum | MSS | 3.68e-09 | 5.62e-01 | 0.3005 |
| 8165 | AKAP1 | A002-C-010 | Human | Colorectum | FAP | 2.11e-06 | -2.84e-01 | 0.242 |
| 8165 | AKAP1 | A015-C-203 | Human | Colorectum | FAP | 3.48e-20 | 6.68e-02 | -0.1294 |
| 8165 | AKAP1 | A015-C-204 | Human | Colorectum | FAP | 3.44e-03 | 2.45e-01 | -0.0228 |
| 8165 | AKAP1 | A002-C-201 | Human | Colorectum | FAP | 1.19e-05 | 3.77e-02 | 0.0324 |
| 8165 | AKAP1 | A001-C-119 | Human | Colorectum | FAP | 4.38e-03 | -4.29e-01 | -0.1557 |
| Page: 1 2 3 4 5 6 7 8 |
| Tissue | Expression Dynamics | Abbreviation |
| Colorectum (GSE201348) |  | FAP: Familial adenomatous polyposis |
| CRC: Colorectal cancer | ||
| Colorectum (HTA11) |  | AD: Adenomas |
| SER: Sessile serrated lesions | ||
| MSI-H: Microsatellite-high colorectal cancer | ||
| MSS: Microsatellite stable colorectal cancer | ||
| Esophagus | 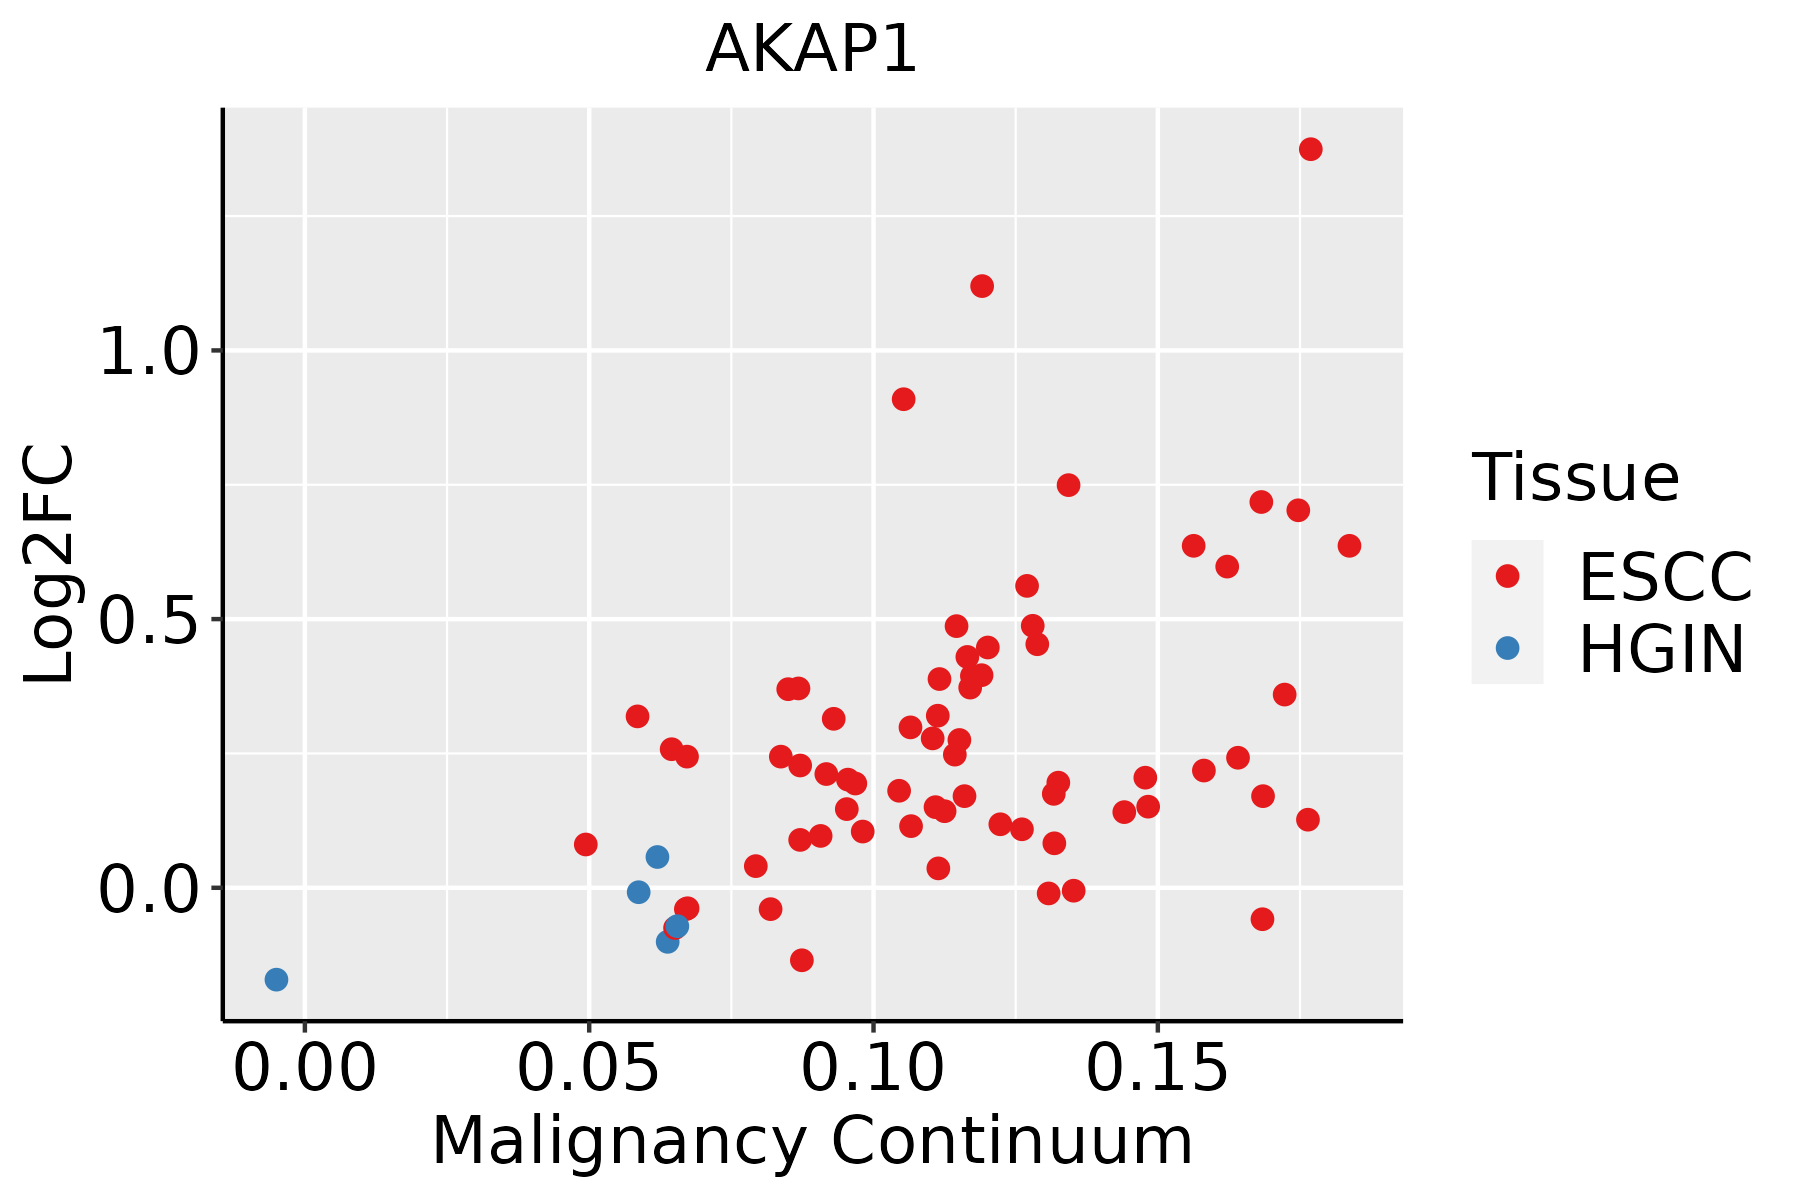 | ESCC: Esophageal squamous cell carcinoma |
| HGIN: High-grade intraepithelial neoplasias | ||
| LGIN: Low-grade intraepithelial neoplasias | ||
| Liver | 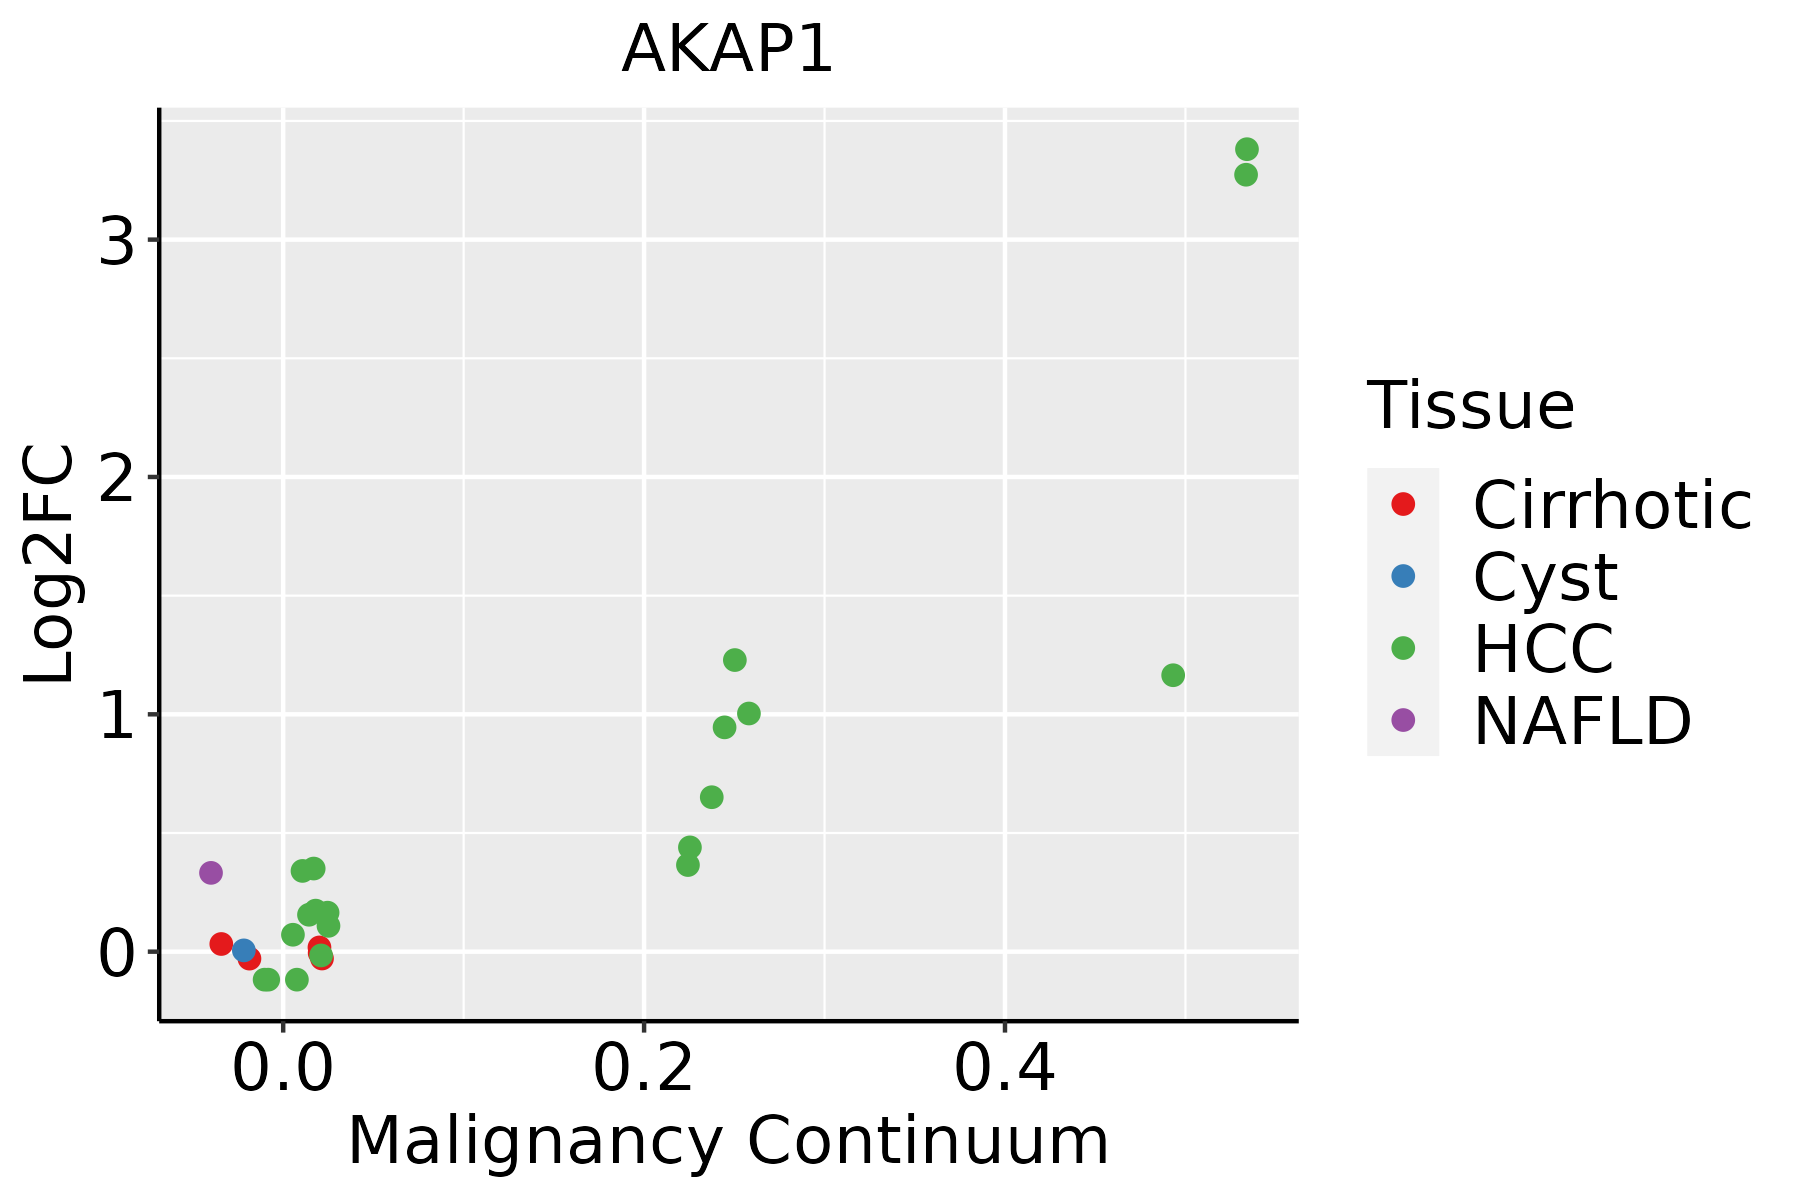 | HCC: Hepatocellular carcinoma |
| NAFLD: Non-alcoholic fatty liver disease | ||
| Oral Cavity | 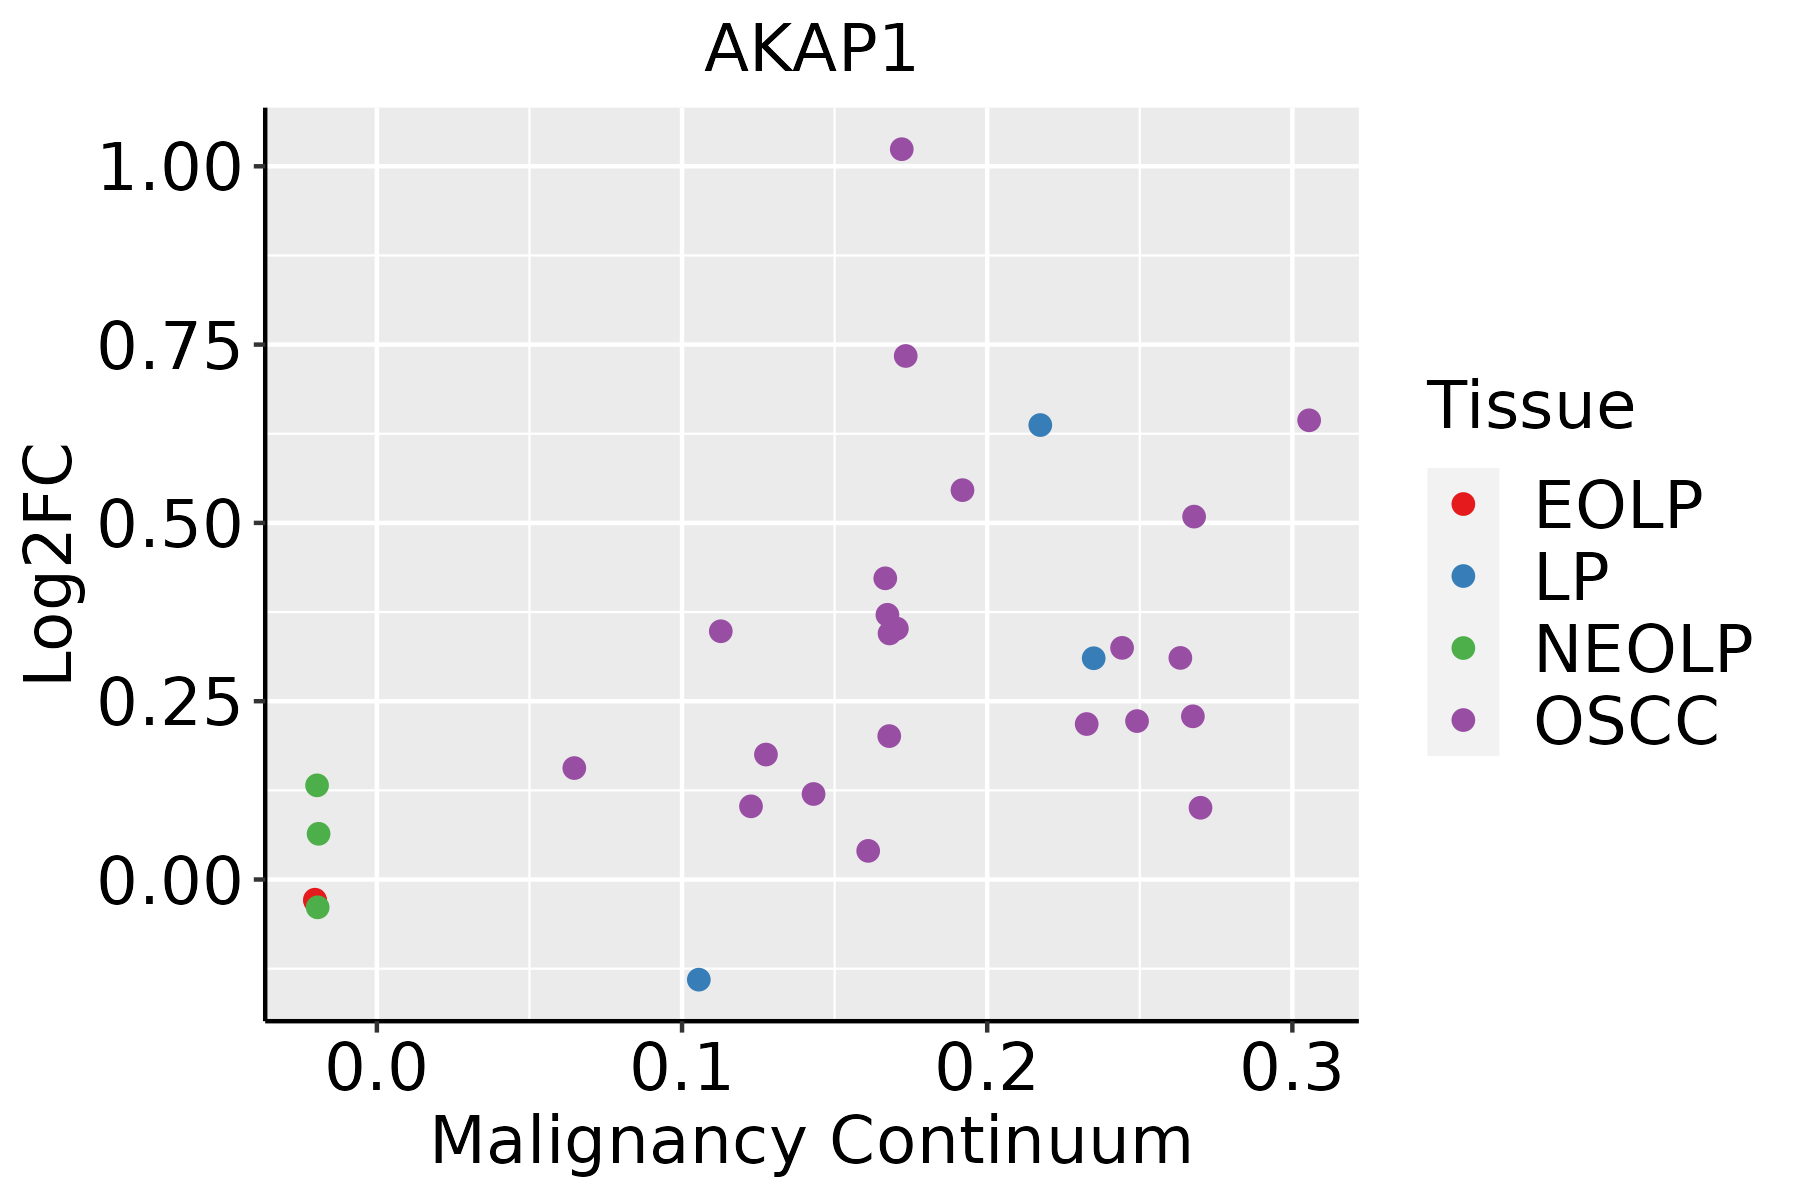 | EOLP: Erosive Oral lichen planus |
| LP: leukoplakia | ||
| NEOLP: Non-erosive oral lichen planus | ||
| OSCC: Oral squamous cell carcinoma | ||
| Prostate | 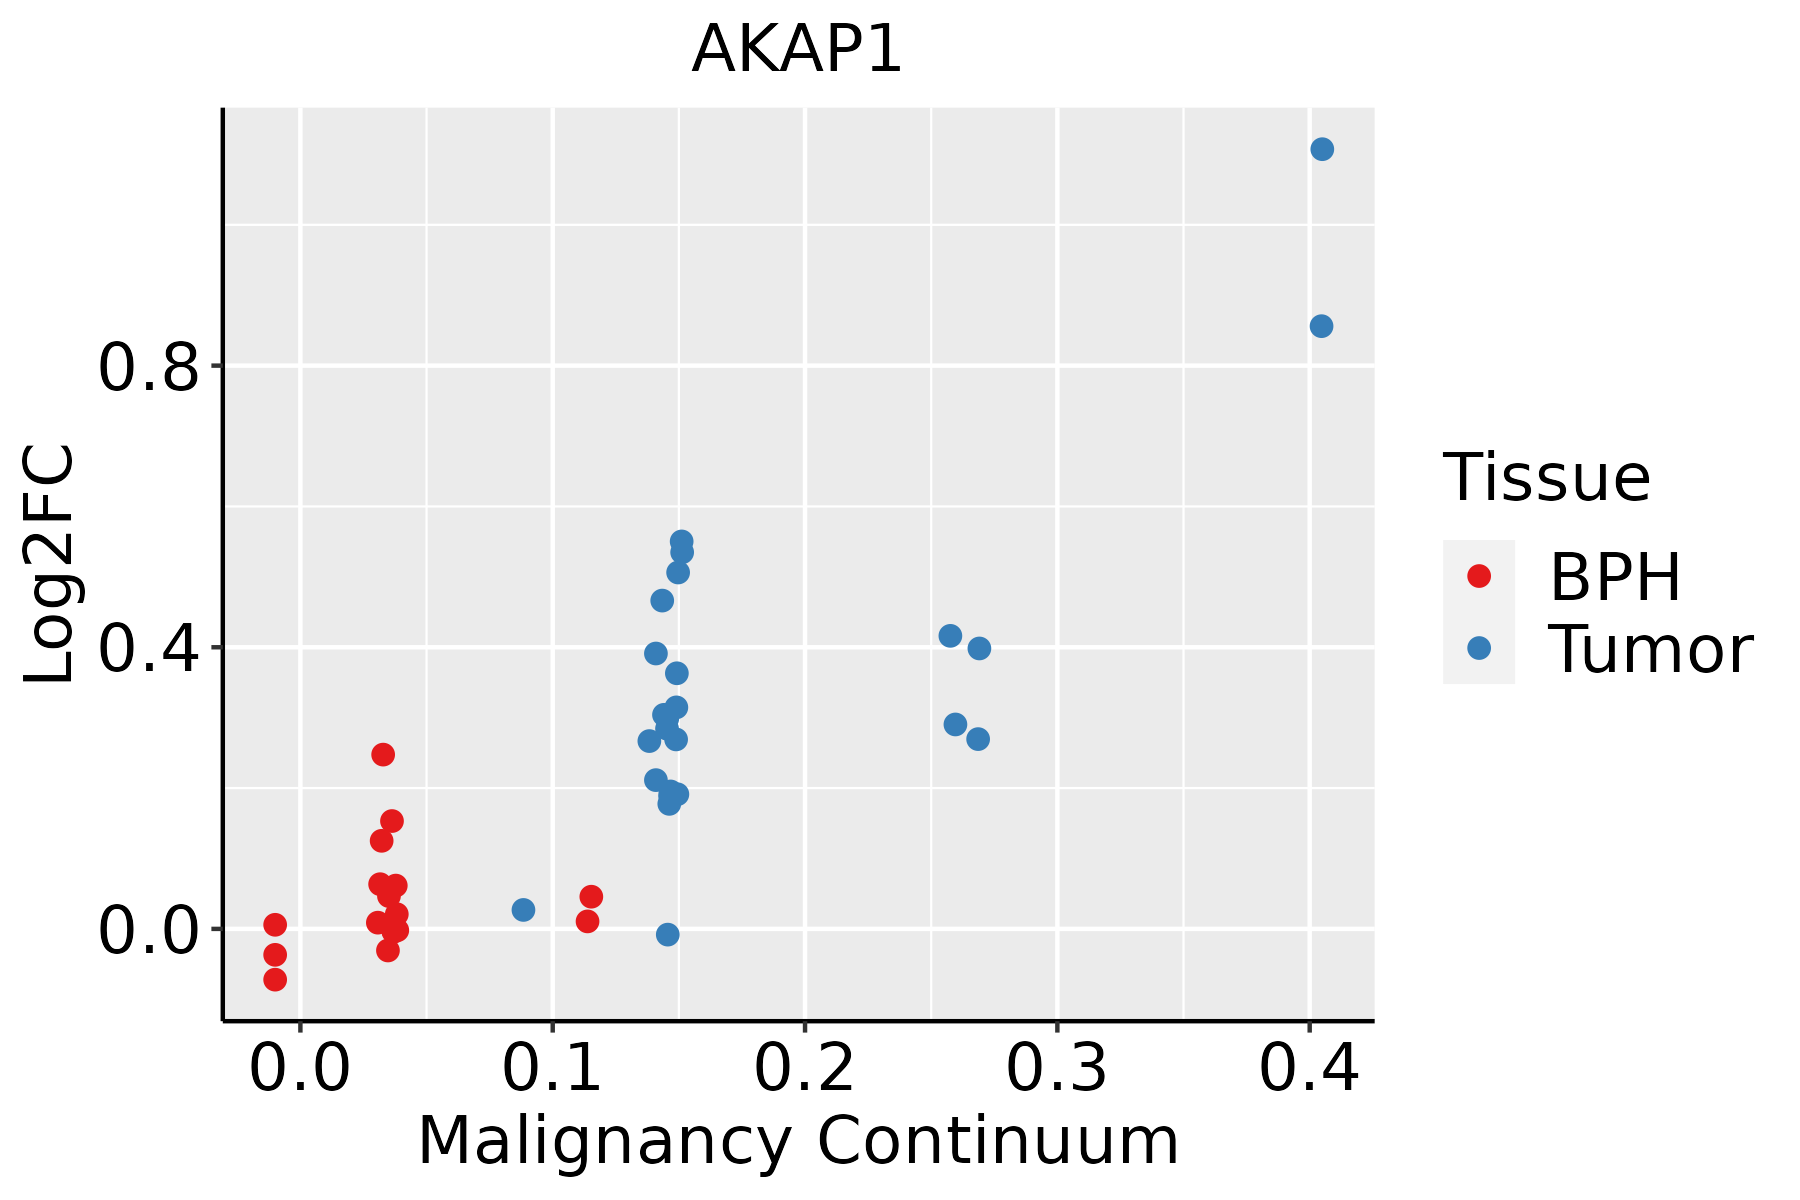 | BPH: Benign Prostatic Hyperplasia |
| Skin | 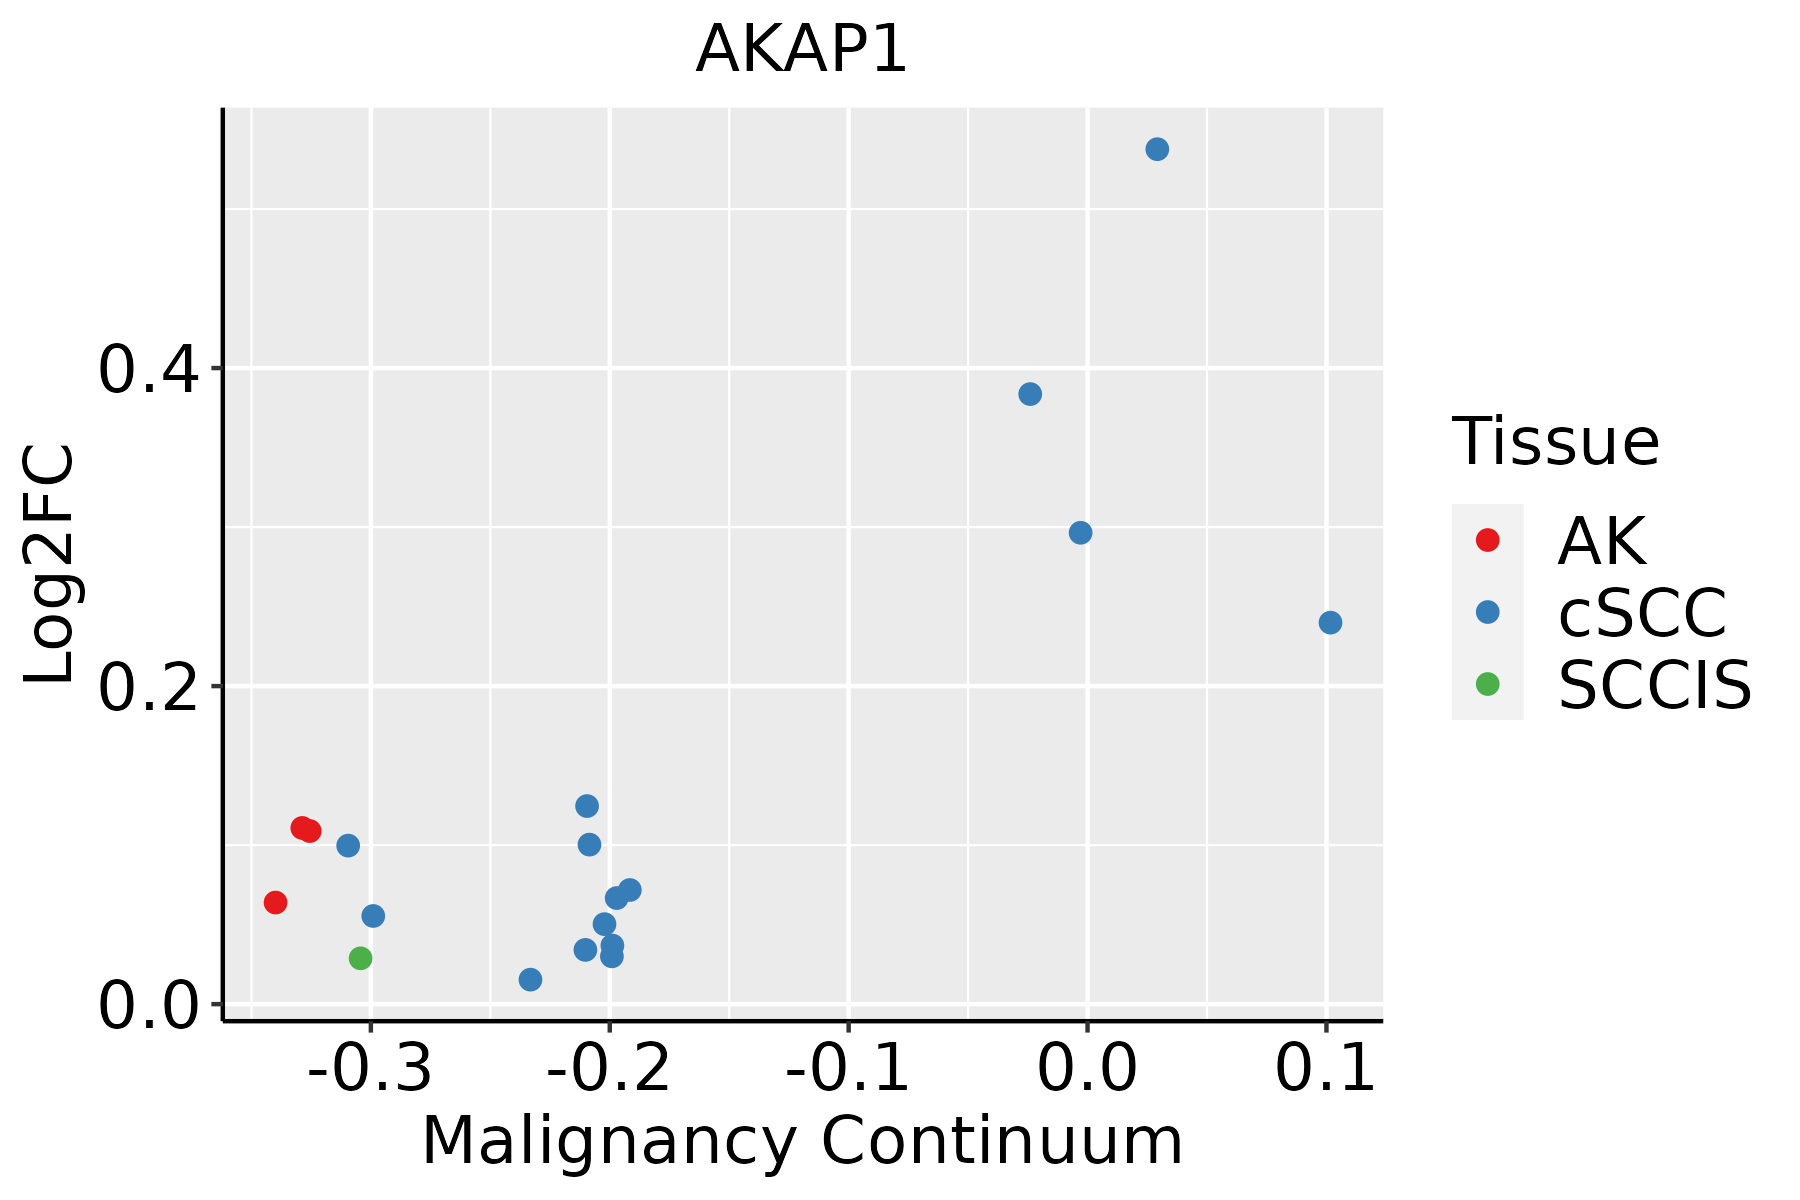 | AK: Actinic keratosis |
| cSCC: Cutaneous squamous cell carcinoma | ||
| SCCIS:squamous cell carcinoma in situ | ||
| Thyroid | 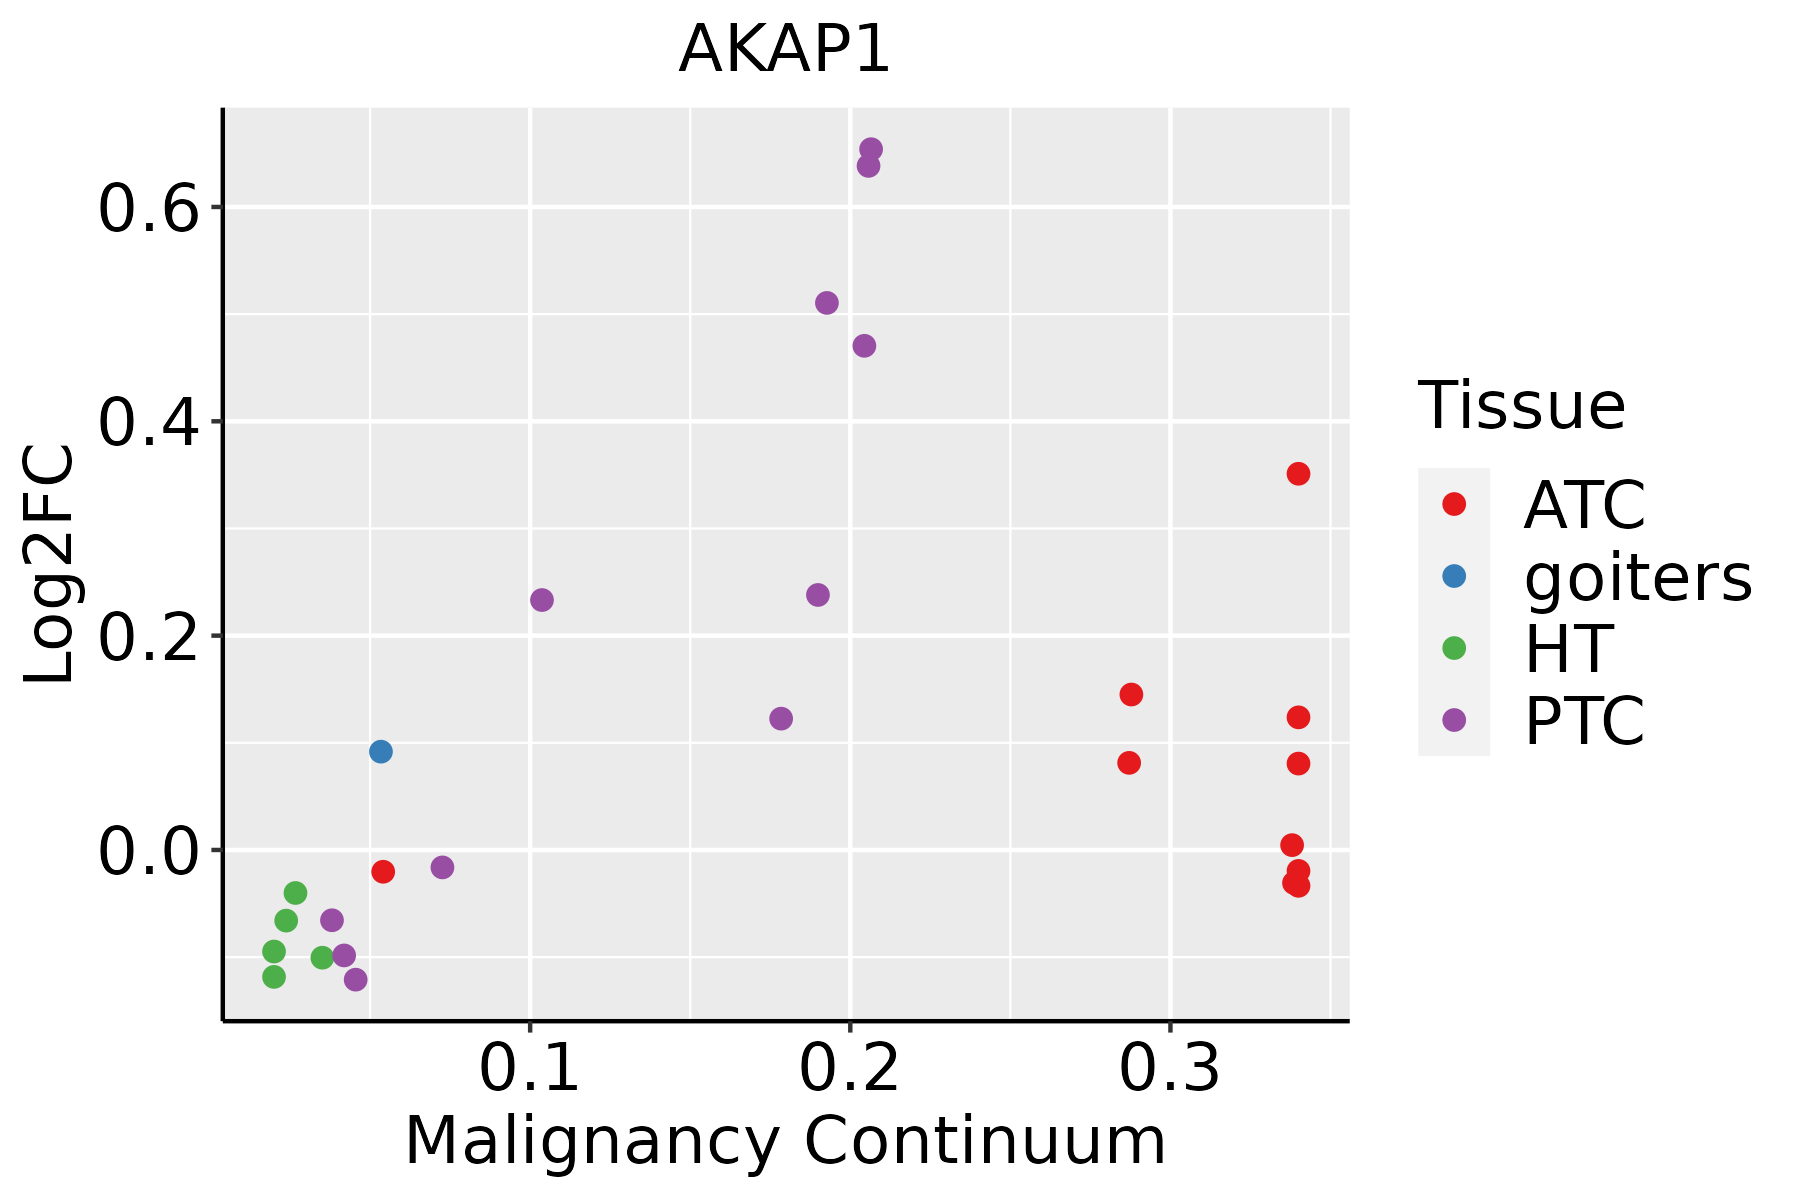 | ATC: Anaplastic thyroid cancer |
| HT: Hashimoto's thyroiditis | ||
| PTC: Papillary thyroid cancer |
| ∗log2FC in expression of this searched gene in stem-like cells from each diseased tissue sample relative to stem-like cells in normal samples in each tissue plotted against the malignancy continuum. Samples are colored based on if they are from different disease stage. |
Top |
Malignant transformation related pathway analysis |
| Find out the enriched GO biological processes and KEGG pathways involved in transition from healthy to precancer to cancer |
| Tissue | Disease Stage | Enriched GO biological Processes |
| Colorectum | AD |  |
| Colorectum | SER |  |
| Colorectum | MSS |  |
| Colorectum | MSI-H |  |
| Colorectum | FAP |  |
| ∗Top 15 enriched GO BP terms are showed in the bar plot of each disease state in each tissue. Each row represents a significant GO biological process which is colored according to the -log10(p.adjust). |
| Page: 1 2 3 4 5 6 7 8 9 |
| GO ID | Tissue | Disease Stage | Description | Gene Ratio | Bg Ratio | pvalue | p.adjust | Count |
| GO:003297010 | Cervix | CC | regulation of actin filament-based process | 96/2311 | 397/18723 | 4.00e-11 | 8.54e-09 | 96 |
| GO:190290310 | Cervix | CC | regulation of supramolecular fiber organization | 92/2311 | 383/18723 | 1.49e-10 | 2.48e-08 | 92 |
| GO:003295610 | Cervix | CC | regulation of actin cytoskeleton organization | 86/2311 | 358/18723 | 5.90e-10 | 7.51e-08 | 86 |
| GO:00510566 | Cervix | CC | regulation of small GTPase mediated signal transduction | 75/2311 | 302/18723 | 1.54e-09 | 1.74e-07 | 75 |
| GO:003367410 | Cervix | CC | positive regulation of kinase activity | 101/2311 | 467/18723 | 8.66e-09 | 7.22e-07 | 101 |
| GO:00072656 | Cervix | CC | Ras protein signal transduction | 79/2311 | 337/18723 | 9.49e-09 | 7.77e-07 | 79 |
| GO:00069139 | Cervix | CC | nucleocytoplasmic transport | 71/2311 | 301/18723 | 4.04e-08 | 2.54e-06 | 71 |
| GO:00511699 | Cervix | CC | nuclear transport | 71/2311 | 301/18723 | 4.04e-08 | 2.54e-06 | 71 |
| GO:00458608 | Cervix | CC | positive regulation of protein kinase activity | 85/2311 | 386/18723 | 5.61e-08 | 3.29e-06 | 85 |
| GO:00719007 | Cervix | CC | regulation of protein serine/threonine kinase activity | 75/2311 | 359/18723 | 2.76e-06 | 8.02e-05 | 75 |
| GO:00160498 | Cervix | CC | cell growth | 92/2311 | 482/18723 | 1.16e-05 | 2.49e-04 | 92 |
| GO:00072666 | Cervix | CC | Rho protein signal transduction | 35/2311 | 137/18723 | 1.77e-05 | 3.33e-04 | 35 |
| GO:00511689 | Cervix | CC | nuclear export | 38/2311 | 154/18723 | 1.86e-05 | 3.46e-04 | 38 |
| GO:00719025 | Cervix | CC | positive regulation of protein serine/threonine kinase activity | 46/2311 | 200/18723 | 1.87e-05 | 3.47e-04 | 46 |
| GO:00465785 | Cervix | CC | regulation of Ras protein signal transduction | 44/2311 | 189/18723 | 2.05e-05 | 3.73e-04 | 44 |
| GO:00434104 | Cervix | CC | positive regulation of MAPK cascade | 90/2311 | 480/18723 | 2.92e-05 | 4.83e-04 | 90 |
| GO:00431228 | Cervix | CC | regulation of I-kappaB kinase/NF-kappaB signaling | 53/2311 | 249/18723 | 4.50e-05 | 6.87e-04 | 53 |
| GO:011002010 | Cervix | CC | regulation of actomyosin structure organization | 27/2311 | 100/18723 | 5.55e-05 | 8.10e-04 | 27 |
| GO:00605375 | Cervix | CC | muscle tissue development | 76/2311 | 403/18723 | 9.76e-05 | 1.27e-03 | 76 |
| GO:00310329 | Cervix | CC | actomyosin structure organization | 43/2311 | 196/18723 | 1.11e-04 | 1.40e-03 | 43 |
| Page: 1 2 3 4 5 6 7 8 9 10 11 12 13 14 15 16 17 18 19 20 21 22 23 24 25 26 27 28 29 30 31 32 33 34 35 36 37 38 39 40 41 42 43 44 45 |
| Pathway ID | Tissue | Disease Stage | Description | Gene Ratio | Bg Ratio | pvalue | p.adjust | qvalue | Count |
| Page: 1 |
Top |
Cell-cell communication analysis |
| Identification of potential cell-cell interactions between two cell types and their ligand-receptor pairs for different disease states |
| Ligand | Receptor | LRpair | Pathway | Tissue | Disease Stage |
| Page: 1 |
Top |
Single-cell gene regulatory network inference analysis |
| Find out the significant the regulons (TFs) and the target genes of each regulon across cell types for different disease states |
| TF | Cell Type | Tissue | Disease Stage | Target Gene | RSS | Regulon Activity |
| ∗The dot plots of a searched regulon are shown for all cell subpopulations in each disease state of each tissue based on the regulon specific score inferred using pySCENIC and by calculating the average expression. |
| Page: 1 |
Top |
Somatic mutation of malignant transformation related genes |
| Annotation of somatic variants for genes involved in malignant transformation |
| Hugo Symbol | Variant Class | Variant Classification | dbSNP RS | HGVSc | HGVSp | HGVSp Short | SWISSPROT | BIOTYPE | SIFT | PolyPhen | Tumor Sample Barcode | Tissue | Histology | Sex | Age | Stage | Therapy Types | Drugs | Outcome |
| AKAP1 | SNV | Missense_Mutation | c.2345N>A | p.Ser782Tyr | p.S782Y | Q92667 | protein_coding | tolerated(0.71) | benign(0.007) | TCGA-AC-A23H-01 | Breast | breast invasive carcinoma | Female | >=65 | I/II | Unknown | Unknown | PD | |
| AKAP1 | SNV | Missense_Mutation | c.790N>C | p.Ala264Pro | p.A264P | Q92667 | protein_coding | tolerated(0.32) | benign(0.361) | TCGA-C8-A12U-01 | Breast | breast invasive carcinoma | Female | <65 | I/II | Unknown | Unknown | SD | |
| AKAP1 | SNV | Missense_Mutation | rs144078543 | c.2285N>T | p.Thr762Met | p.T762M | Q92667 | protein_coding | deleterious(0.03) | benign(0.115) | TCGA-C8-A12U-01 | Breast | breast invasive carcinoma | Female | <65 | I/II | Unknown | Unknown | SD |
| AKAP1 | SNV | Missense_Mutation | c.961G>C | p.Glu321Gln | p.E321Q | Q92667 | protein_coding | tolerated(0.55) | benign(0.006) | TCGA-C8-A275-01 | Breast | breast invasive carcinoma | Female | <65 | I/II | Unknown | Unknown | SD | |
| AKAP1 | insertion | Nonsense_Mutation | novel | c.951_952insACTGAGAACAGGGCAGGTGAAGTGCAGGGAGCCTAGT | p.Asp318ThrfsTer12 | p.D318Tfs*12 | Q92667 | protein_coding | TCGA-A2-A0CU-01 | Breast | breast invasive carcinoma | Female | >=65 | I/II | Hormone Therapy | tamoxiphen | SD | ||
| AKAP1 | insertion | Frame_Shift_Ins | novel | c.1327_1328insT | p.Ser444ValfsTer8 | p.S444Vfs*8 | Q92667 | protein_coding | TCGA-A8-A06P-01 | Breast | breast invasive carcinoma | Female | <65 | III/IV | Unspecific | SD | |||
| AKAP1 | insertion | Frame_Shift_Ins | novel | c.1325_1326insACTTGGCAAC | p.Ser444GlyfsTer11 | p.S444Gfs*11 | Q92667 | protein_coding | TCGA-AN-A03X-01 | Breast | breast invasive carcinoma | Female | >=65 | I/II | Unknown | Unknown | SD | ||
| AKAP1 | insertion | In_Frame_Ins | novel | c.1862_1863insCAACATGGAATTCCTCCA | p.Arg621_Leu622insAsnMetGluPheLeuGln | p.R621_L622insNMEFLQ | Q92667 | protein_coding | TCGA-B6-A0IA-01 | Breast | breast invasive carcinoma | Female | <65 | I/II | Unknown | Unknown | SD | ||
| AKAP1 | SNV | Missense_Mutation | rs764500302 | c.1481N>A | p.Ser494Asn | p.S494N | Q92667 | protein_coding | tolerated(0.72) | benign(0) | TCGA-2W-A8YY-01 | Cervix | cervical & endocervical cancer | Female | <65 | I/II | Chemotherapy | cisplatin | CR |
| AKAP1 | SNV | Missense_Mutation | c.502N>C | p.Asp168His | p.D168H | Q92667 | protein_coding | deleterious(0.01) | benign(0.186) | TCGA-C5-A1MK-01 | Cervix | cervical & endocervical cancer | Female | >=65 | III/IV | Chemotherapy | carboplatin | PD |
| Page: 1 2 3 4 5 6 7 8 |
Top |
Related drugs of malignant transformation related genes |
| Identification of chemicals and drugs interact with genes involved in malignant transfromation |
| (DGIdb 4.0) |
| Entrez ID | Symbol | Category | Interaction Types | Drug Claim Name | Drug Name | PMIDs |
| Page: 1 |

Copyright 2023-Present -The University of Texas Health Science Center at Houston |