
|
|||||
|
 | |
| |
| |
| |
| |
| |
|
Gene: AK6 |
Gene summary for AK6 |
| Gene information | Species | Human | Gene symbol | AK6 | Gene ID | 102157402 |
| Gene name | adenylate kinase 6 | |
| Gene Alias | AD-004 | |
| Cytomap | 5q13.2 | |
| Gene Type | protein-coding | GO ID | GO:0006139 | UniProtAcc | Q9Y3D8 |
Top |
Malignant transformation analysis |
| Identification of the aberrant gene expression in precancerous and cancerous lesions by comparing the gene expression of stem-like cells in diseased tissues with normal stem cells |
| Entrez ID | Symbol | Replicates | Species | Organ | Tissue | Adj P-value | Log2FC | Malignancy |
| 102157402 | AK6 | LZE4T | Human | Esophagus | ESCC | 1.44e-02 | 2.47e-02 | 0.0811 |
| 102157402 | AK6 | LZE24T | Human | Esophagus | ESCC | 8.19e-08 | 2.74e-01 | 0.0596 |
| 102157402 | AK6 | P2T-E | Human | Esophagus | ESCC | 1.81e-21 | 4.55e-01 | 0.1177 |
| 102157402 | AK6 | P4T-E | Human | Esophagus | ESCC | 1.29e-22 | 4.83e-01 | 0.1323 |
| 102157402 | AK6 | P5T-E | Human | Esophagus | ESCC | 5.19e-22 | 4.09e-01 | 0.1327 |
| 102157402 | AK6 | P8T-E | Human | Esophagus | ESCC | 1.63e-14 | 1.70e-01 | 0.0889 |
| 102157402 | AK6 | P9T-E | Human | Esophagus | ESCC | 6.15e-10 | 3.10e-01 | 0.1131 |
| 102157402 | AK6 | P10T-E | Human | Esophagus | ESCC | 7.95e-18 | 3.24e-01 | 0.116 |
| 102157402 | AK6 | P11T-E | Human | Esophagus | ESCC | 2.08e-13 | 6.57e-01 | 0.1426 |
| 102157402 | AK6 | P12T-E | Human | Esophagus | ESCC | 6.47e-30 | 5.22e-01 | 0.1122 |
| 102157402 | AK6 | P15T-E | Human | Esophagus | ESCC | 1.72e-17 | 5.02e-01 | 0.1149 |
| 102157402 | AK6 | P16T-E | Human | Esophagus | ESCC | 2.58e-24 | 2.86e-01 | 0.1153 |
| 102157402 | AK6 | P17T-E | Human | Esophagus | ESCC | 8.33e-05 | 2.69e-01 | 0.1278 |
| 102157402 | AK6 | P19T-E | Human | Esophagus | ESCC | 2.03e-04 | 4.46e-01 | 0.1662 |
| 102157402 | AK6 | P20T-E | Human | Esophagus | ESCC | 2.05e-12 | 2.21e-01 | 0.1124 |
| 102157402 | AK6 | P21T-E | Human | Esophagus | ESCC | 4.80e-30 | 6.60e-01 | 0.1617 |
| 102157402 | AK6 | P22T-E | Human | Esophagus | ESCC | 8.57e-23 | 3.60e-01 | 0.1236 |
| 102157402 | AK6 | P23T-E | Human | Esophagus | ESCC | 3.01e-21 | 4.87e-01 | 0.108 |
| 102157402 | AK6 | P24T-E | Human | Esophagus | ESCC | 1.74e-07 | 1.96e-01 | 0.1287 |
| 102157402 | AK6 | P26T-E | Human | Esophagus | ESCC | 1.91e-16 | 2.29e-01 | 0.1276 |
| Page: 1 2 3 4 5 6 |
| Tissue | Expression Dynamics | Abbreviation |
| Esophagus | 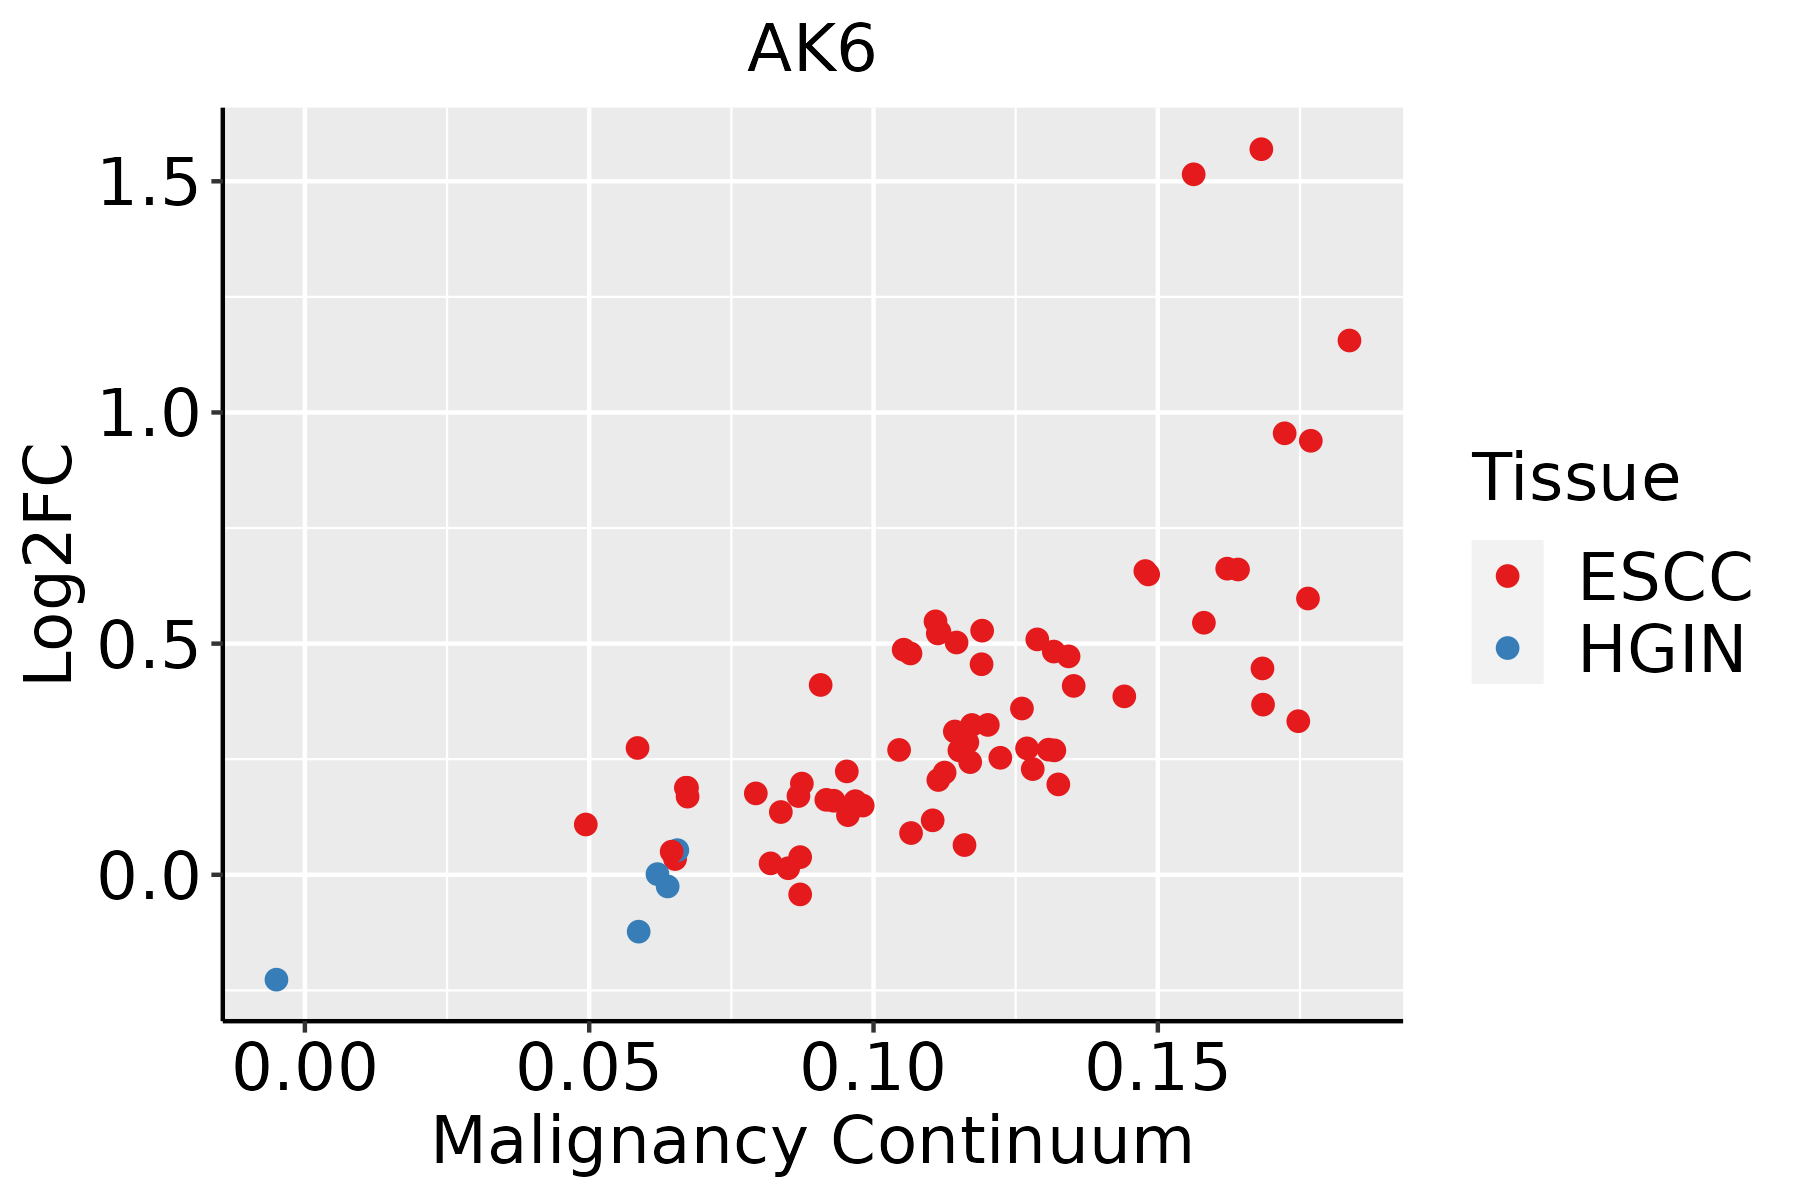 | ESCC: Esophageal squamous cell carcinoma |
| HGIN: High-grade intraepithelial neoplasias | ||
| LGIN: Low-grade intraepithelial neoplasias | ||
| Liver | 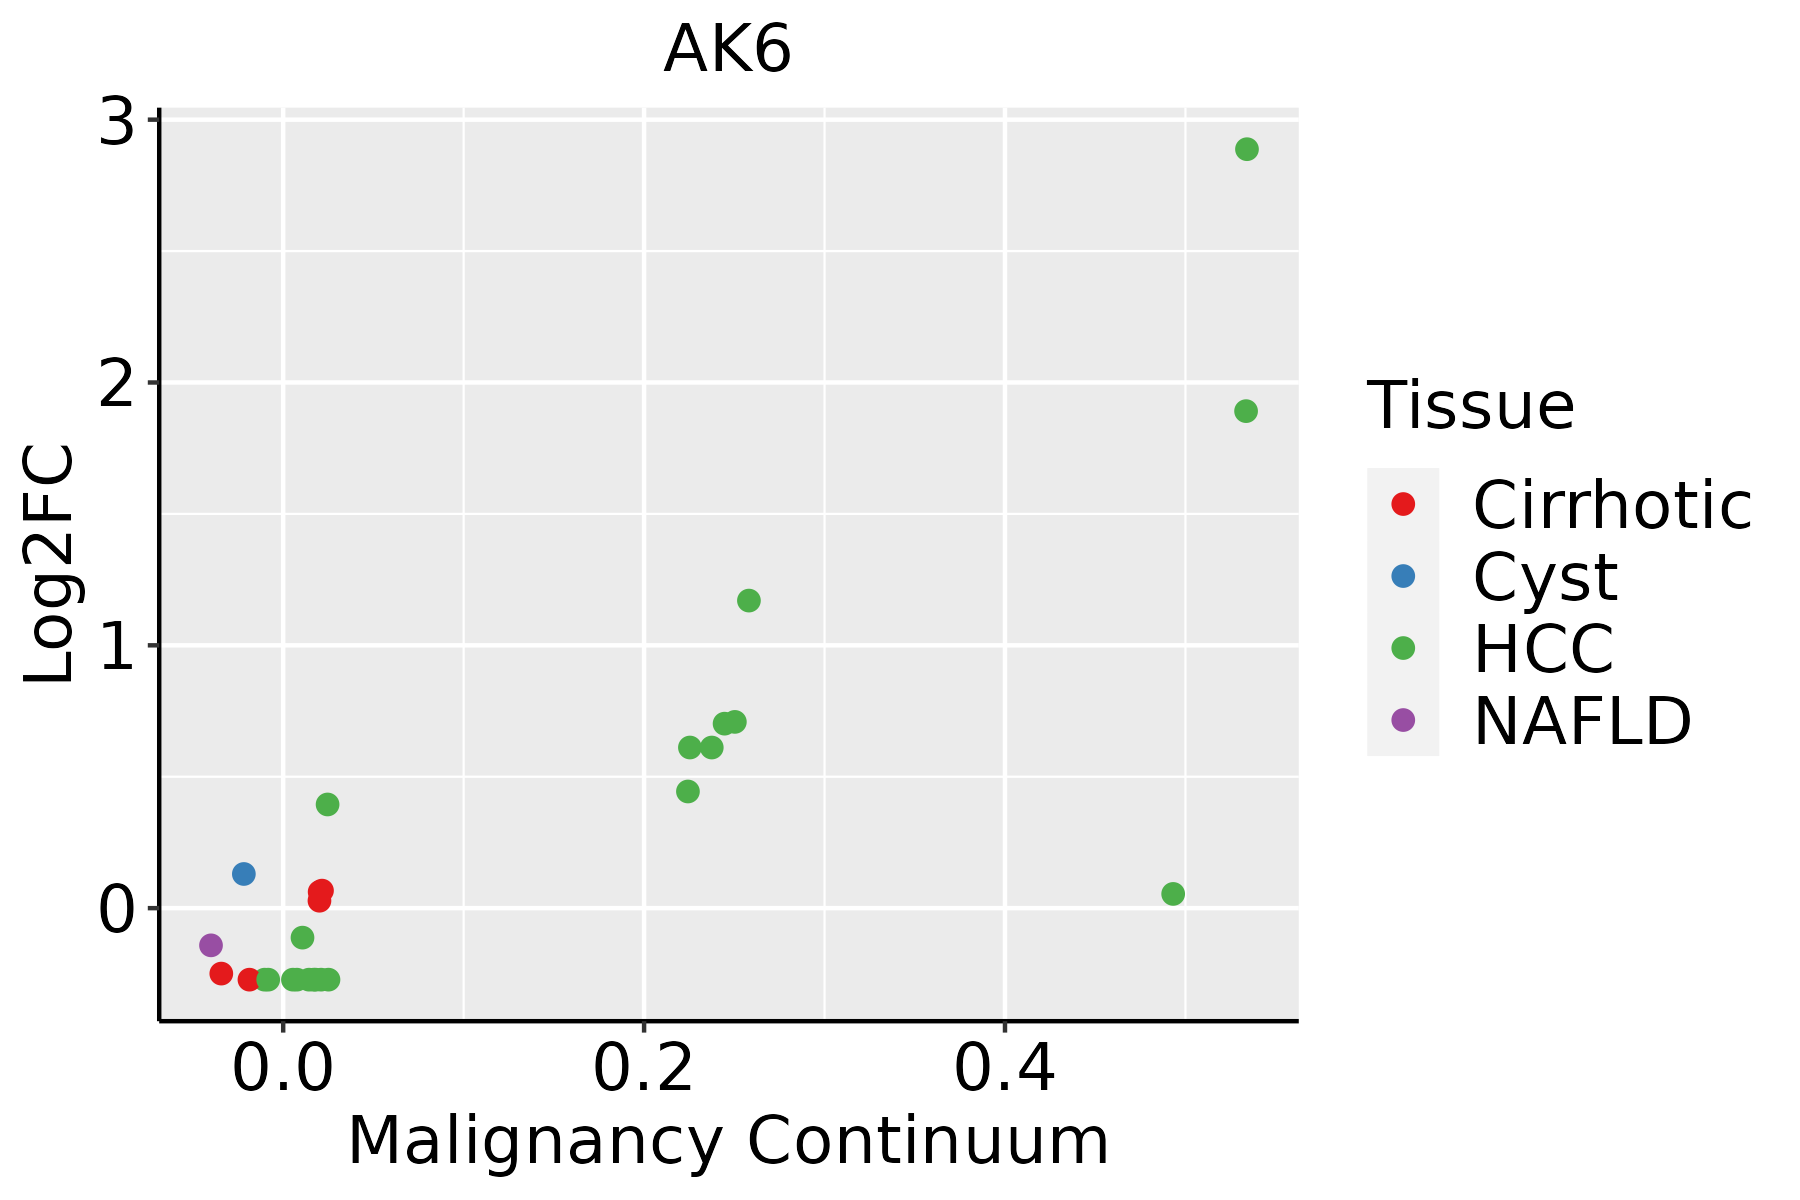 | HCC: Hepatocellular carcinoma |
| NAFLD: Non-alcoholic fatty liver disease | ||
| Oral Cavity | 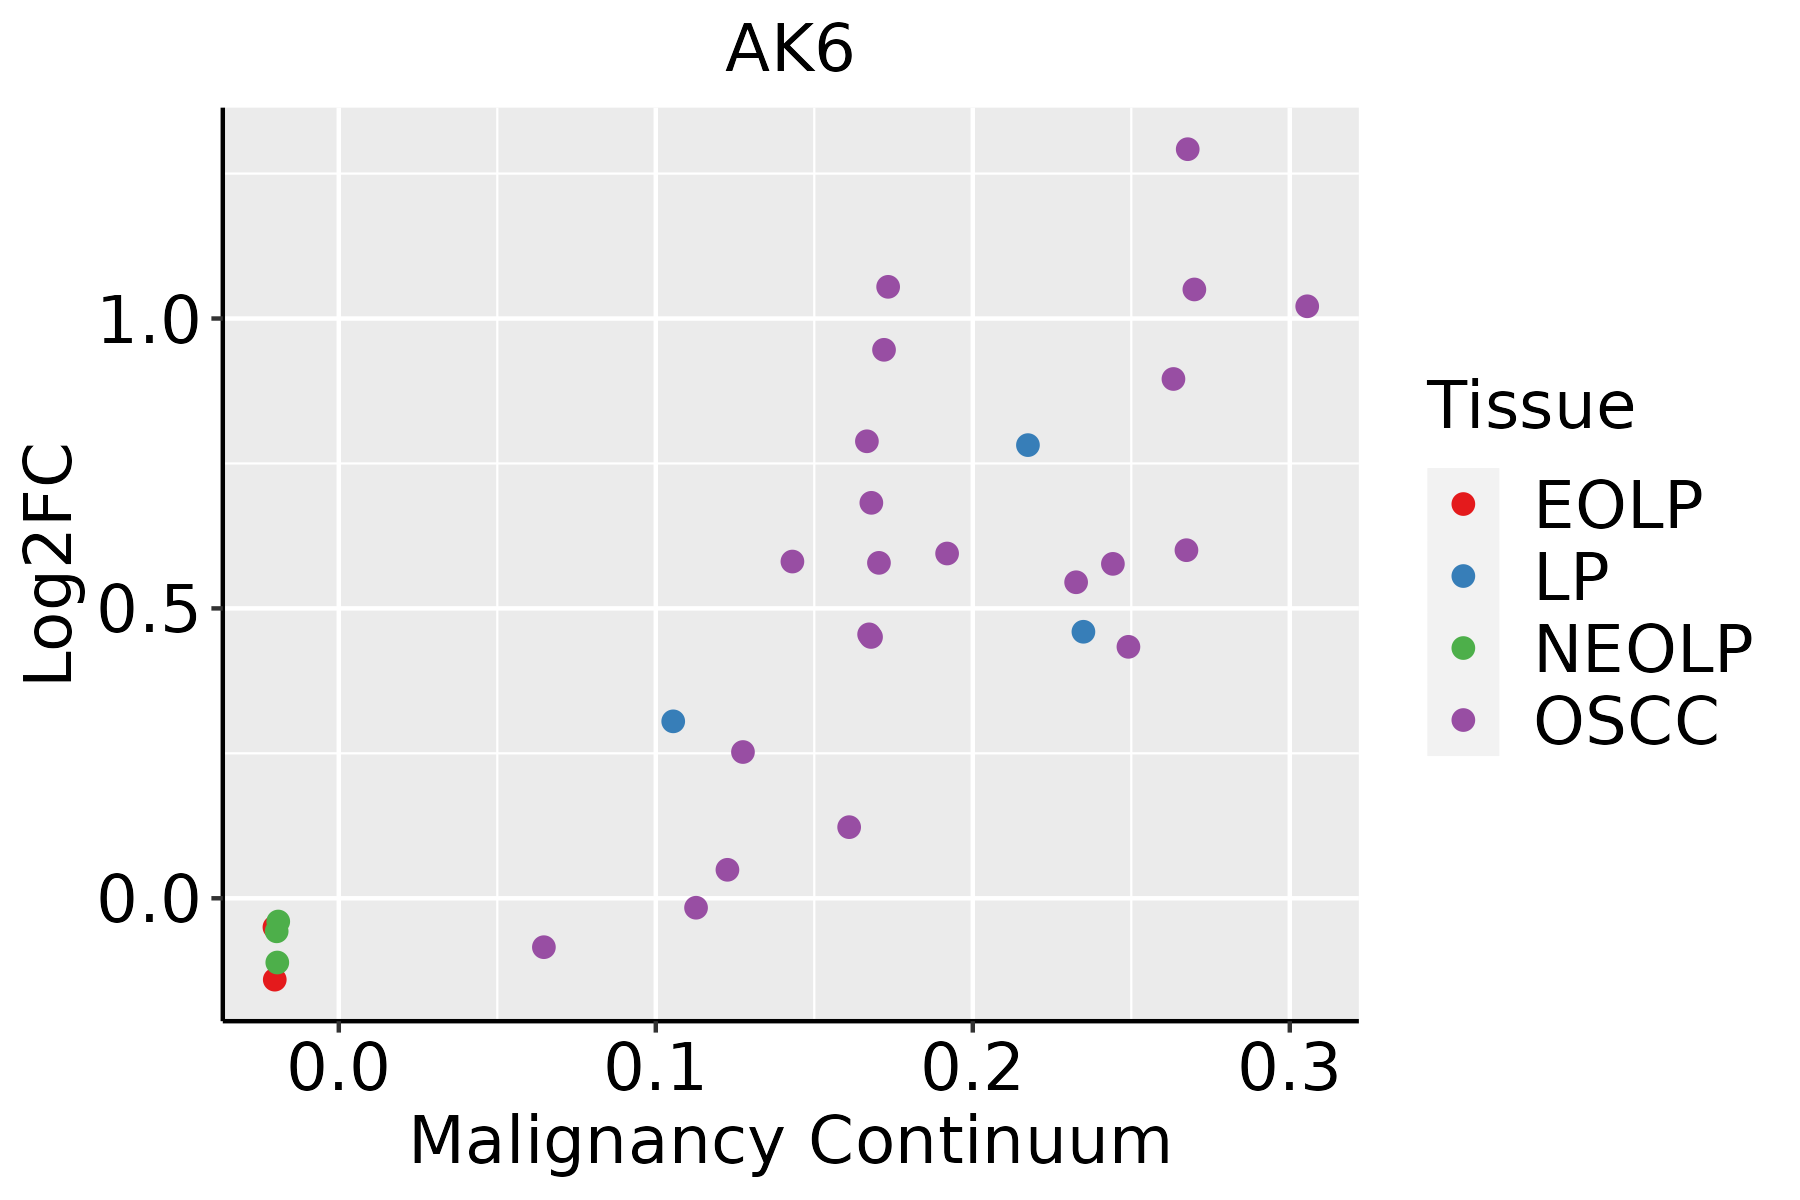 | EOLP: Erosive Oral lichen planus |
| LP: leukoplakia | ||
| NEOLP: Non-erosive oral lichen planus | ||
| OSCC: Oral squamous cell carcinoma | ||
| Prostate |  | BPH: Benign Prostatic Hyperplasia |
| ∗log2FC in expression of this searched gene in stem-like cells from each diseased tissue sample relative to stem-like cells in normal samples in each tissue plotted against the malignancy continuum. Samples are colored based on if they are from different disease stage. |
Top |
Malignant transformation related pathway analysis |
| Find out the enriched GO biological processes and KEGG pathways involved in transition from healthy to precancer to cancer |
| Tissue | Disease Stage | Enriched GO biological Processes |
| Colorectum | AD |  |
| Colorectum | SER |  |
| Colorectum | MSS |  |
| Colorectum | MSI-H |  |
| Colorectum | FAP |  |
| ∗Top 15 enriched GO BP terms are showed in the bar plot of each disease state in each tissue. Each row represents a significant GO biological process which is colored according to the -log10(p.adjust). |
| Page: 1 2 3 4 5 6 7 8 9 |
| GO ID | Tissue | Disease Stage | Description | Gene Ratio | Bg Ratio | pvalue | p.adjust | Count |
| GO:0006753110 | Esophagus | ESCC | nucleoside phosphate metabolic process | 288/8552 | 497/18723 | 1.80e-08 | 3.50e-07 | 288 |
| GO:0009117111 | Esophagus | ESCC | nucleotide metabolic process | 282/8552 | 489/18723 | 4.70e-08 | 8.50e-07 | 282 |
| GO:000916516 | Esophagus | ESCC | nucleotide biosynthetic process | 150/8552 | 254/18723 | 1.12e-05 | 1.06e-04 | 150 |
| GO:190129316 | Esophagus | ESCC | nucleoside phosphate biosynthetic process | 151/8552 | 256/18723 | 1.15e-05 | 1.08e-04 | 151 |
| GO:00091234 | Esophagus | ESCC | nucleoside monophosphate metabolic process | 49/8552 | 76/18723 | 7.30e-04 | 3.80e-03 | 49 |
| GO:000675312 | Liver | Cirrhotic | nucleoside phosphate metabolic process | 190/4634 | 497/18723 | 1.10e-11 | 6.96e-10 | 190 |
| GO:000911712 | Liver | Cirrhotic | nucleotide metabolic process | 187/4634 | 489/18723 | 1.55e-11 | 9.63e-10 | 187 |
| GO:00091232 | Liver | Cirrhotic | nucleoside monophosphate metabolic process | 36/4634 | 76/18723 | 1.55e-05 | 2.11e-04 | 36 |
| GO:00091654 | Liver | Cirrhotic | nucleotide biosynthetic process | 89/4634 | 254/18723 | 1.45e-04 | 1.40e-03 | 89 |
| GO:19012934 | Liver | Cirrhotic | nucleoside phosphate biosynthetic process | 89/4634 | 256/18723 | 1.97e-04 | 1.82e-03 | 89 |
| GO:000911722 | Liver | HCC | nucleotide metabolic process | 300/7958 | 489/18723 | 1.61e-17 | 1.71e-15 | 300 |
| GO:000675322 | Liver | HCC | nucleoside phosphate metabolic process | 304/7958 | 497/18723 | 1.78e-17 | 1.85e-15 | 304 |
| GO:000916512 | Liver | HCC | nucleotide biosynthetic process | 150/7958 | 254/18723 | 6.79e-08 | 1.40e-06 | 150 |
| GO:190129312 | Liver | HCC | nucleoside phosphate biosynthetic process | 151/7958 | 256/18723 | 6.84e-08 | 1.41e-06 | 151 |
| GO:000912311 | Liver | HCC | nucleoside monophosphate metabolic process | 52/7958 | 76/18723 | 4.35e-06 | 5.54e-05 | 52 |
| GO:001604917 | Oral cavity | OSCC | cell growth | 268/7305 | 482/18723 | 6.55e-14 | 3.51e-12 | 268 |
| GO:000675318 | Oral cavity | OSCC | nucleoside phosphate metabolic process | 247/7305 | 497/18723 | 6.28e-07 | 8.96e-06 | 247 |
| GO:000911719 | Oral cavity | OSCC | nucleotide metabolic process | 243/7305 | 489/18723 | 7.80e-07 | 1.09e-05 | 243 |
| GO:00091233 | Oral cavity | OSCC | nucleoside monophosphate metabolic process | 50/7305 | 76/18723 | 2.04e-06 | 2.62e-05 | 50 |
| GO:00485889 | Oral cavity | OSCC | developmental cell growth | 116/7305 | 234/18723 | 6.20e-04 | 3.50e-03 | 116 |
| Page: 1 2 |
| Pathway ID | Tissue | Disease Stage | Description | Gene Ratio | Bg Ratio | pvalue | p.adjust | qvalue | Count |
| hsa012325 | Esophagus | ESCC | Nucleotide metabolism | 59/4205 | 85/8465 | 1.67e-04 | 6.58e-04 | 3.37e-04 | 59 |
| hsa012405 | Esophagus | ESCC | Biosynthesis of cofactors | 97/4205 | 153/8465 | 3.88e-04 | 1.35e-03 | 6.94e-04 | 97 |
| hsa0123212 | Esophagus | ESCC | Nucleotide metabolism | 59/4205 | 85/8465 | 1.67e-04 | 6.58e-04 | 3.37e-04 | 59 |
| hsa0124012 | Esophagus | ESCC | Biosynthesis of cofactors | 97/4205 | 153/8465 | 3.88e-04 | 1.35e-03 | 6.94e-04 | 97 |
| hsa01240 | Liver | Cirrhotic | Biosynthesis of cofactors | 66/2530 | 153/8465 | 3.11e-04 | 1.99e-03 | 1.23e-03 | 66 |
| hsa01232 | Liver | Cirrhotic | Nucleotide metabolism | 39/2530 | 85/8465 | 1.27e-03 | 6.73e-03 | 4.15e-03 | 39 |
| hsa012401 | Liver | Cirrhotic | Biosynthesis of cofactors | 66/2530 | 153/8465 | 3.11e-04 | 1.99e-03 | 1.23e-03 | 66 |
| hsa012321 | Liver | Cirrhotic | Nucleotide metabolism | 39/2530 | 85/8465 | 1.27e-03 | 6.73e-03 | 4.15e-03 | 39 |
| hsa012402 | Liver | HCC | Biosynthesis of cofactors | 103/4020 | 153/8465 | 4.67e-07 | 5.05e-06 | 2.81e-06 | 103 |
| hsa012322 | Liver | HCC | Nucleotide metabolism | 59/4020 | 85/8465 | 3.30e-05 | 1.88e-04 | 1.04e-04 | 59 |
| hsa012403 | Liver | HCC | Biosynthesis of cofactors | 103/4020 | 153/8465 | 4.67e-07 | 5.05e-06 | 2.81e-06 | 103 |
| hsa012323 | Liver | HCC | Nucleotide metabolism | 59/4020 | 85/8465 | 3.30e-05 | 1.88e-04 | 1.04e-04 | 59 |
| hsa012324 | Oral cavity | OSCC | Nucleotide metabolism | 54/3704 | 85/8465 | 1.78e-04 | 5.95e-04 | 3.03e-04 | 54 |
| hsa012404 | Oral cavity | OSCC | Biosynthesis of cofactors | 88/3704 | 153/8465 | 3.84e-04 | 1.20e-03 | 6.12e-04 | 88 |
| hsa0123211 | Oral cavity | OSCC | Nucleotide metabolism | 54/3704 | 85/8465 | 1.78e-04 | 5.95e-04 | 3.03e-04 | 54 |
| hsa0124011 | Oral cavity | OSCC | Biosynthesis of cofactors | 88/3704 | 153/8465 | 3.84e-04 | 1.20e-03 | 6.12e-04 | 88 |
| Page: 1 |
Top |
Cell-cell communication analysis |
| Identification of potential cell-cell interactions between two cell types and their ligand-receptor pairs for different disease states |
| Ligand | Receptor | LRpair | Pathway | Tissue | Disease Stage |
| Page: 1 |
Top |
Single-cell gene regulatory network inference analysis |
| Find out the significant the regulons (TFs) and the target genes of each regulon across cell types for different disease states |
| TF | Cell Type | Tissue | Disease Stage | Target Gene | RSS | Regulon Activity |
| ∗The dot plots of a searched regulon are shown for all cell subpopulations in each disease state of each tissue based on the regulon specific score inferred using pySCENIC and by calculating the average expression. |
| Page: 1 |
Top |
Somatic mutation of malignant transformation related genes |
| Annotation of somatic variants for genes involved in malignant transformation |
| Hugo Symbol | Variant Class | Variant Classification | dbSNP RS | HGVSc | HGVSp | HGVSp Short | SWISSPROT | BIOTYPE | SIFT | PolyPhen | Tumor Sample Barcode | Tissue | Histology | Sex | Age | Stage | Therapy Types | Drugs | Outcome |
| AK6 | SNV | Missense_Mutation | c.319N>C | p.Glu107Gln | p.E107Q | Q9Y3D8 | protein_coding | tolerated(0.39) | benign(0.043) | TCGA-IR-A3LH-01 | Cervix | cervical & endocervical cancer | Female | <65 | I/II | Chemotherapy | cisplatin | CR | |
| AK6 | SNV | Missense_Mutation | novel | c.371T>A | p.Ile124Asn | p.I124N | Q9Y3D8 | protein_coding | deleterious(0.02) | probably_damaging(0.989) | TCGA-AM-5820-01 | Colorectum | colon adenocarcinoma | Female | <65 | I/II | Unknown | Unknown | SD |
| AK6 | insertion | In_Frame_Ins | novel | c.372_373insCCA | p.Ile124_Phe125insPro | p.I124_F125insP | Q9Y3D8 | protein_coding | TCGA-AM-5820-01 | Colorectum | colon adenocarcinoma | Female | <65 | I/II | Unknown | Unknown | SD | ||
| AK6 | insertion | Frame_Shift_Ins | novel | c.322dupA | p.Thr108AsnfsTer5 | p.T108Nfs*5 | Q9Y3D8 | protein_coding | TCGA-CA-6718-01 | Colorectum | colon adenocarcinoma | Male | <65 | I/II | Unknown | Unknown | PD | ||
| AK6 | SNV | Missense_Mutation | novel | c.7C>G | p.Leu3Val | p.L3V | Q9Y3D8 | protein_coding | tolerated(0.11) | benign(0.018) | TCGA-DI-A2QU-01 | Endometrium | uterine corpus endometrioid carcinoma | Female | >=65 | III/IV | Unknown | Unknown | PD |
| Page: 1 |
Top |
Related drugs of malignant transformation related genes |
| Identification of chemicals and drugs interact with genes involved in malignant transfromation |
| (DGIdb 4.0) |
| Entrez ID | Symbol | Category | Interaction Types | Drug Claim Name | Drug Name | PMIDs |
| Page: 1 |

Copyright 2023-Present -The University of Texas Health Science Center at Houston |