
|
|||||
|
 | |
| |
| |
| |
| |
| |
|
Gene: AK4 |
Gene summary for AK4 |
| Gene information | Species | Human | Gene symbol | AK4 | Gene ID | 205 |
| Gene name | adenylate kinase 4 | |
| Gene Alias | AK 4 | |
| Cytomap | 1p31.3 | |
| Gene Type | protein-coding | GO ID | GO:0001666 | UniProtAcc | P27144 |
Top |
Malignant transformation analysis |
| Identification of the aberrant gene expression in precancerous and cancerous lesions by comparing the gene expression of stem-like cells in diseased tissues with normal stem cells |
| Entrez ID | Symbol | Replicates | Species | Organ | Tissue | Adj P-value | Log2FC | Malignancy |
| 205 | AK4 | LZE4T | Human | Esophagus | ESCC | 4.01e-16 | 5.33e-01 | 0.0811 |
| 205 | AK4 | LZE7T | Human | Esophagus | ESCC | 2.14e-04 | 2.60e-01 | 0.0667 |
| 205 | AK4 | LZE8T | Human | Esophagus | ESCC | 4.28e-04 | 2.83e-01 | 0.067 |
| 205 | AK4 | LZE6T | Human | Esophagus | ESCC | 9.71e-04 | 4.03e-01 | 0.0845 |
| 205 | AK4 | P2T-E | Human | Esophagus | ESCC | 4.34e-18 | 3.41e-01 | 0.1177 |
| 205 | AK4 | P4T-E | Human | Esophagus | ESCC | 7.28e-15 | 5.60e-01 | 0.1323 |
| 205 | AK4 | P5T-E | Human | Esophagus | ESCC | 3.22e-30 | 8.02e-01 | 0.1327 |
| 205 | AK4 | P8T-E | Human | Esophagus | ESCC | 1.01e-03 | 5.43e-02 | 0.0889 |
| 205 | AK4 | P9T-E | Human | Esophagus | ESCC | 2.15e-14 | 5.86e-01 | 0.1131 |
| 205 | AK4 | P10T-E | Human | Esophagus | ESCC | 5.77e-20 | 5.09e-01 | 0.116 |
| 205 | AK4 | P11T-E | Human | Esophagus | ESCC | 4.79e-03 | 2.61e-01 | 0.1426 |
| 205 | AK4 | P12T-E | Human | Esophagus | ESCC | 7.34e-16 | 4.83e-01 | 0.1122 |
| 205 | AK4 | P15T-E | Human | Esophagus | ESCC | 5.23e-38 | 1.03e+00 | 0.1149 |
| 205 | AK4 | P16T-E | Human | Esophagus | ESCC | 4.98e-13 | 3.26e-01 | 0.1153 |
| 205 | AK4 | P17T-E | Human | Esophagus | ESCC | 4.10e-08 | 7.38e-01 | 0.1278 |
| 205 | AK4 | P19T-E | Human | Esophagus | ESCC | 1.65e-03 | 9.26e-01 | 0.1662 |
| 205 | AK4 | P20T-E | Human | Esophagus | ESCC | 3.71e-33 | 7.94e-01 | 0.1124 |
| 205 | AK4 | P21T-E | Human | Esophagus | ESCC | 2.13e-53 | 1.32e+00 | 0.1617 |
| 205 | AK4 | P22T-E | Human | Esophagus | ESCC | 1.09e-03 | 1.07e-01 | 0.1236 |
| 205 | AK4 | P23T-E | Human | Esophagus | ESCC | 1.88e-03 | 1.33e-01 | 0.108 |
| Page: 1 2 3 4 5 |
| Tissue | Expression Dynamics | Abbreviation |
| Esophagus | 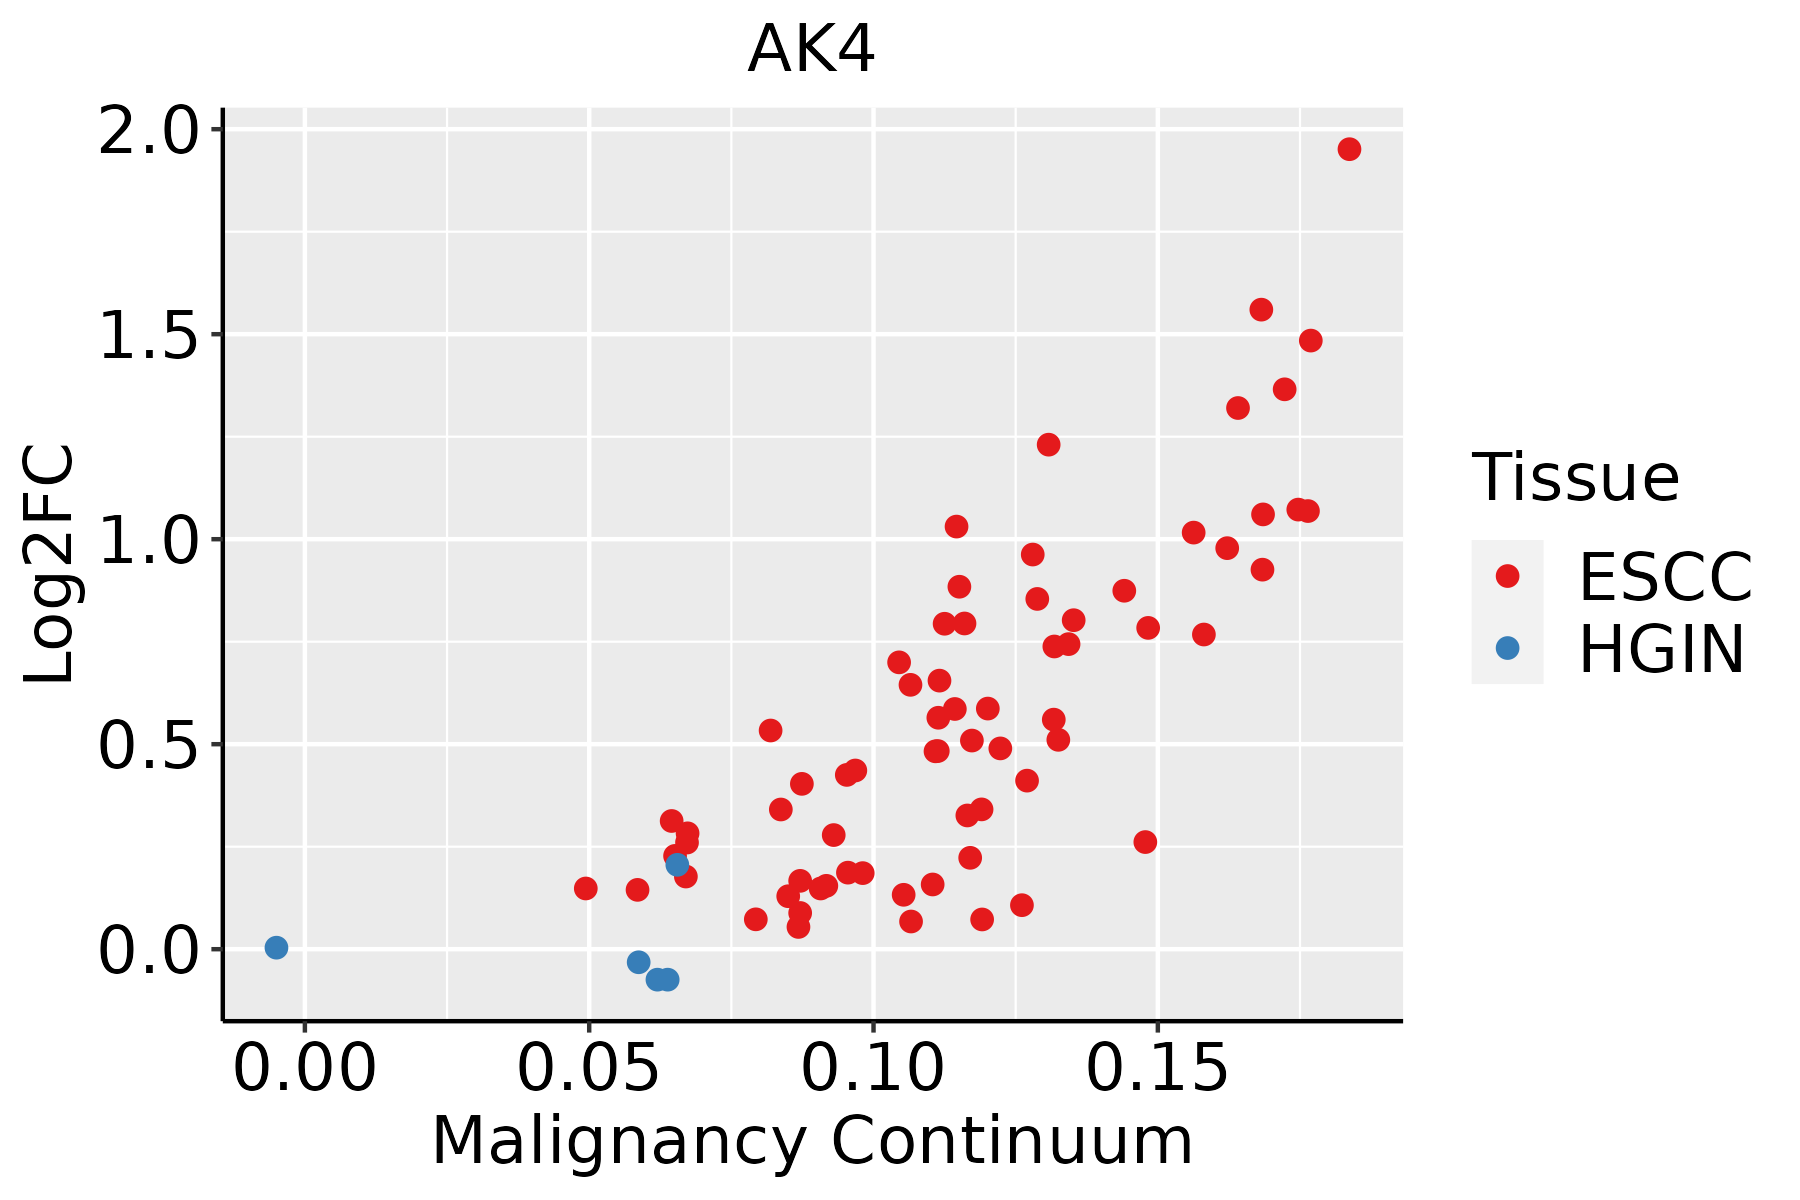 | ESCC: Esophageal squamous cell carcinoma |
| HGIN: High-grade intraepithelial neoplasias | ||
| LGIN: Low-grade intraepithelial neoplasias | ||
| Liver | 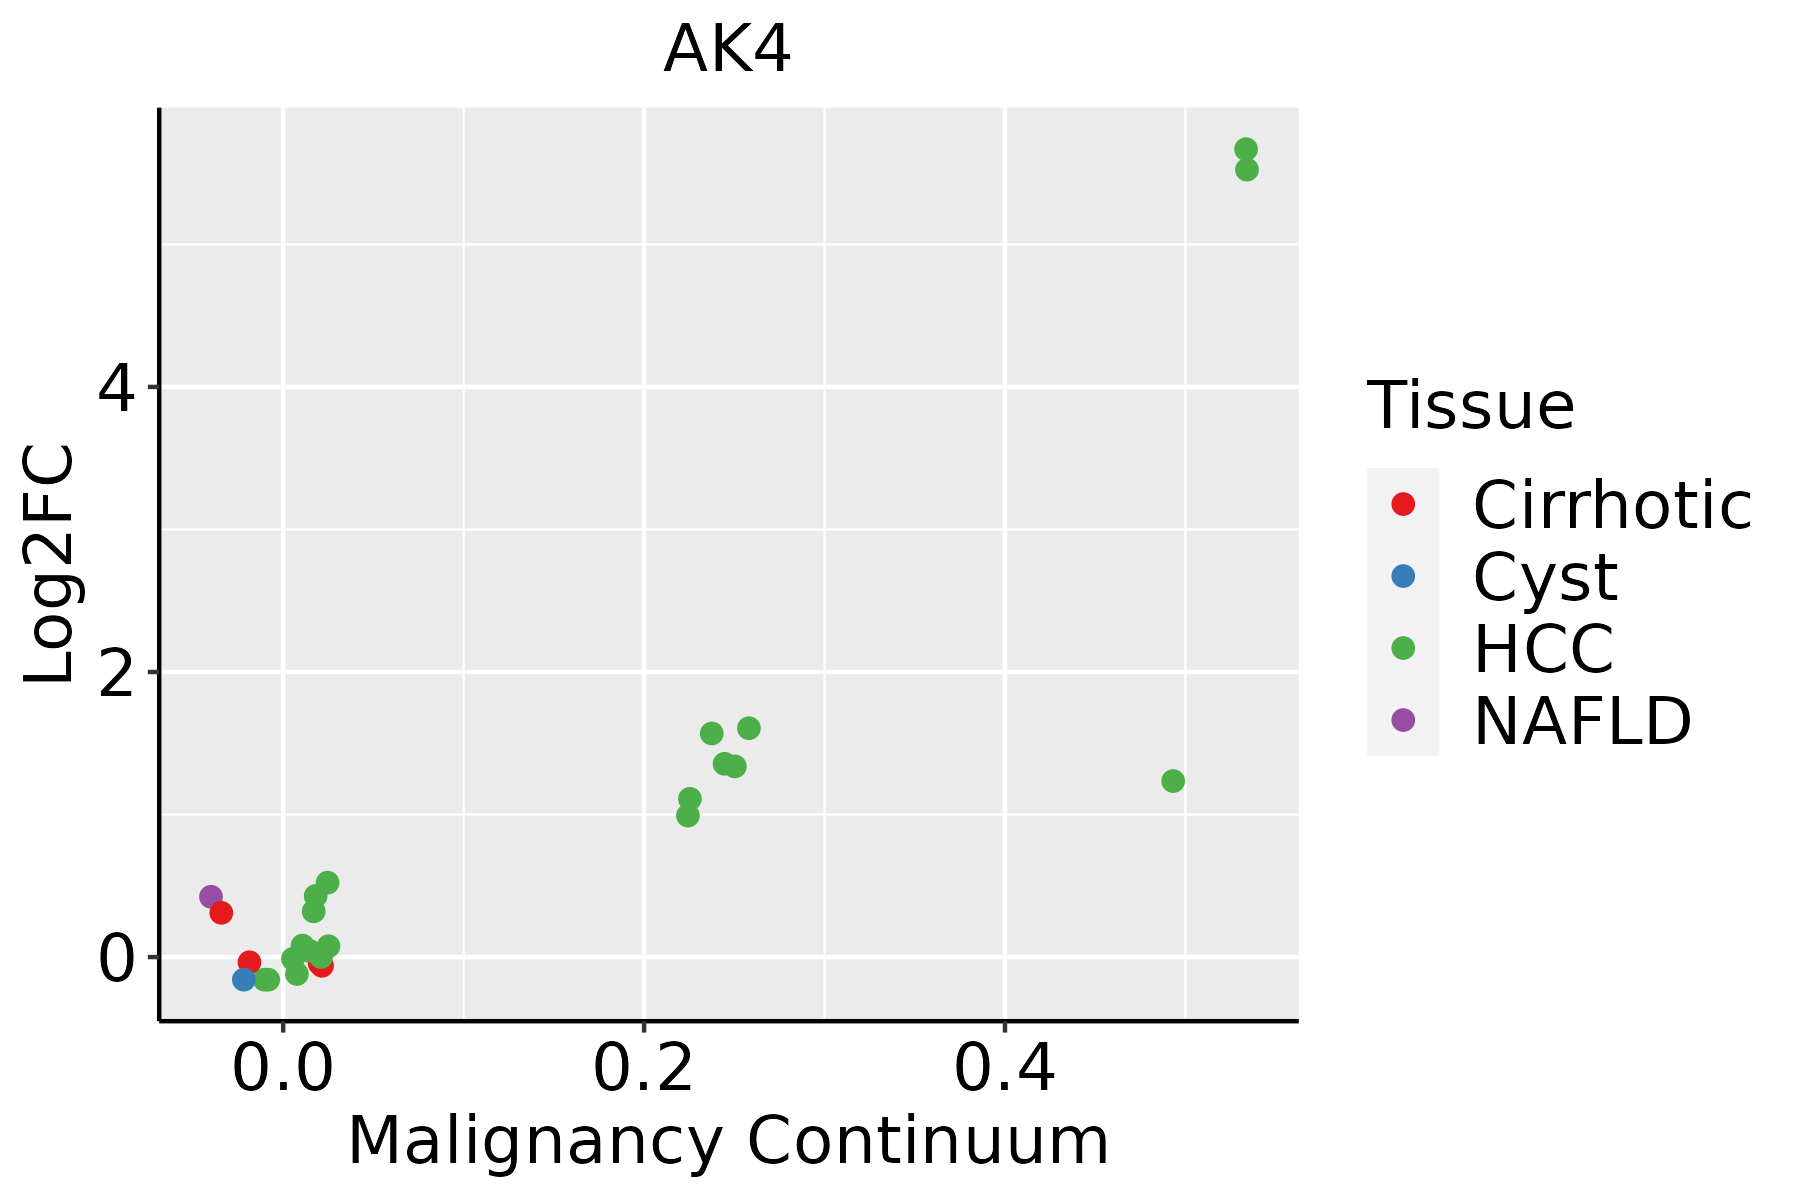 | HCC: Hepatocellular carcinoma |
| NAFLD: Non-alcoholic fatty liver disease | ||
| Oral Cavity | 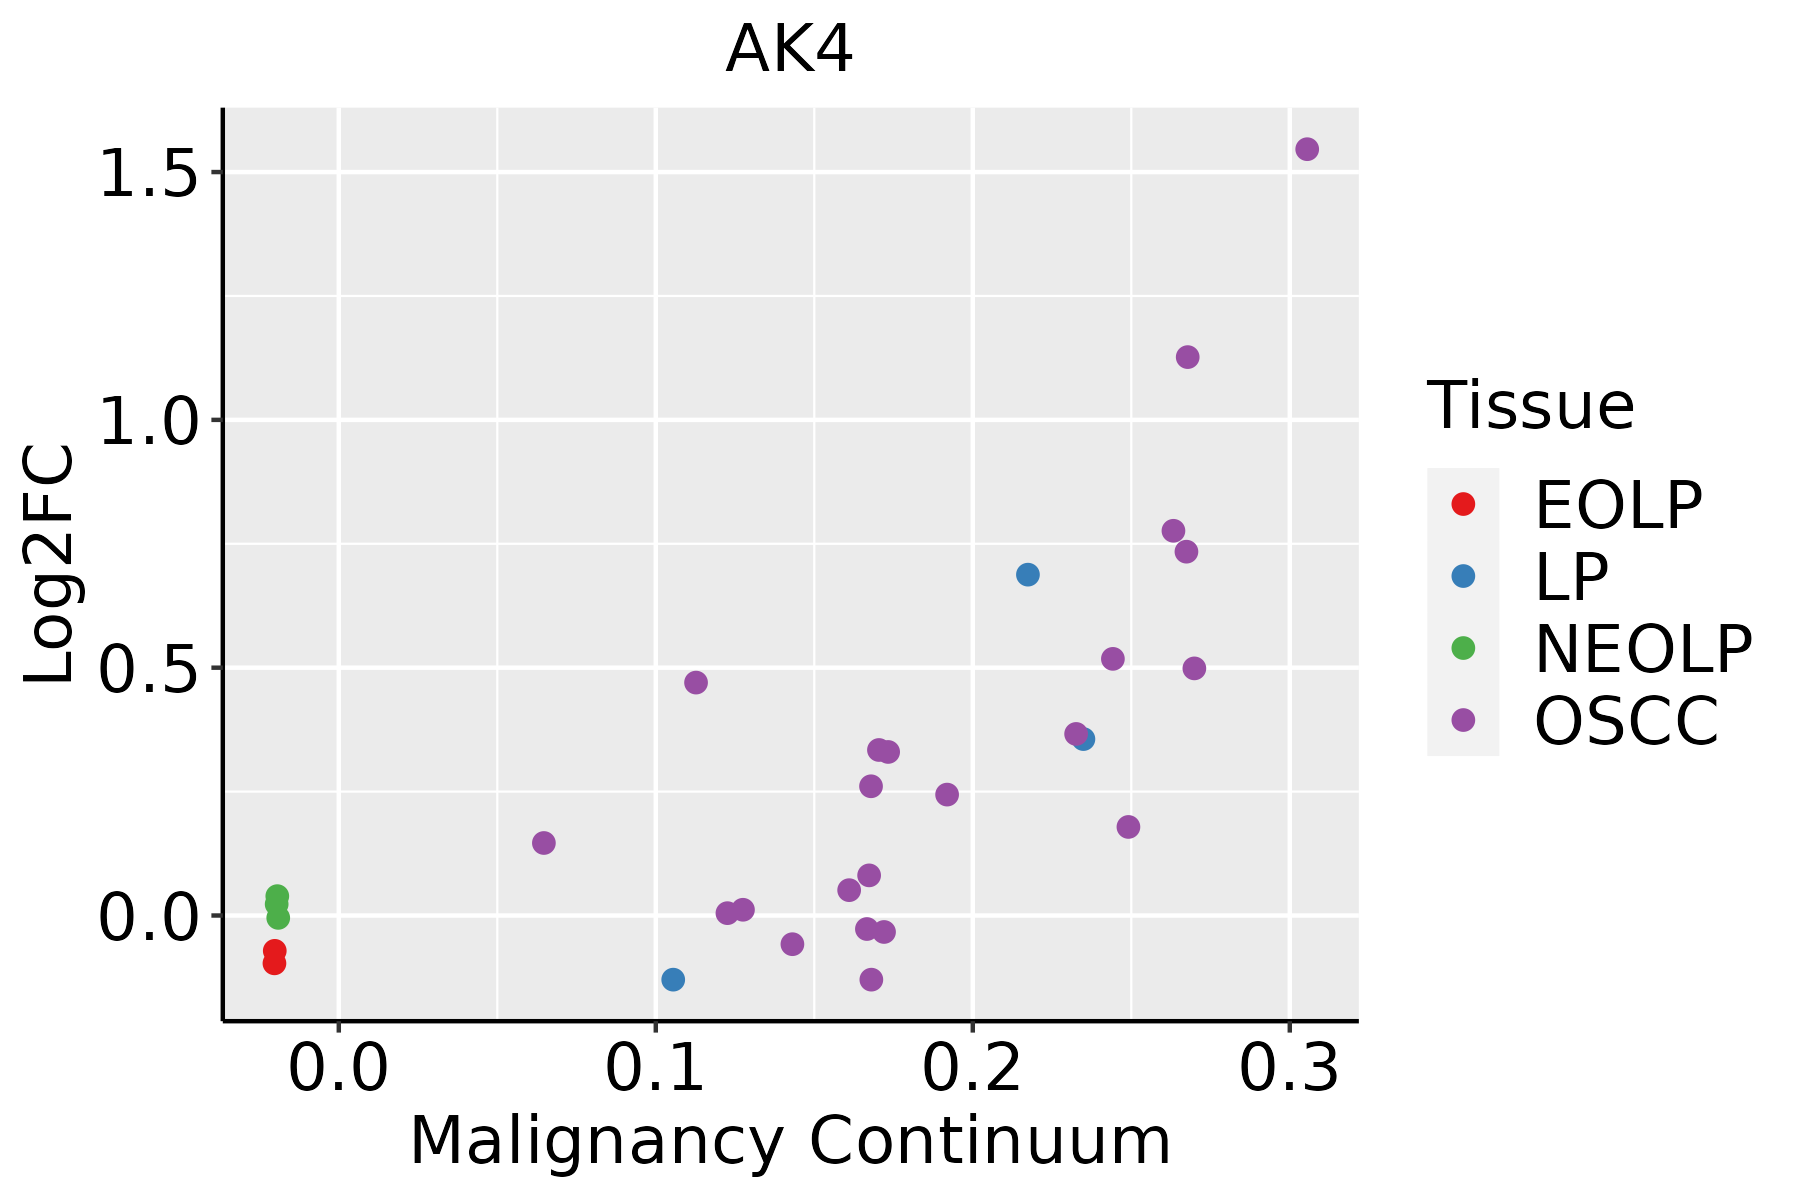 | EOLP: Erosive Oral lichen planus |
| LP: leukoplakia | ||
| NEOLP: Non-erosive oral lichen planus | ||
| OSCC: Oral squamous cell carcinoma | ||
| Skin | 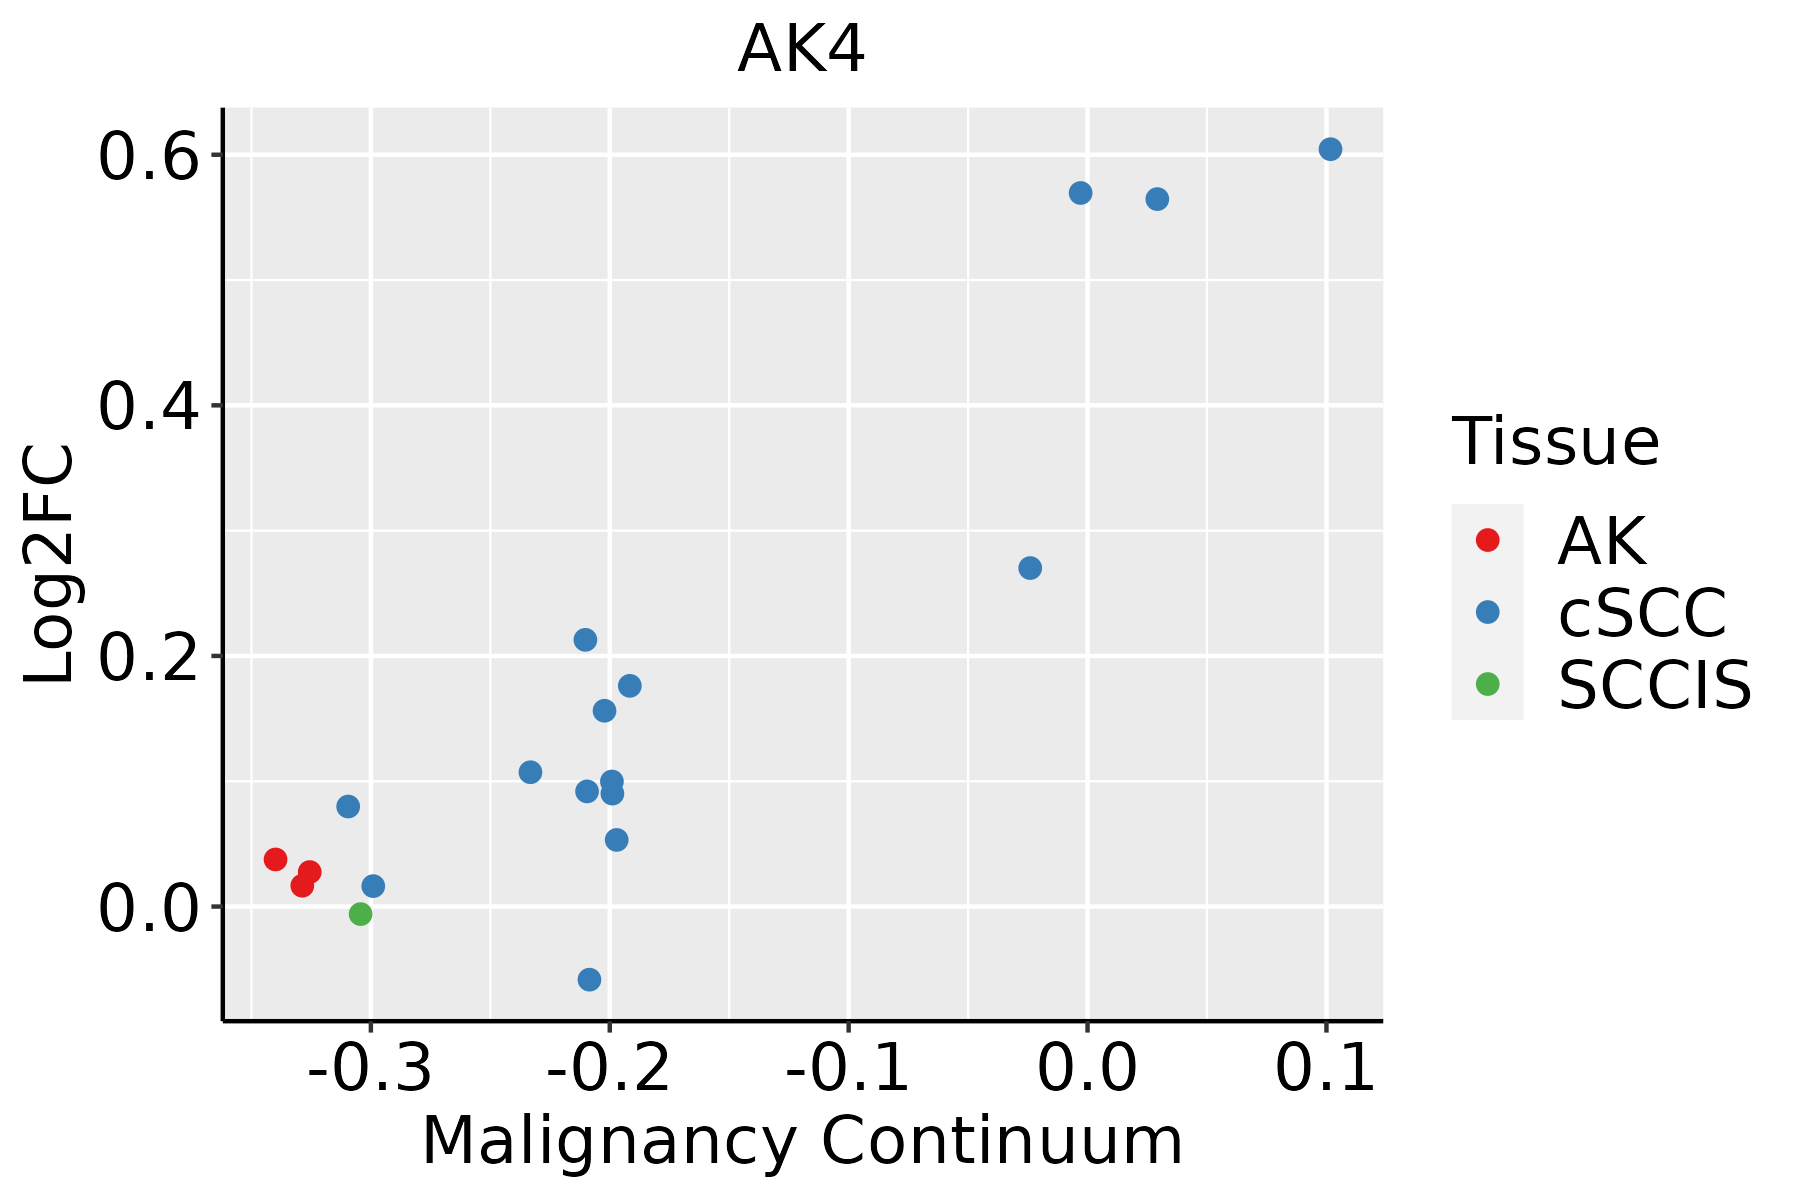 | AK: Actinic keratosis |
| cSCC: Cutaneous squamous cell carcinoma | ||
| SCCIS:squamous cell carcinoma in situ | ||
| Thyroid | 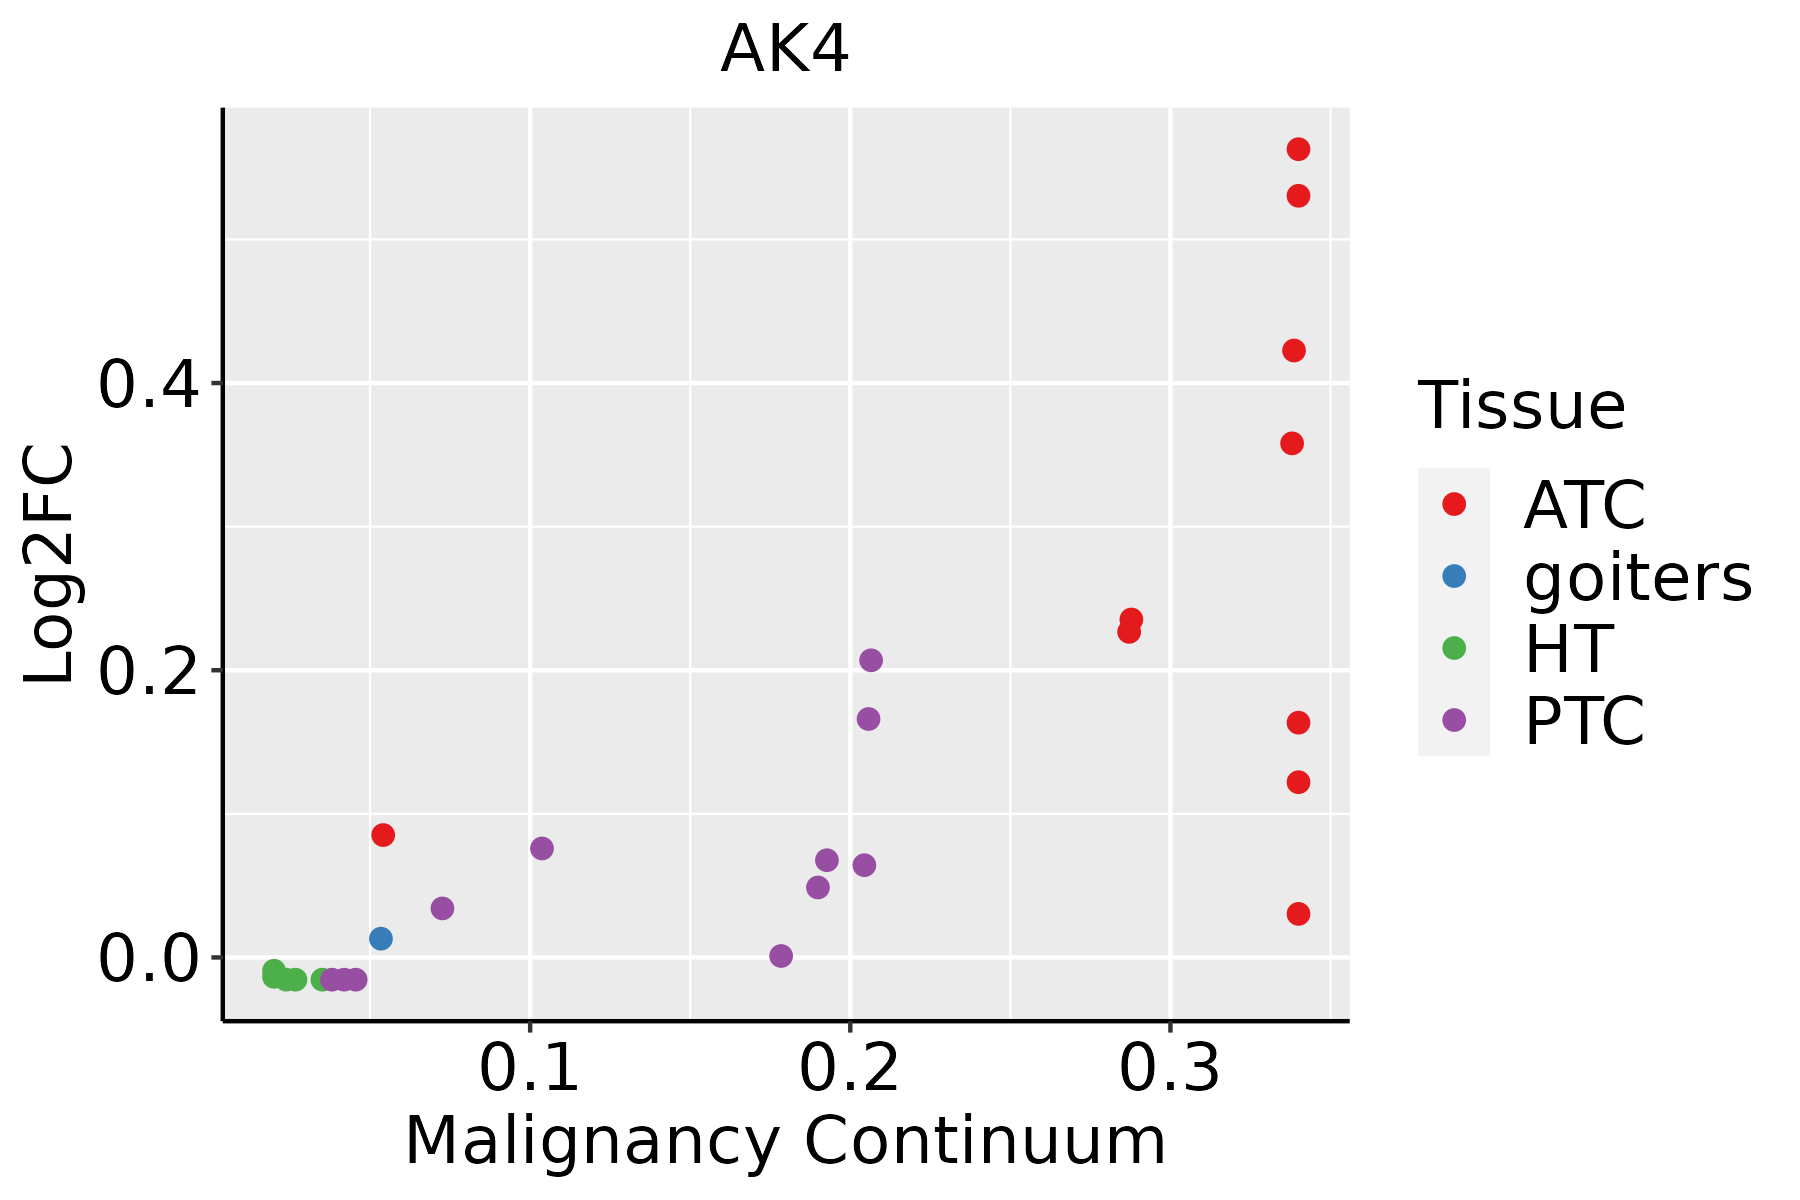 | ATC: Anaplastic thyroid cancer |
| HT: Hashimoto's thyroiditis | ||
| PTC: Papillary thyroid cancer |
| ∗log2FC in expression of this searched gene in stem-like cells from each diseased tissue sample relative to stem-like cells in normal samples in each tissue plotted against the malignancy continuum. Samples are colored based on if they are from different disease stage. |
Top |
Malignant transformation related pathway analysis |
| Find out the enriched GO biological processes and KEGG pathways involved in transition from healthy to precancer to cancer |
| Tissue | Disease Stage | Enriched GO biological Processes |
| Colorectum | AD |  |
| Colorectum | SER |  |
| Colorectum | MSS |  |
| Colorectum | MSI-H |  |
| Colorectum | FAP |  |
| ∗Top 15 enriched GO BP terms are showed in the bar plot of each disease state in each tissue. Each row represents a significant GO biological process which is colored according to the -log10(p.adjust). |
| Page: 1 2 3 4 5 6 7 8 9 |
| GO ID | Tissue | Disease Stage | Description | Gene Ratio | Bg Ratio | pvalue | p.adjust | Count |
| GO:0016049 | Colorectum | AD | cell growth | 143/3918 | 482/18723 | 2.83e-06 | 8.09e-05 | 143 |
| GO:0001558 | Colorectum | AD | regulation of cell growth | 124/3918 | 414/18723 | 7.67e-06 | 1.86e-04 | 124 |
| GO:00160493 | Colorectum | FAP | cell growth | 112/2622 | 482/18723 | 2.40e-08 | 2.30e-06 | 112 |
| GO:00015583 | Colorectum | FAP | regulation of cell growth | 95/2622 | 414/18723 | 5.02e-07 | 2.61e-05 | 95 |
| GO:00160494 | Colorectum | CRC | cell growth | 95/2078 | 482/18723 | 1.51e-08 | 2.75e-06 | 95 |
| GO:00015584 | Colorectum | CRC | regulation of cell growth | 78/2078 | 414/18723 | 1.84e-06 | 9.11e-05 | 78 |
| GO:004312220 | Esophagus | HGIN | regulation of I-kappaB kinase/NF-kappaB signaling | 63/2587 | 249/18723 | 8.91e-07 | 3.61e-05 | 63 |
| GO:000724918 | Esophagus | HGIN | I-kappaB kinase/NF-kappaB signaling | 67/2587 | 281/18723 | 3.84e-06 | 1.29e-04 | 67 |
| GO:004312317 | Esophagus | HGIN | positive regulation of I-kappaB kinase/NF-kappaB signaling | 49/2587 | 186/18723 | 4.22e-06 | 1.40e-04 | 49 |
| GO:0016032111 | Esophagus | ESCC | viral process | 301/8552 | 415/18723 | 3.34e-29 | 1.32e-26 | 301 |
| GO:0006091110 | Esophagus | ESCC | generation of precursor metabolites and energy | 331/8552 | 490/18723 | 3.86e-23 | 8.45e-21 | 331 |
| GO:0034976111 | Esophagus | ESCC | response to endoplasmic reticulum stress | 192/8552 | 256/18723 | 7.15e-22 | 1.30e-19 | 192 |
| GO:0019058111 | Esophagus | ESCC | viral life cycle | 226/8552 | 317/18723 | 1.17e-20 | 1.76e-18 | 226 |
| GO:0045333110 | Esophagus | ESCC | cellular respiration | 173/8552 | 230/18723 | 4.53e-20 | 5.99e-18 | 173 |
| GO:0006413110 | Esophagus | ESCC | translational initiation | 100/8552 | 118/18723 | 1.16e-18 | 1.25e-16 | 100 |
| GO:0009060110 | Esophagus | ESCC | aerobic respiration | 145/8552 | 189/18723 | 2.16e-18 | 2.21e-16 | 145 |
| GO:0015980110 | Esophagus | ESCC | energy derivation by oxidation of organic compounds | 220/8552 | 318/18723 | 1.20e-17 | 1.09e-15 | 220 |
| GO:0006417111 | Esophagus | ESCC | regulation of translation | 304/8552 | 468/18723 | 1.53e-17 | 1.33e-15 | 304 |
| GO:001908017 | Esophagus | ESCC | viral gene expression | 80/8552 | 94/18723 | 2.04e-15 | 1.28e-13 | 80 |
| GO:0045727111 | Esophagus | ESCC | positive regulation of translation | 107/8552 | 136/18723 | 2.79e-15 | 1.68e-13 | 107 |
| Page: 1 2 3 4 5 6 7 8 9 10 11 12 13 14 15 16 17 18 19 20 21 22 23 24 25 26 27 28 29 30 31 32 33 34 35 36 37 38 39 40 41 42 43 44 45 46 47 48 49 50 51 52 |
| Pathway ID | Tissue | Disease Stage | Description | Gene Ratio | Bg Ratio | pvalue | p.adjust | qvalue | Count |
| hsa012325 | Esophagus | ESCC | Nucleotide metabolism | 59/4205 | 85/8465 | 1.67e-04 | 6.58e-04 | 3.37e-04 | 59 |
| hsa012405 | Esophagus | ESCC | Biosynthesis of cofactors | 97/4205 | 153/8465 | 3.88e-04 | 1.35e-03 | 6.94e-04 | 97 |
| hsa0123212 | Esophagus | ESCC | Nucleotide metabolism | 59/4205 | 85/8465 | 1.67e-04 | 6.58e-04 | 3.37e-04 | 59 |
| hsa0124012 | Esophagus | ESCC | Biosynthesis of cofactors | 97/4205 | 153/8465 | 3.88e-04 | 1.35e-03 | 6.94e-04 | 97 |
| hsa01240 | Liver | Cirrhotic | Biosynthesis of cofactors | 66/2530 | 153/8465 | 3.11e-04 | 1.99e-03 | 1.23e-03 | 66 |
| hsa01232 | Liver | Cirrhotic | Nucleotide metabolism | 39/2530 | 85/8465 | 1.27e-03 | 6.73e-03 | 4.15e-03 | 39 |
| hsa012401 | Liver | Cirrhotic | Biosynthesis of cofactors | 66/2530 | 153/8465 | 3.11e-04 | 1.99e-03 | 1.23e-03 | 66 |
| hsa012321 | Liver | Cirrhotic | Nucleotide metabolism | 39/2530 | 85/8465 | 1.27e-03 | 6.73e-03 | 4.15e-03 | 39 |
| hsa012402 | Liver | HCC | Biosynthesis of cofactors | 103/4020 | 153/8465 | 4.67e-07 | 5.05e-06 | 2.81e-06 | 103 |
| hsa012322 | Liver | HCC | Nucleotide metabolism | 59/4020 | 85/8465 | 3.30e-05 | 1.88e-04 | 1.04e-04 | 59 |
| hsa012403 | Liver | HCC | Biosynthesis of cofactors | 103/4020 | 153/8465 | 4.67e-07 | 5.05e-06 | 2.81e-06 | 103 |
| hsa012323 | Liver | HCC | Nucleotide metabolism | 59/4020 | 85/8465 | 3.30e-05 | 1.88e-04 | 1.04e-04 | 59 |
| hsa012324 | Oral cavity | OSCC | Nucleotide metabolism | 54/3704 | 85/8465 | 1.78e-04 | 5.95e-04 | 3.03e-04 | 54 |
| hsa012404 | Oral cavity | OSCC | Biosynthesis of cofactors | 88/3704 | 153/8465 | 3.84e-04 | 1.20e-03 | 6.12e-04 | 88 |
| hsa0123211 | Oral cavity | OSCC | Nucleotide metabolism | 54/3704 | 85/8465 | 1.78e-04 | 5.95e-04 | 3.03e-04 | 54 |
| hsa0124011 | Oral cavity | OSCC | Biosynthesis of cofactors | 88/3704 | 153/8465 | 3.84e-04 | 1.20e-03 | 6.12e-04 | 88 |
| Page: 1 |
Top |
Cell-cell communication analysis |
| Identification of potential cell-cell interactions between two cell types and their ligand-receptor pairs for different disease states |
| Ligand | Receptor | LRpair | Pathway | Tissue | Disease Stage |
| Page: 1 |
Top |
Single-cell gene regulatory network inference analysis |
| Find out the significant the regulons (TFs) and the target genes of each regulon across cell types for different disease states |
| TF | Cell Type | Tissue | Disease Stage | Target Gene | RSS | Regulon Activity |
| ∗The dot plots of a searched regulon are shown for all cell subpopulations in each disease state of each tissue based on the regulon specific score inferred using pySCENIC and by calculating the average expression. |
| Page: 1 |
Top |
Somatic mutation of malignant transformation related genes |
| Annotation of somatic variants for genes involved in malignant transformation |
| Hugo Symbol | Variant Class | Variant Classification | dbSNP RS | HGVSc | HGVSp | HGVSp Short | SWISSPROT | BIOTYPE | SIFT | PolyPhen | Tumor Sample Barcode | Tissue | Histology | Sex | Age | Stage | Therapy Types | Drugs | Outcome |
| AK4 | SNV | Missense_Mutation | c.262G>A | p.Asp88Asn | p.D88N | P27144 | protein_coding | deleterious(0.02) | probably_damaging(0.966) | TCGA-A8-A08L-01 | Breast | breast invasive carcinoma | Female | >=65 | III/IV | Unknown | Unknown | SD | |
| AK4 | SNV | Missense_Mutation | rs765366640 | c.451G>A | p.Val151Ile | p.V151I | P27144 | protein_coding | tolerated(0.66) | benign(0) | TCGA-A6-6650-01 | Colorectum | colon adenocarcinoma | Female | >=65 | I/II | Unknown | Unknown | SD |
| AK4 | SNV | Missense_Mutation | rs776921061 | c.563G>A | p.Arg188Gln | p.R188Q | P27144 | protein_coding | tolerated(0.16) | benign(0.001) | TCGA-AA-3495-01 | Colorectum | colon adenocarcinoma | Male | >=65 | I/II | Unknown | Unknown | SD |
| AK4 | SNV | Missense_Mutation | c.529N>A | p.Val177Met | p.V177M | P27144 | protein_coding | tolerated(0.1) | possibly_damaging(0.557) | TCGA-CM-6678-01 | Colorectum | colon adenocarcinoma | Female | <65 | I/II | Chemotherapy | fluorouracil | SD | |
| AK4 | SNV | Missense_Mutation | c.510N>T | p.Arg170Ser | p.R170S | P27144 | protein_coding | deleterious(0) | possibly_damaging(0.827) | TCGA-DC-6154-01 | Colorectum | rectum adenocarcinoma | Female | <65 | I/II | Chemotherapy | 5-fluorouracil | SD | |
| AK4 | SNV | Missense_Mutation | rs138516264 | c.560G>A | p.Ser187Asn | p.S187N | P27144 | protein_coding | tolerated(0.2) | benign(0) | TCGA-F5-6814-01 | Colorectum | rectum adenocarcinoma | Male | <65 | I/II | Unknown | Unknown | SD |
| AK4 | insertion | Frame_Shift_Ins | novel | c.664_665insAT | p.Ala222AspfsTer30 | p.A222Dfs*30 | P27144 | protein_coding | TCGA-AM-5820-01 | Colorectum | colon adenocarcinoma | Female | <65 | I/II | Unknown | Unknown | SD | ||
| AK4 | insertion | Nonsense_Mutation | novel | c.665_666insCTAG | p.Tyr223Ter | p.Y223* | P27144 | protein_coding | TCGA-AM-5820-01 | Colorectum | colon adenocarcinoma | Female | <65 | I/II | Unknown | Unknown | SD | ||
| AK4 | SNV | Missense_Mutation | novel | c.332N>T | p.Ser111Ile | p.S111I | P27144 | protein_coding | deleterious(0.03) | benign(0.316) | TCGA-A5-A0G2-01 | Endometrium | uterine corpus endometrioid carcinoma | Female | <65 | III/IV | Unknown | Unknown | SD |
| AK4 | SNV | Missense_Mutation | novel | c.289G>T | p.Ala97Ser | p.A97S | P27144 | protein_coding | deleterious(0.02) | possibly_damaging(0.693) | TCGA-A5-A1OF-01 | Endometrium | uterine corpus endometrioid carcinoma | Female | <65 | I/II | Unknown | Unknown | SD |
| Page: 1 2 3 4 |
Top |
Related drugs of malignant transformation related genes |
| Identification of chemicals and drugs interact with genes involved in malignant transfromation |
| (DGIdb 4.0) |
| Entrez ID | Symbol | Category | Interaction Types | Drug Claim Name | Drug Name | PMIDs |
| 205 | AK4 | ENZYME, KINASE | tenofovir | TENOFOVIR | ||
| 205 | AK4 | ENZYME, KINASE | adefovir dipivoxil |
| Page: 1 |

Copyright 2023-Present -The University of Texas Health Science Center at Houston |