Schematic overview of the cellular and molecular mechanisms involved in the cancer progression, including the proposed cellular and molecular mechanisms in cancer cells trajectory. AT1: alveolar type 1 cells; AT2: alveolar type 2 cells; AAH: atypical adenomatous hyperplasia; AIS: adenocarcinoma in situ; MIA: minimally invasive adenocarcinoma; IA: invasive adenocarcinoma; EMT: epithelial-mesenchymal transition

Home

Download

Statistics

Help

Contact

Center for Computational Systems Medicine
leaf

Gene summary

leaf

Malignant transformation analysis

leaf

Malignant transformation related pathway analysis

leaf

Cell-cell communication analysis

leaf

Single-cell gene regulatory network inference analysis

leaf

Somatic mutation of malignant transformation related genes

leaf

Related drugs of malignant transformation related genes

Gene: AIMP1

Gene summary for AIMP1

check button Gene summary.

Gene informationSpeciesHuman
Gene symbol

AIMP1

Gene ID

9255

Gene nameaminoacyl tRNA synthetase complex interacting multifunctional protein 1
Gene AliasEMAP2
Cytomap4q24
Gene Typeprotein-coding
GO ID

GO:0001525

UniProtAcc

B4DNK3


Top

Malignant transformation analysis

check button Identification of the aberrant gene expression in precancerous and cancerous lesions by comparing the gene expression of stem-like cells in diseased tissues with normal stem cells
check button Malignant transformation involving gene list.
Entrez IDSymbolReplicatesSpeciesOrganTissueAdj P-valueLog2FCMalignancy
9255AIMP1LZE2THumanEsophagusESCC7.50e-037.77e-010.082
9255AIMP1LZE4THumanEsophagusESCC8.24e-164.73e-010.0811
9255AIMP1LZE5THumanEsophagusESCC2.69e-035.60e-010.0514
9255AIMP1LZE7THumanEsophagusESCC3.83e-055.54e-010.0667
9255AIMP1LZE8THumanEsophagusESCC3.67e-062.77e-010.067
9255AIMP1LZE20THumanEsophagusESCC5.05e-092.43e-010.0662
9255AIMP1LZE24THumanEsophagusESCC9.85e-166.11e-010.0596
9255AIMP1LZE21THumanEsophagusESCC2.98e-066.28e-010.0655
9255AIMP1P1T-EHumanEsophagusESCC1.17e-136.76e-010.0875
9255AIMP1P2T-EHumanEsophagusESCC4.72e-327.39e-010.1177
9255AIMP1P4T-EHumanEsophagusESCC2.04e-381.03e+000.1323
9255AIMP1P5T-EHumanEsophagusESCC4.89e-337.80e-010.1327
9255AIMP1P8T-EHumanEsophagusESCC3.33e-367.76e-010.0889
9255AIMP1P9T-EHumanEsophagusESCC2.76e-236.51e-010.1131
9255AIMP1P10T-EHumanEsophagusESCC4.51e-304.94e-010.116
9255AIMP1P11T-EHumanEsophagusESCC5.05e-126.36e-010.1426
9255AIMP1P12T-EHumanEsophagusESCC4.70e-316.22e-010.1122
9255AIMP1P15T-EHumanEsophagusESCC6.06e-348.18e-010.1149
9255AIMP1P16T-EHumanEsophagusESCC1.62e-336.59e-010.1153
9255AIMP1P17T-EHumanEsophagusESCC2.35e-128.76e-010.1278
Page: 1 2 3 4 5 6 7 

check button Transcriptomic changes along malignancy continuum.
TissueExpression DynamicsAbbreviation
EsophagusThe image shows the transcriptomic changes along malignancy continuum.log2FC in expression of this searched gene in stem-like cells from each diseased tissue sample relative to stem-like cells in normal samples in each tissue plotted against the malignancy continuum. Samples are colored based on if they are from different disease stage.
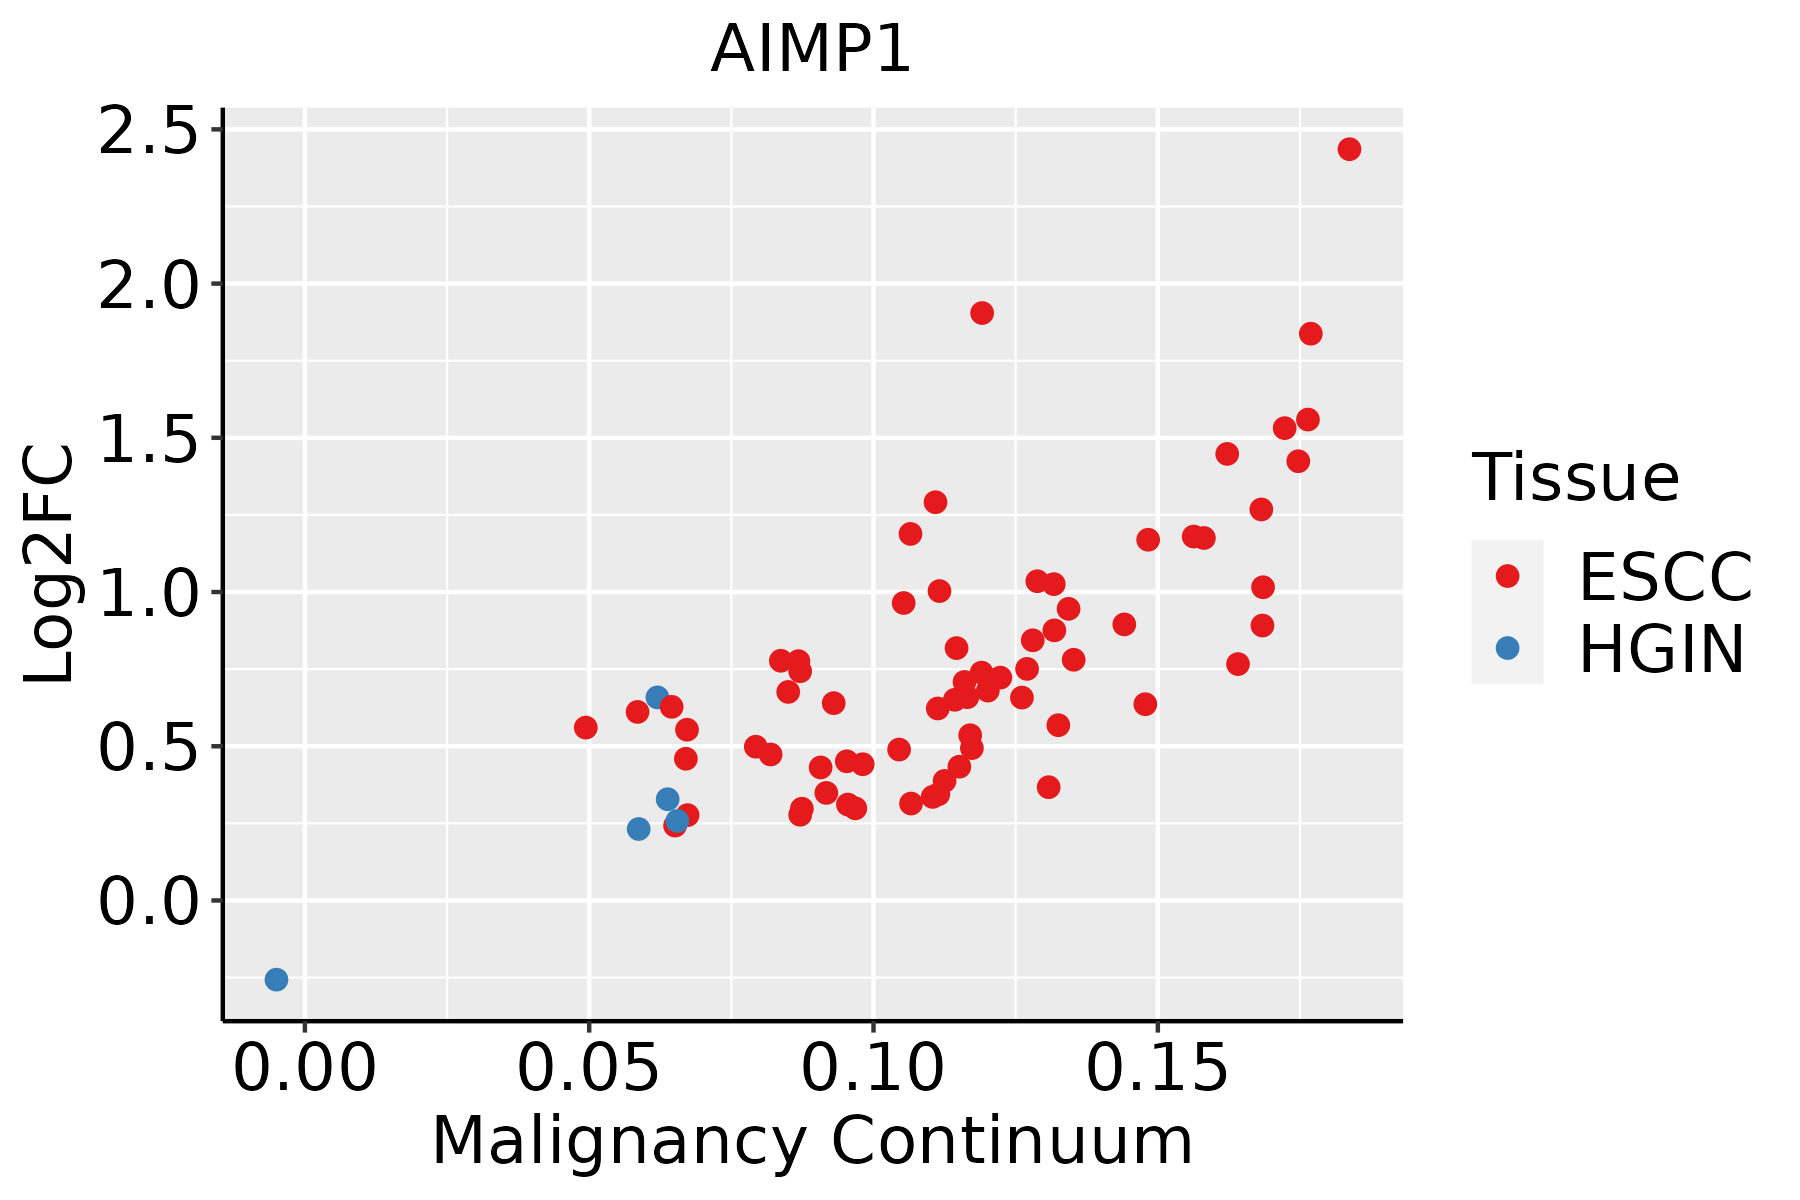
ESCC: Esophageal squamous cell carcinoma
HGIN: High-grade intraepithelial neoplasias
LGIN: Low-grade intraepithelial neoplasias
LiverThe image shows the transcriptomic changes along malignancy continuum.log2FC in expression of this searched gene in stem-like cells from each diseased tissue sample relative to stem-like cells in normal samples in each tissue plotted against the malignancy continuum. Samples are colored based on if they are from different disease stage.
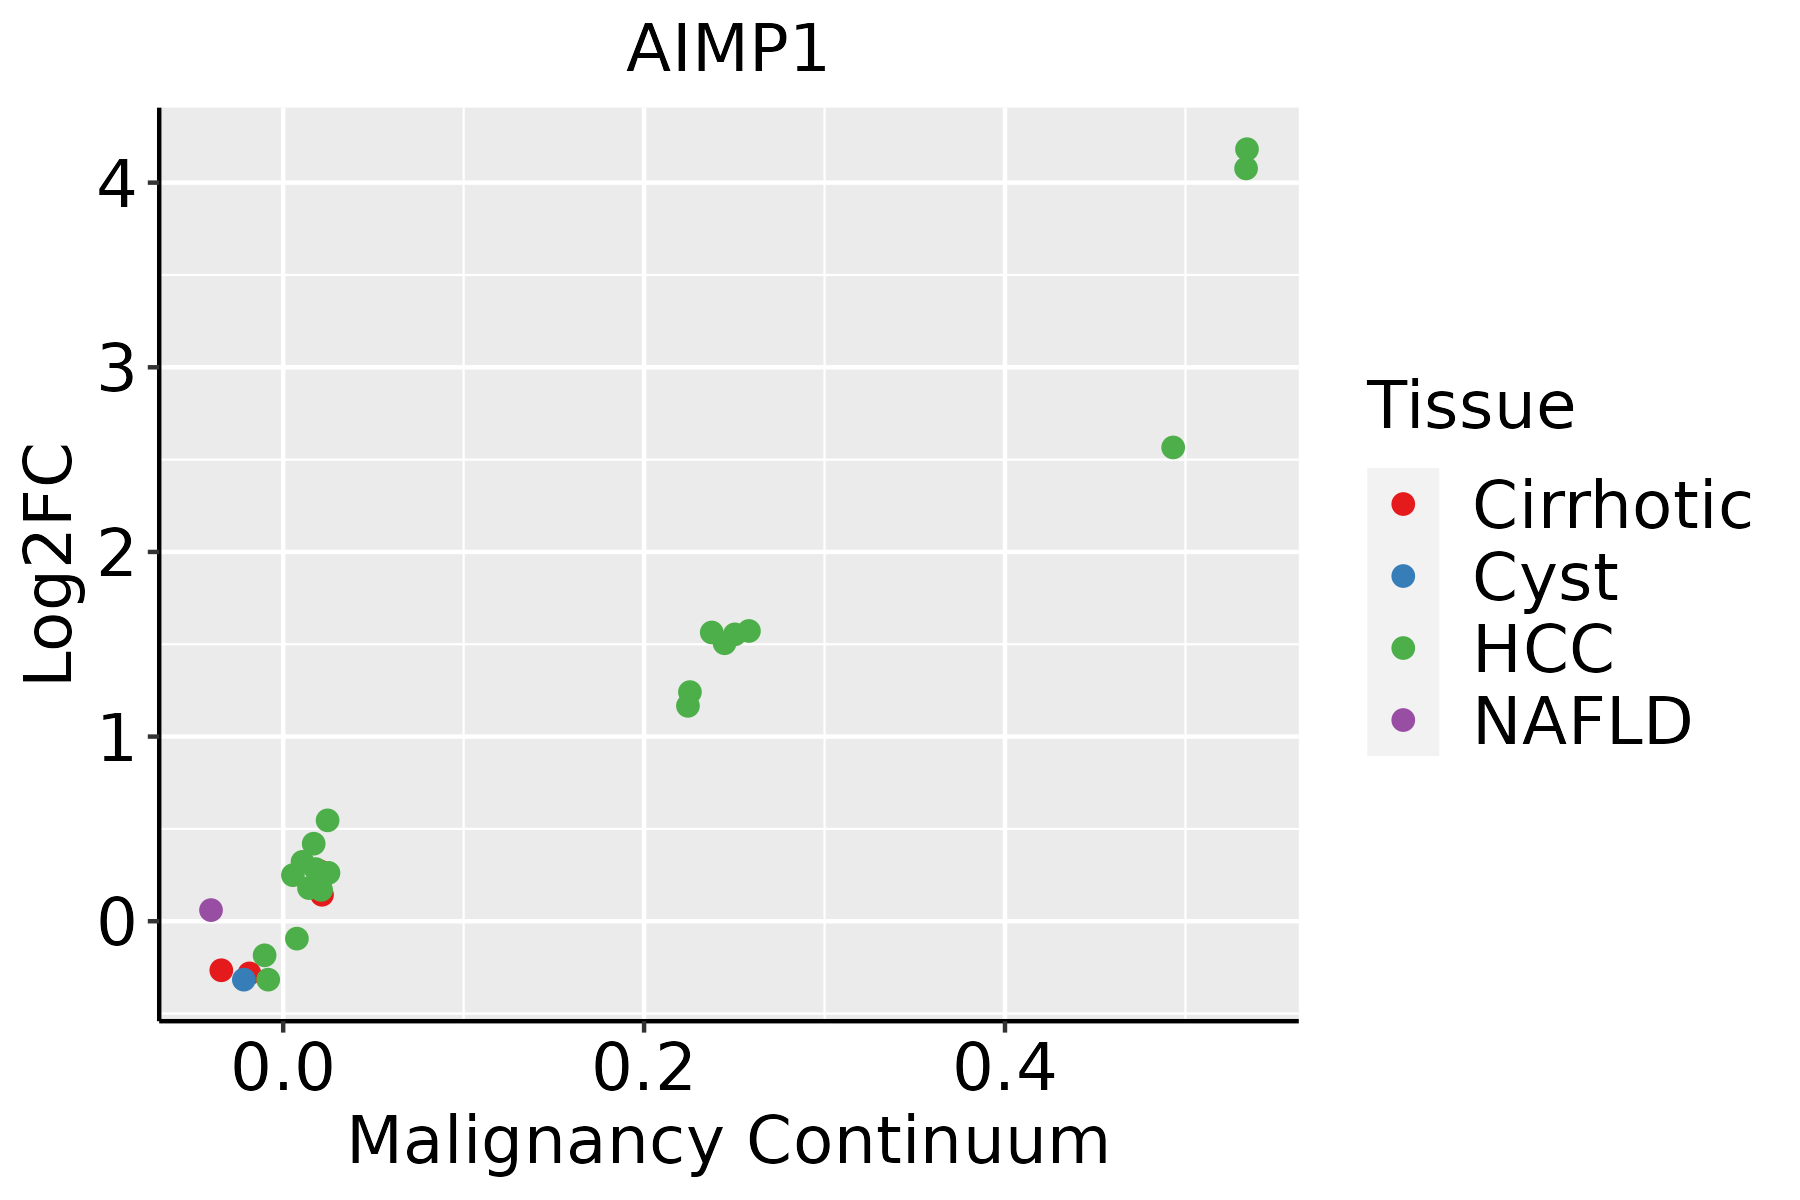
HCC: Hepatocellular carcinoma
NAFLD: Non-alcoholic fatty liver disease
Oral CavityThe image shows the transcriptomic changes along malignancy continuum.log2FC in expression of this searched gene in stem-like cells from each diseased tissue sample relative to stem-like cells in normal samples in each tissue plotted against the malignancy continuum. Samples are colored based on if they are from different disease stage.EOLP: Erosive Oral lichen planus
LP: leukoplakia
NEOLP: Non-erosive oral lichen planus
OSCC: Oral squamous cell carcinoma
ProstateThe image shows the transcriptomic changes along malignancy continuum.log2FC in expression of this searched gene in stem-like cells from each diseased tissue sample relative to stem-like cells in normal samples in each tissue plotted against the malignancy continuum. Samples are colored based on if they are from different disease stage.BPH: Benign Prostatic Hyperplasia
SkinThe image shows the transcriptomic changes along malignancy continuum.log2FC in expression of this searched gene in stem-like cells from each diseased tissue sample relative to stem-like cells in normal samples in each tissue plotted against the malignancy continuum. Samples are colored based on if they are from different disease stage.
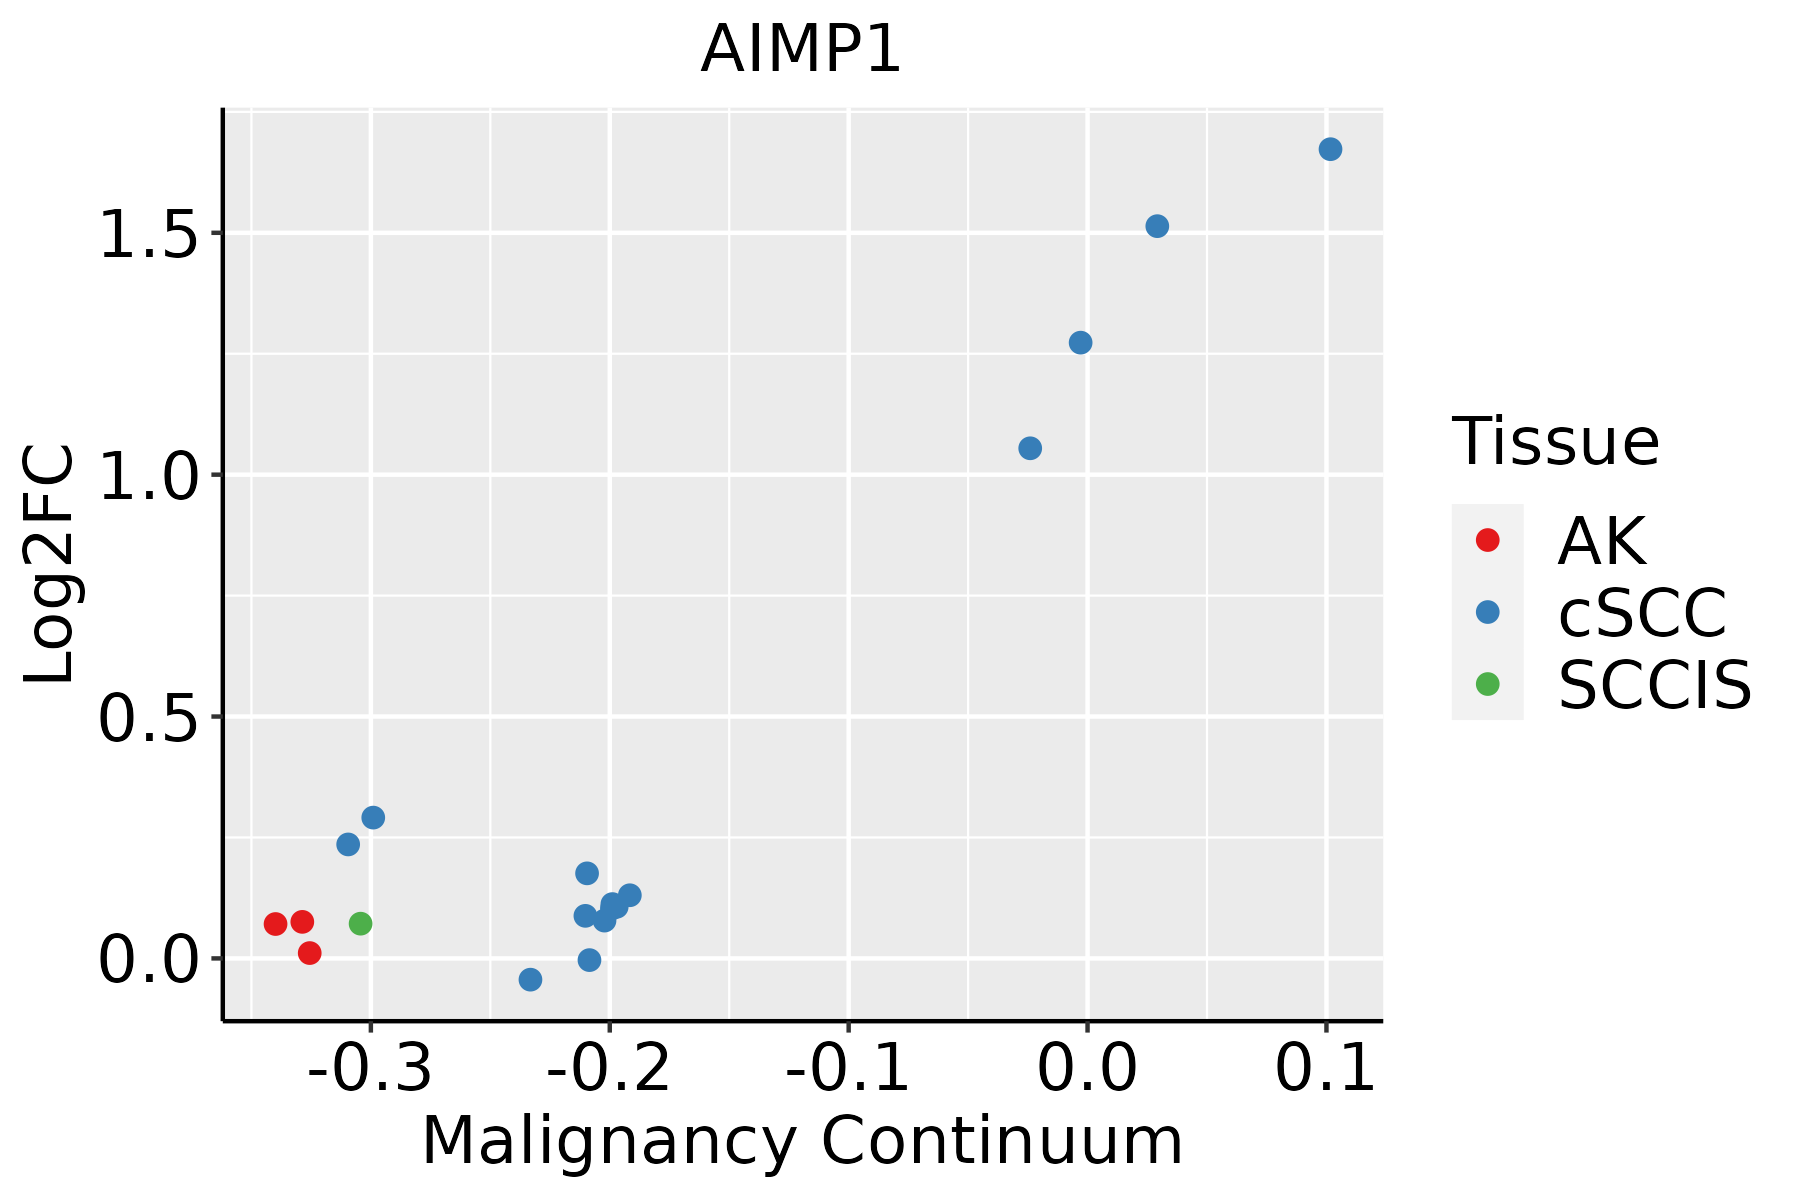
AK: Actinic keratosis
cSCC: Cutaneous squamous cell carcinoma
SCCIS:squamous cell carcinoma in situ
ThyroidThe image shows the transcriptomic changes along malignancy continuum.log2FC in expression of this searched gene in stem-like cells from each diseased tissue sample relative to stem-like cells in normal samples in each tissue plotted against the malignancy continuum. Samples are colored based on if they are from different disease stage.
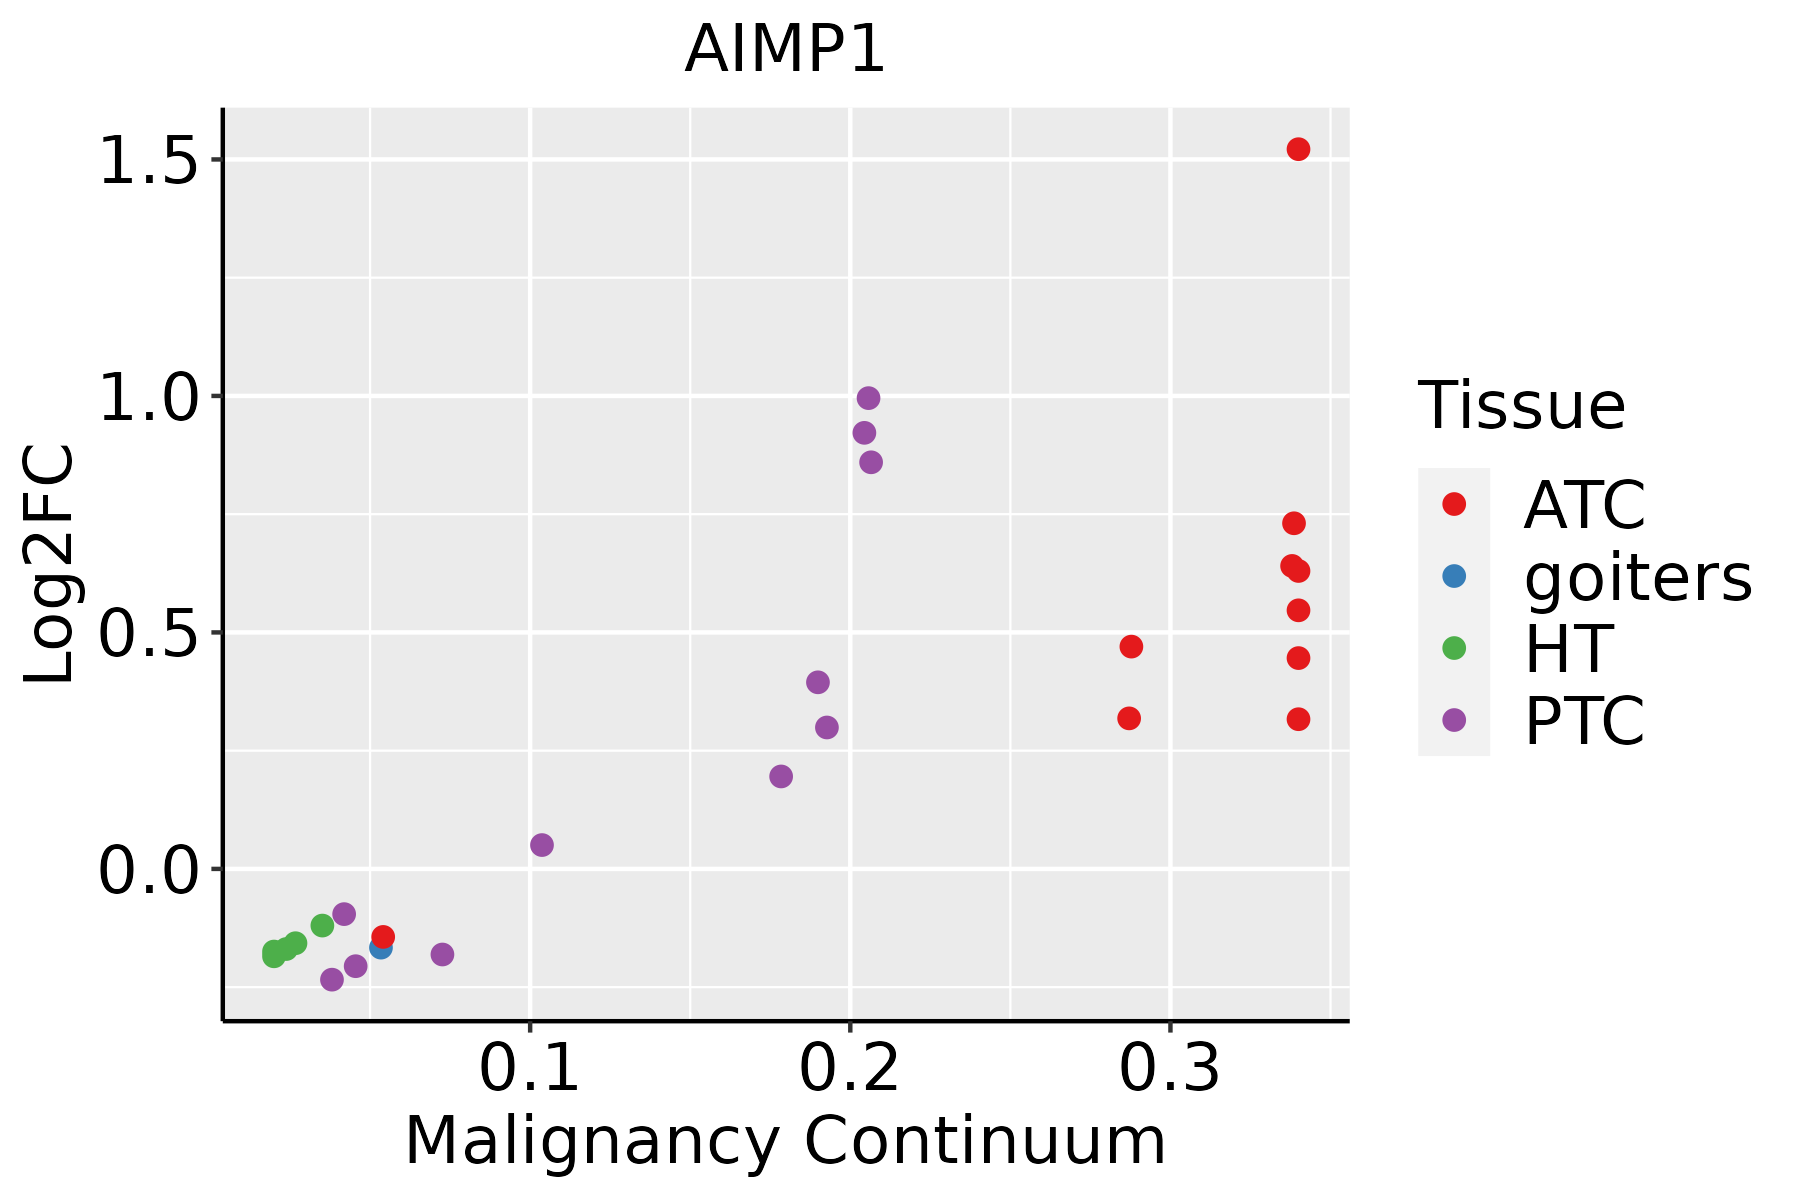
ATC: Anaplastic thyroid cancer
HT: Hashimoto's thyroiditis
PTC: Papillary thyroid cancer
∗log2FC in expression of this searched gene in stem-like cells from each diseased tissue sample relative to stem-like cells in normal samples in each tissue plotted against the malignancy continuum. Samples are colored based on if they are from different disease stage.

Top

Malignant transformation related pathway analysis

check buttonFind out the enriched GO biological processes and KEGG pathways involved in transition from healthy to precancer to cancer
check button Figure of enriched GO biological processes.
TissueDisease StageEnriched GO biological Processes
ColorectumADGO analysis - Figure of enriched GO biological processes: Top 15 enriched GO BP terms are showed in the bar plot of each disease state in each tissue. Each row represents a significant GO biological process which is colored according to the -log10(p.adjust).
ColorectumSERGO analysis - Figure of enriched GO biological processes: Top 15 enriched GO BP terms are showed in the bar plot of each disease state in each tissue. Each row represents a significant GO biological process which is colored according to the -log10(p.adjust).
ColorectumMSSGO analysis - Figure of enriched GO biological processes: Top 15 enriched GO BP terms are showed in the bar plot of each disease state in each tissue. Each row represents a significant GO biological process which is colored according to the -log10(p.adjust).
ColorectumMSI-HGO analysis - Figure of enriched GO biological processes: Top 15 enriched GO BP terms are showed in the bar plot of each disease state in each tissue. Each row represents a significant GO biological process which is colored according to the -log10(p.adjust).
ColorectumFAPGO analysis - Figure of enriched GO biological processes: Top 15 enriched GO BP terms are showed in the bar plot of each disease state in each tissue. Each row represents a significant GO biological process which is colored according to the -log10(p.adjust).
∗Top 15 enriched GO BP terms are showed in the bar plot of each disease state in each tissue. Each row represents a significant GO biological process which is colored according to the -log10(p.adjust).
Page: 1 2 3 4 5 6 7 8 9 

check button Enriched GO biological processes.
GO IDTissueDisease StageDescriptionGene RatioBg Ratiopvaluep.adjustCount
GO:000961518EsophagusESCCresponse to virus238/8552367/187236.65e-143.32e-12238
GO:00516075EsophagusESCCdefense response to virus171/8552265/187233.91e-101.05e-08171
GO:01405465EsophagusESCCdefense response to symbiont171/8552265/187233.91e-101.05e-08171
GO:005067318EsophagusESCCepithelial cell proliferation238/8552437/187231.19e-048.20e-04238
GO:005067817EsophagusESCCregulation of epithelial cell proliferation206/8552381/187235.51e-043.02e-03206
GO:00096155LiverCirrhoticresponse to virus126/4634367/187232.10e-052.77e-04126
GO:0051607LiverCirrhoticdefense response to virus84/4634265/187236.02e-033.00e-0284
GO:0140546LiverCirrhoticdefense response to symbiont84/4634265/187236.02e-033.00e-0284
GO:000961511LiverHCCresponse to virus210/7958367/187237.32e-091.86e-07210
GO:00516071LiverHCCdefense response to virus151/7958265/187231.27e-061.85e-05151
GO:01405461LiverHCCdefense response to symbiont151/7958265/187231.27e-061.85e-05151
GO:000961515Oral cavityOSCCresponse to virus215/7305367/187231.63e-149.41e-13215
GO:00516074Oral cavityOSCCdefense response to virus154/7305265/187231.96e-105.63e-09154
GO:01405464Oral cavityOSCCdefense response to symbiont154/7305265/187231.96e-105.63e-09154
GO:005067310Oral cavityOSCCepithelial cell proliferation212/7305437/187232.82e-052.61e-04212
GO:005090010Oral cavityOSCCleukocyte migration176/7305369/187233.80e-042.31e-03176
GO:005067810Oral cavityOSCCregulation of epithelial cell proliferation180/7305381/187235.88e-043.35e-03180
GO:000961516Oral cavityLPresponse to virus143/4623367/187237.42e-103.52e-08143
GO:005160711Oral cavityLPdefense response to virus97/4623265/187239.31e-061.74e-0497
GO:014054611Oral cavityLPdefense response to symbiont97/4623265/187239.31e-061.74e-0497
Page: 1 2 3 

check button Enriched KEGG pathways.
Pathway IDTissueDisease StageDescriptionGene RatioBg Ratiopvaluep.adjustqvalueCount
Page: 1 

Top

Cell-cell communication analysis

check buttonIdentification of potential cell-cell interactions between two cell types and their ligand-receptor pairs for different disease states
LigandReceptorLRpairPathwayTissueDisease Stage
Page: 1 

Top

Single-cell gene regulatory network inference analysis

check buttonFind out the significant the regulons (TFs) and the target genes of each regulon across cell types for different disease states
TFCell TypeTissueDisease StageTarget GeneRSSRegulon Activity
∗The dot plots of a searched regulon are shown for all cell subpopulations in each disease state of each tissue based on the regulon specific score inferred using pySCENIC and by calculating the average expression.
Page: 1 

Top

Somatic mutation of malignant transformation related genes

check buttonAnnotation of somatic variants for genes involved in malignant transformation
Hugo SymbolVariant ClassVariant ClassificationdbSNP RSHGVScHGVSpHGVSp ShortSWISSPROTBIOTYPESIFTPolyPhenTumor Sample BarcodeTissueHistologySexAgeStageTherapy TypesDrugsOutcome
AIMP1SNVMissense_Mutationrs770399051c.343N>Gp.Met115Valp.M115VQ12904protein_codingtolerated(0.36)benign(0)TCGA-A2-A1FW-01Breastbreast invasive carcinomaFemale<65III/IVChemotherapycytoxanSD
AIMP1insertionNonsense_Mutationnovelc.836_837insCTACATGTTAGTTGCATGATGCATGATGCTGAAATTGTTAAATGAp.Ala279_Phe280insTyrMetLeuValAlaTerCysMetMetLeuLysLeuLeuAsnAspp.A279_F280insYMLVA*CMMLKLLNDQ12904protein_codingTCGA-A7-A0CJ-01Breastbreast invasive carcinomaFemale<65I/IIChemotherapycytoxanSD
AIMP1SNVMissense_Mutationrs564105201c.989T>Cp.Met330Thrp.M330TQ12904protein_codingdeleterious(0)probably_damaging(0.999)TCGA-2W-A8YY-01Cervixcervical & endocervical cancerFemale<65I/IIChemotherapycisplatinCR
AIMP1SNVMissense_Mutationc.385N>Ap.Val129Ilep.V129IQ12904protein_codingtolerated(0.27)benign(0.001)TCGA-WS-AB45-01Colorectumcolon adenocarcinomaFemale<65I/IIUnknownUnknownSD
AIMP1SNVMissense_Mutationnovelc.821G>Tp.Arg274Ilep.R274IQ12904protein_codingdeleterious(0.04)possibly_damaging(0.724)TCGA-A5-A0G2-01Endometriumuterine corpus endometrioid carcinomaFemale<65III/IVUnknownUnknownSD
AIMP1SNVMissense_Mutationnovelc.193N>Cp.Thr65Prop.T65PQ12904protein_codingtolerated(0.09)probably_damaging(0.984)TCGA-A5-A2K5-01Endometriumuterine corpus endometrioid carcinomaFemale>=65I/IIUnknownUnknownSD
AIMP1SNVMissense_Mutationrs747675209c.218N>Ap.Arg73Glnp.R73QQ12904protein_codingtolerated(0.44)benign(0.261)TCGA-AP-A056-01Endometriumuterine corpus endometrioid carcinomaFemale<65I/IIUnknownUnknownSD
AIMP1SNVMissense_Mutationnovelc.685N>Tp.Arg229Trpp.R229WQ12904protein_codingdeleterious(0.02)probably_damaging(1)TCGA-AP-A1DV-01Endometriumuterine corpus endometrioid carcinomaFemale<65I/IIUnknownUnknownSD
AIMP1SNVMissense_Mutationrs143219988c.590C>Ap.Ser197Tyrp.S197YQ12904protein_codingdeleterious(0)possibly_damaging(0.789)TCGA-AX-A06F-01Endometriumuterine corpus endometrioid carcinomaFemale<65III/IVChemotherapycarboplatinSD
AIMP1SNVMissense_Mutationnovelc.980C>Ap.Ala327Aspp.A327DQ12904protein_codingdeleterious(0)probably_damaging(0.997)TCGA-AX-A06F-01Endometriumuterine corpus endometrioid carcinomaFemale<65III/IVChemotherapycarboplatinSD
Page: 1 2 3 4 

Top

Related drugs of malignant transformation related genes

check buttonIdentification of chemicals and drugs interact with genes involved in malignant transfromation
(DGIdb 4.0)
Entrez IDSymbolCategoryInteraction TypesDrug Claim NameDrug NamePMIDs
Page: 1