
|
|||||
|
 | |
| |
| |
| |
| |
| |
|
Gene: AIM2 |
Gene summary for AIM2 |
| Gene information | Species | Human | Gene symbol | AIM2 | Gene ID | 9447 |
| Gene name | absent in melanoma 2 | |
| Gene Alias | PYHIN4 | |
| Cytomap | 1q23.1-q23.2 | |
| Gene Type | protein-coding | GO ID | GO:0001816 | UniProtAcc | O14862 |
Top |
Malignant transformation analysis |
| Identification of the aberrant gene expression in precancerous and cancerous lesions by comparing the gene expression of stem-like cells in diseased tissues with normal stem cells |
| Entrez ID | Symbol | Replicates | Species | Organ | Tissue | Adj P-value | Log2FC | Malignancy |
| 9447 | AIM2 | CCI_2 | Human | Cervix | CC | 4.35e-09 | 7.12e-01 | 0.5249 |
| 9447 | AIM2 | CCI_3 | Human | Cervix | CC | 5.69e-03 | 3.17e-01 | 0.516 |
| 9447 | AIM2 | Tumor | Human | Cervix | CC | 5.01e-33 | 5.87e-01 | 0.1241 |
| 9447 | AIM2 | sample1 | Human | Cervix | CC | 3.87e-03 | 2.52e-01 | 0.0959 |
| 9447 | AIM2 | sample3 | Human | Cervix | CC | 1.51e-27 | 5.47e-01 | 0.1387 |
| 9447 | AIM2 | T1 | Human | Cervix | CC | 3.38e-05 | 2.35e-01 | 0.0918 |
| 9447 | AIM2 | T3 | Human | Cervix | CC | 2.57e-28 | 4.86e-01 | 0.1389 |
| 9447 | AIM2 | LZE8T | Human | Esophagus | ESCC | 4.02e-05 | 2.63e-01 | 0.067 |
| 9447 | AIM2 | LZE6T | Human | Esophagus | ESCC | 1.62e-02 | 1.53e-01 | 0.0845 |
| 9447 | AIM2 | P2T-E | Human | Esophagus | ESCC | 4.71e-04 | 5.50e-02 | 0.1177 |
| 9447 | AIM2 | P5T-E | Human | Esophagus | ESCC | 5.49e-16 | 3.43e-01 | 0.1327 |
| 9447 | AIM2 | P8T-E | Human | Esophagus | ESCC | 2.11e-07 | 1.81e-01 | 0.0889 |
| 9447 | AIM2 | P11T-E | Human | Esophagus | ESCC | 4.80e-15 | 6.93e-01 | 0.1426 |
| 9447 | AIM2 | P17T-E | Human | Esophagus | ESCC | 1.29e-08 | 7.23e-01 | 0.1278 |
| 9447 | AIM2 | P20T-E | Human | Esophagus | ESCC | 3.20e-07 | 5.15e-01 | 0.1124 |
| 9447 | AIM2 | P22T-E | Human | Esophagus | ESCC | 1.96e-02 | 7.37e-02 | 0.1236 |
| 9447 | AIM2 | P23T-E | Human | Esophagus | ESCC | 5.52e-07 | 1.90e-01 | 0.108 |
| 9447 | AIM2 | P24T-E | Human | Esophagus | ESCC | 3.97e-18 | 6.37e-01 | 0.1287 |
| 9447 | AIM2 | P31T-E | Human | Esophagus | ESCC | 1.07e-12 | 3.03e-01 | 0.1251 |
| 9447 | AIM2 | P32T-E | Human | Esophagus | ESCC | 4.29e-17 | 5.11e-01 | 0.1666 |
| Page: 1 2 3 |
| Tissue | Expression Dynamics | Abbreviation |
| Cervix | 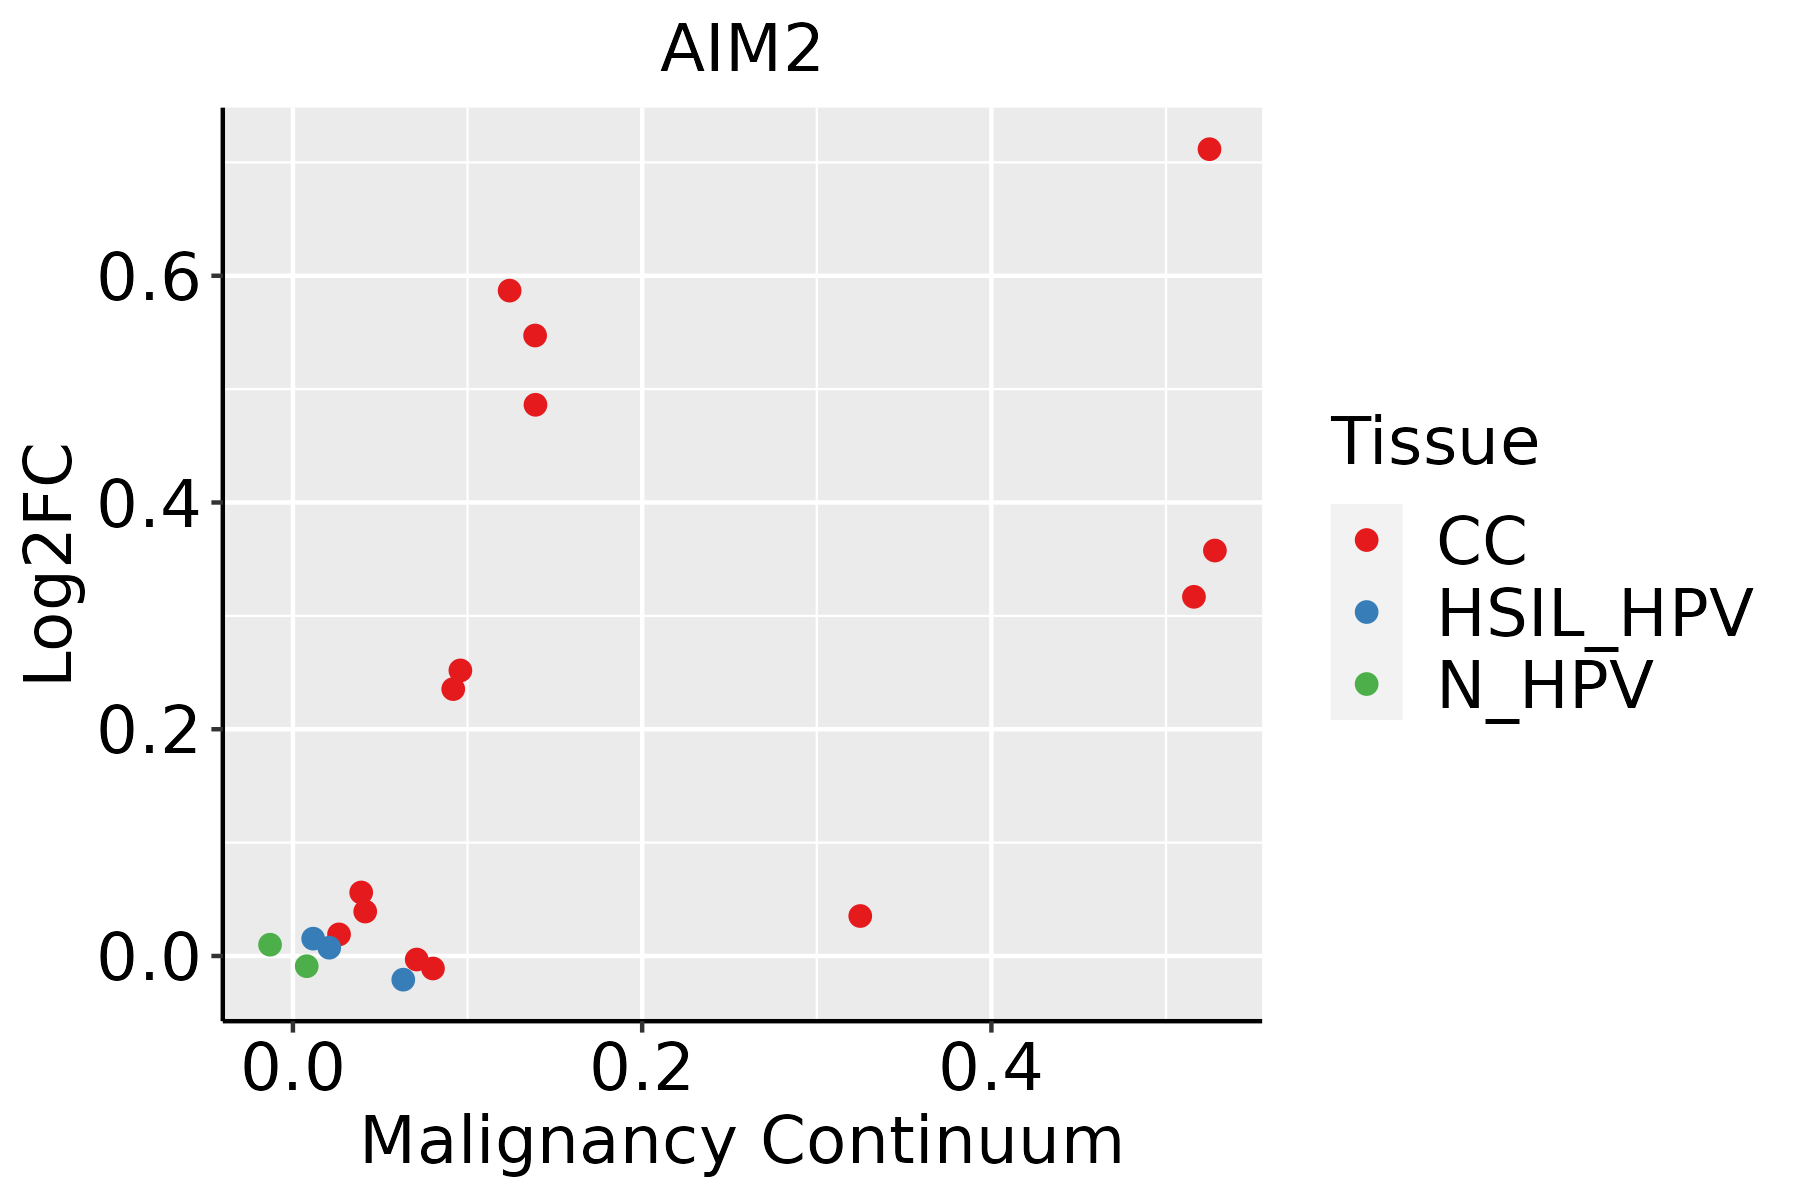 | CC: Cervix cancer |
| HSIL_HPV: HPV-infected high-grade squamous intraepithelial lesions | ||
| N_HPV: HPV-infected normal cervix | ||
| Esophagus | 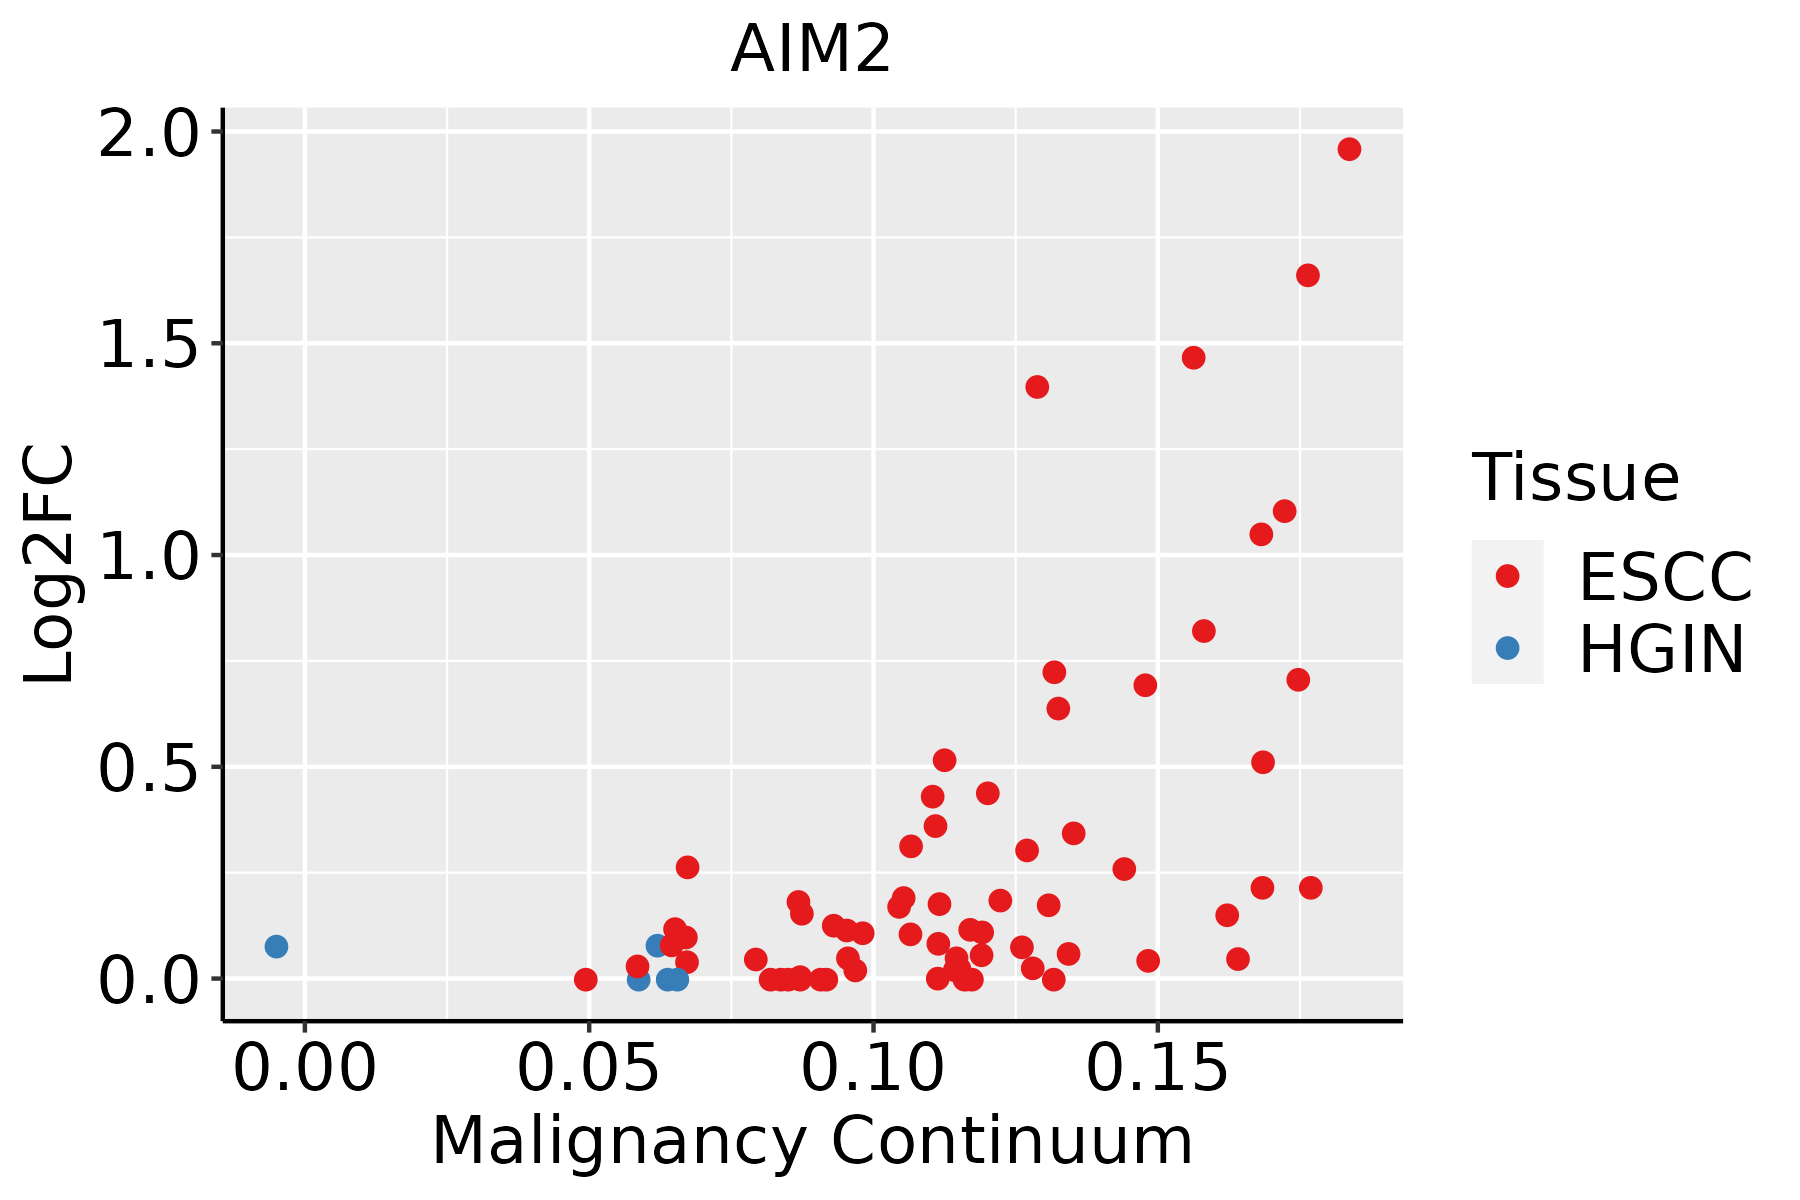 | ESCC: Esophageal squamous cell carcinoma |
| HGIN: High-grade intraepithelial neoplasias | ||
| LGIN: Low-grade intraepithelial neoplasias | ||
| Oral Cavity | 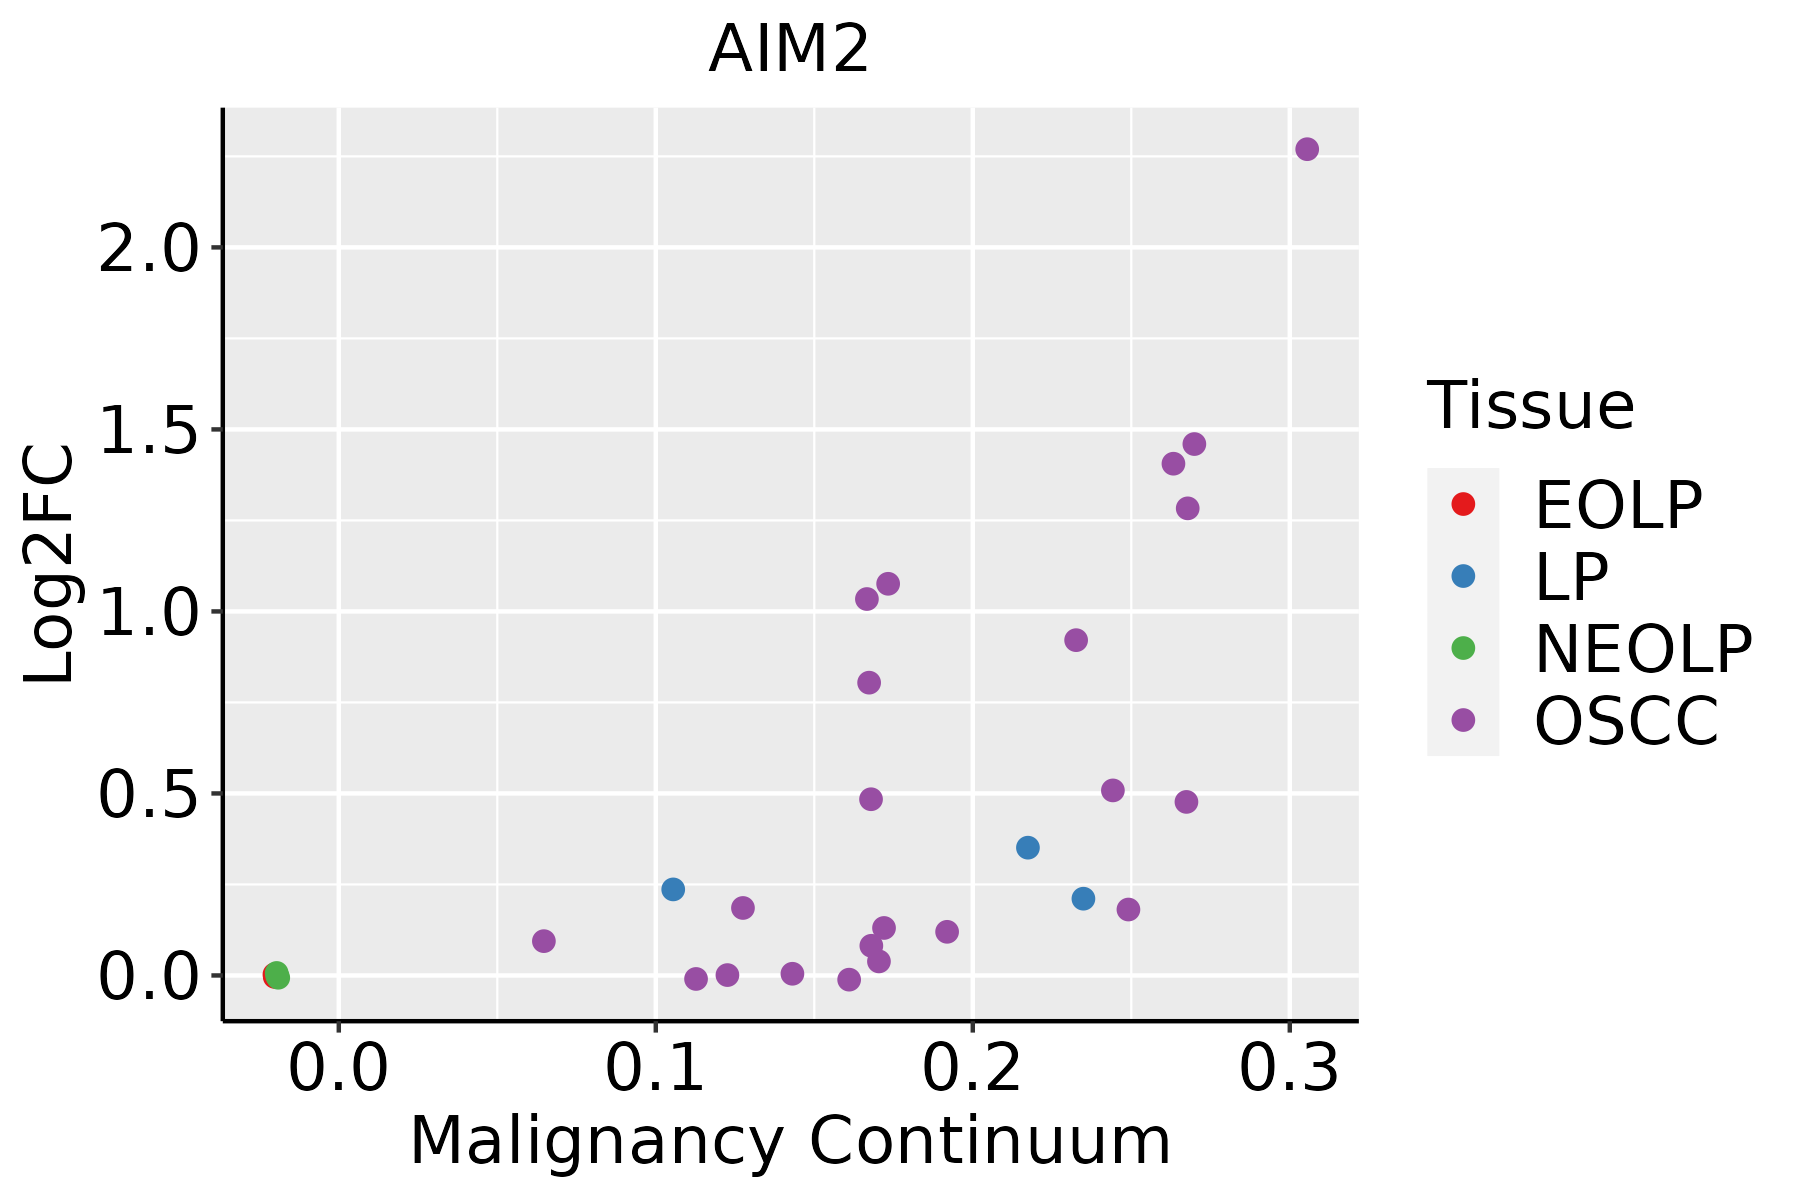 | EOLP: Erosive Oral lichen planus |
| LP: leukoplakia | ||
| NEOLP: Non-erosive oral lichen planus | ||
| OSCC: Oral squamous cell carcinoma | ||
| Skin | 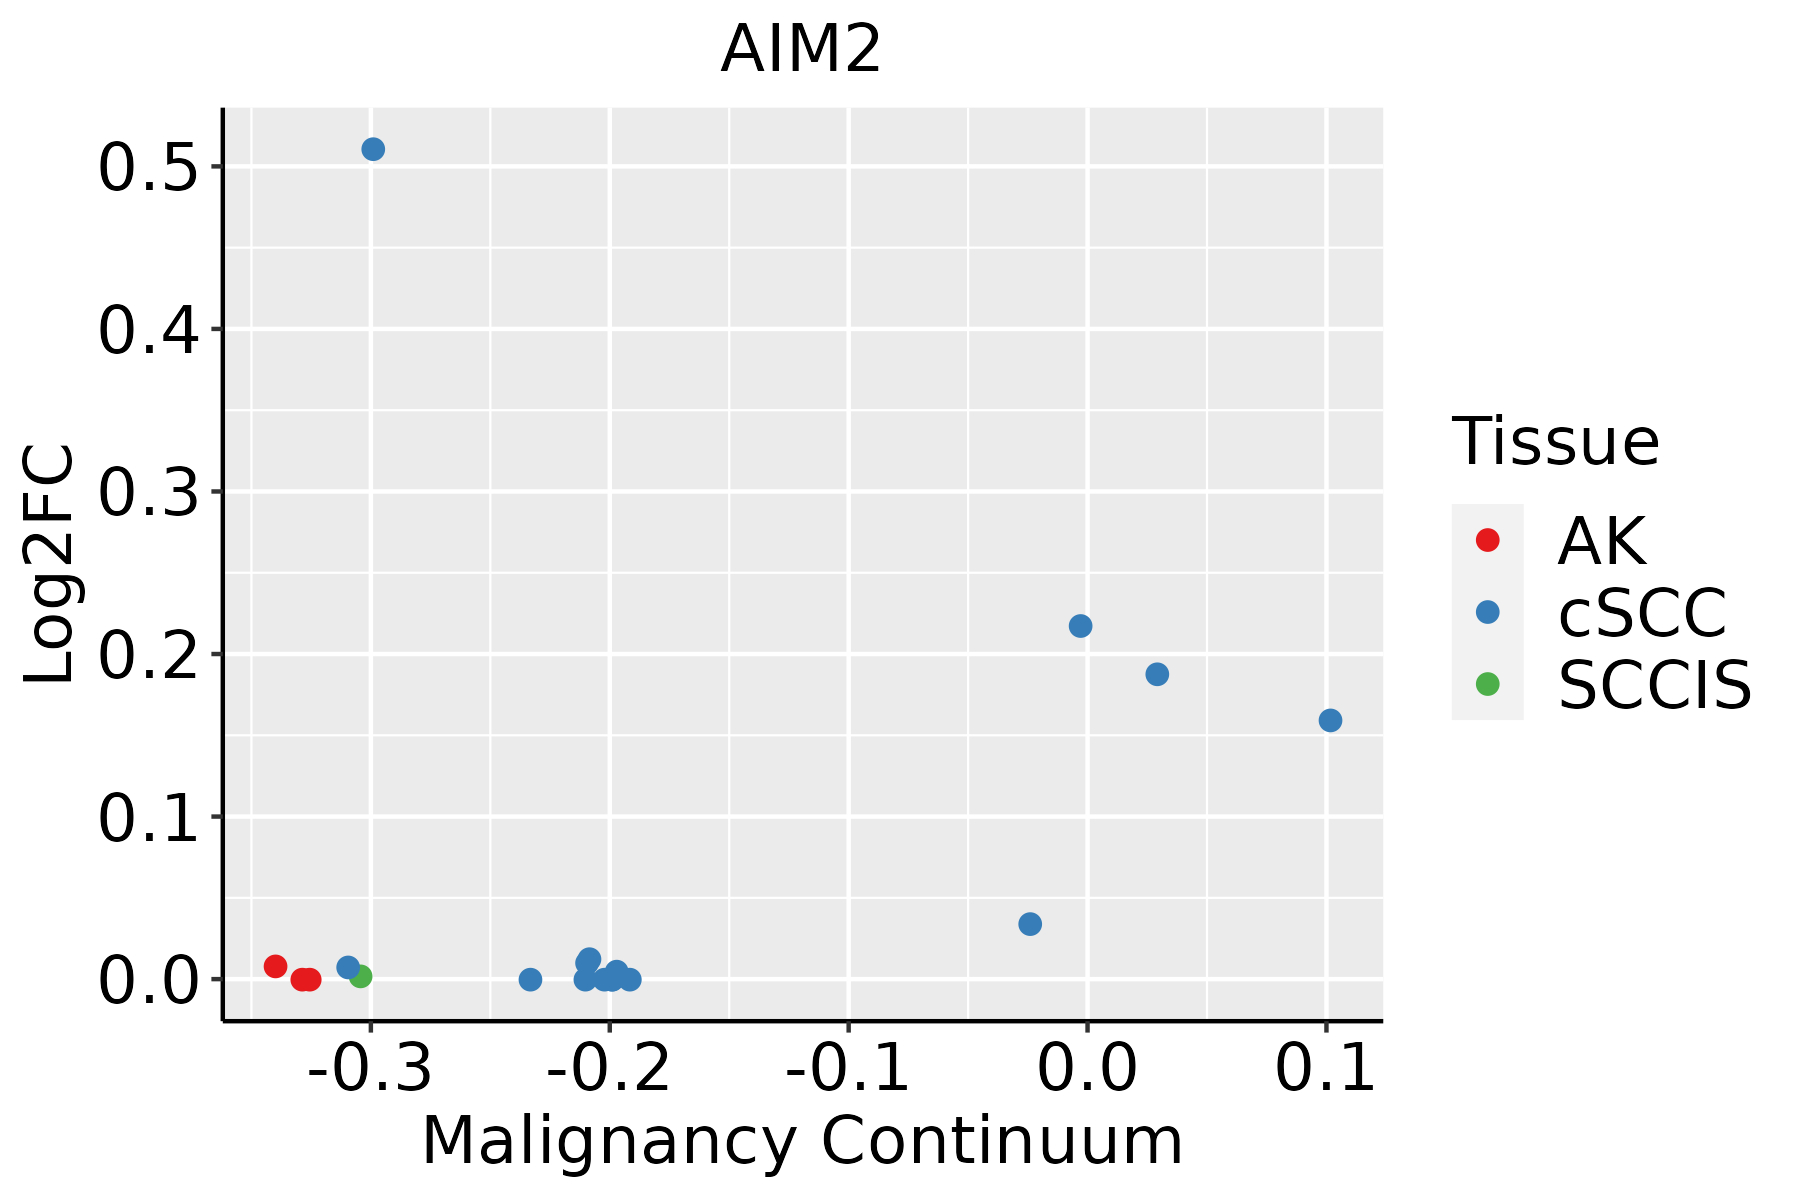 | AK: Actinic keratosis |
| cSCC: Cutaneous squamous cell carcinoma | ||
| SCCIS:squamous cell carcinoma in situ |
| ∗log2FC in expression of this searched gene in stem-like cells from each diseased tissue sample relative to stem-like cells in normal samples in each tissue plotted against the malignancy continuum. Samples are colored based on if they are from different disease stage. |
Top |
Malignant transformation related pathway analysis |
| Find out the enriched GO biological processes and KEGG pathways involved in transition from healthy to precancer to cancer |
| Tissue | Disease Stage | Enriched GO biological Processes |
| Colorectum | AD |  |
| Colorectum | SER |  |
| Colorectum | MSS |  |
| Colorectum | MSI-H |  |
| Colorectum | FAP |  |
| ∗Top 15 enriched GO BP terms are showed in the bar plot of each disease state in each tissue. Each row represents a significant GO biological process which is colored according to the -log10(p.adjust). |
| Page: 1 2 3 4 5 6 7 8 9 |
| GO ID | Tissue | Disease Stage | Description | Gene Ratio | Bg Ratio | pvalue | p.adjust | Count |
| GO:005254710 | Cervix | CC | regulation of peptidase activity | 112/2311 | 461/18723 | 6.70e-13 | 3.08e-10 | 112 |
| GO:004586210 | Cervix | CC | positive regulation of proteolysis | 95/2311 | 372/18723 | 1.84e-12 | 6.86e-10 | 95 |
| GO:005254810 | Cervix | CC | regulation of endopeptidase activity | 103/2311 | 432/18723 | 1.89e-11 | 5.14e-09 | 103 |
| GO:00321035 | Cervix | CC | positive regulation of response to external stimulus | 95/2311 | 427/18723 | 5.44e-09 | 5.03e-07 | 95 |
| GO:001095210 | Cervix | CC | positive regulation of peptidase activity | 54/2311 | 197/18723 | 8.06e-09 | 6.99e-07 | 54 |
| GO:200011610 | Cervix | CC | regulation of cysteine-type endopeptidase activity | 61/2311 | 235/18723 | 8.69e-09 | 7.22e-07 | 61 |
| GO:001095010 | Cervix | CC | positive regulation of endopeptidase activity | 48/2311 | 179/18723 | 1.12e-07 | 5.71e-06 | 48 |
| GO:00018197 | Cervix | CC | positive regulation of cytokine production | 95/2311 | 467/18723 | 4.88e-07 | 1.85e-05 | 95 |
| GO:00510904 | Cervix | CC | regulation of DNA-binding transcription factor activity | 87/2311 | 440/18723 | 4.85e-06 | 1.22e-04 | 87 |
| GO:20010569 | Cervix | CC | positive regulation of cysteine-type endopeptidase activity | 38/2311 | 148/18723 | 6.94e-06 | 1.65e-04 | 38 |
| GO:00313494 | Cervix | CC | positive regulation of defense response | 60/2311 | 278/18723 | 9.38e-06 | 2.11e-04 | 60 |
| GO:00346129 | Cervix | CC | response to tumor necrosis factor | 55/2311 | 253/18723 | 1.75e-05 | 3.32e-04 | 55 |
| GO:00713569 | Cervix | CC | cellular response to tumor necrosis factor | 51/2311 | 229/18723 | 1.75e-05 | 3.32e-04 | 51 |
| GO:00028315 | Cervix | CC | regulation of response to biotic stimulus | 67/2311 | 327/18723 | 1.79e-05 | 3.36e-04 | 67 |
| GO:00096158 | Cervix | CC | response to virus | 73/2311 | 367/18723 | 2.22e-05 | 3.95e-04 | 73 |
| GO:00022533 | Cervix | CC | activation of immune response | 72/2311 | 375/18723 | 8.26e-05 | 1.11e-03 | 72 |
| GO:00192213 | Cervix | CC | cytokine-mediated signaling pathway | 84/2311 | 472/18723 | 3.25e-04 | 3.44e-03 | 84 |
| GO:00022183 | Cervix | CC | activation of innate immune response | 16/2311 | 52/18723 | 3.61e-04 | 3.75e-03 | 16 |
| GO:00510915 | Cervix | CC | positive regulation of DNA-binding transcription factor activity | 51/2311 | 260/18723 | 5.05e-04 | 4.92e-03 | 51 |
| GO:00450882 | Cervix | CC | regulation of innate immune response | 44/2311 | 218/18723 | 6.40e-04 | 5.97e-03 | 44 |
| Page: 1 2 3 4 5 6 |
| Pathway ID | Tissue | Disease Stage | Description | Gene Ratio | Bg Ratio | pvalue | p.adjust | qvalue | Count |
| hsa046213 | Cervix | CC | NOD-like receptor signaling pathway | 41/1267 | 186/8465 | 5.90e-03 | 1.95e-02 | 1.15e-02 | 41 |
| hsa0462112 | Cervix | CC | NOD-like receptor signaling pathway | 41/1267 | 186/8465 | 5.90e-03 | 1.95e-02 | 1.15e-02 | 41 |
| hsa0462122 | Esophagus | ESCC | NOD-like receptor signaling pathway | 116/4205 | 186/8465 | 2.90e-04 | 1.03e-03 | 5.30e-04 | 116 |
| hsa046234 | Esophagus | ESCC | Cytosolic DNA-sensing pathway | 49/4205 | 75/8465 | 4.35e-03 | 1.12e-02 | 5.74e-03 | 49 |
| hsa0462132 | Esophagus | ESCC | NOD-like receptor signaling pathway | 116/4205 | 186/8465 | 2.90e-04 | 1.03e-03 | 5.30e-04 | 116 |
| hsa0462311 | Esophagus | ESCC | Cytosolic DNA-sensing pathway | 49/4205 | 75/8465 | 4.35e-03 | 1.12e-02 | 5.74e-03 | 49 |
| hsa04623 | Oral cavity | OSCC | Cytosolic DNA-sensing pathway | 44/3704 | 75/8465 | 6.44e-03 | 1.51e-02 | 7.68e-03 | 44 |
| hsa046231 | Oral cavity | OSCC | Cytosolic DNA-sensing pathway | 44/3704 | 75/8465 | 6.44e-03 | 1.51e-02 | 7.68e-03 | 44 |
| Page: 1 |
Top |
Cell-cell communication analysis |
| Identification of potential cell-cell interactions between two cell types and their ligand-receptor pairs for different disease states |
| Ligand | Receptor | LRpair | Pathway | Tissue | Disease Stage |
| Page: 1 |
Top |
Single-cell gene regulatory network inference analysis |
| Find out the significant the regulons (TFs) and the target genes of each regulon across cell types for different disease states |
| TF | Cell Type | Tissue | Disease Stage | Target Gene | RSS | Regulon Activity |
| ∗The dot plots of a searched regulon are shown for all cell subpopulations in each disease state of each tissue based on the regulon specific score inferred using pySCENIC and by calculating the average expression. |
| Page: 1 |
Top |
Somatic mutation of malignant transformation related genes |
| Annotation of somatic variants for genes involved in malignant transformation |
| Hugo Symbol | Variant Class | Variant Classification | dbSNP RS | HGVSc | HGVSp | HGVSp Short | SWISSPROT | BIOTYPE | SIFT | PolyPhen | Tumor Sample Barcode | Tissue | Histology | Sex | Age | Stage | Therapy Types | Drugs | Outcome |
| AIM2 | SNV | Missense_Mutation | novel | c.1016N>T | p.Ala339Val | p.A339V | O14862 | protein_coding | tolerated(0.16) | benign(0.003) | TCGA-A8-A0A7-01 | Breast | breast invasive carcinoma | Female | <65 | I/II | Unknown | Unknown | SD |
| AIM2 | SNV | Missense_Mutation | c.128C>T | p.Ala43Val | p.A43V | O14862 | protein_coding | tolerated(0.32) | possibly_damaging(0.748) | TCGA-AC-A23C-01 | Breast | breast invasive carcinoma | Female | <65 | I/II | Chemotherapy | chemo | CR | |
| AIM2 | SNV | Missense_Mutation | c.545C>A | p.Ala182Asp | p.A182D | O14862 | protein_coding | deleterious(0) | probably_damaging(0.987) | TCGA-D8-A1XQ-01 | Breast | breast invasive carcinoma | Female | >=65 | I/II | Unknown | Unknown | SD | |
| AIM2 | SNV | Missense_Mutation | rs770998267 | c.199N>G | p.Arg67Gly | p.R67G | O14862 | protein_coding | tolerated(0.45) | benign(0.007) | TCGA-GM-A2D9-01 | Breast | breast invasive carcinoma | Female | >=65 | I/II | Hormone Therapy | arimidex | SD |
| AIM2 | insertion | In_Frame_Ins | novel | c.337_338insGGCCCCTTACTGGCCCAAGCTCCA | p.Ala113delinsGlyProLeuThrGlyProSerSerThr | p.A113delinsGPLTGPSST | O14862 | protein_coding | TCGA-AO-A0J9-01 | Breast | breast invasive carcinoma | Female | <65 | III/IV | Chemotherapy | cyclophosphamide | PD | ||
| AIM2 | insertion | Frame_Shift_Ins | novel | c.819_820insGCCAGTCCCACCACGTC | p.Thr274AlafsTer17 | p.T274Afs*17 | O14862 | protein_coding | TCGA-BH-A0E2-01 | Breast | breast invasive carcinoma | Female | <65 | III/IV | Chemotherapy | doxorubicin | SD | ||
| AIM2 | insertion | Frame_Shift_Ins | novel | c.817_818insACACATTTCCC | p.Val273AspfsTer5 | p.V273Dfs*5 | O14862 | protein_coding | TCGA-BH-A0E2-01 | Breast | breast invasive carcinoma | Female | <65 | III/IV | Chemotherapy | doxorubicin | SD | ||
| AIM2 | SNV | Missense_Mutation | novel | c.742G>A | p.Glu248Lys | p.E248K | O14862 | protein_coding | tolerated(0.13) | possibly_damaging(0.806) | TCGA-C5-A1M7-01 | Cervix | cervical & endocervical cancer | Female | <65 | I/II | Unknown | Unknown | SD |
| AIM2 | SNV | Missense_Mutation | rs145779112 | c.932G>A | p.Arg311Gln | p.R311Q | O14862 | protein_coding | tolerated(0.11) | benign(0.174) | TCGA-DS-A1OB-01 | Cervix | cervical & endocervical cancer | Female | <65 | I/II | Chemotherapy | carboplatin | PD |
| AIM2 | SNV | Missense_Mutation | novel | c.435C>G | p.Ile145Met | p.I145M | O14862 | protein_coding | tolerated(0.13) | possibly_damaging(0.503) | TCGA-VS-A958-01 | Cervix | cervical & endocervical cancer | Female | <65 | I/II | Chemotherapy | cisplatin | CR |
| Page: 1 2 3 4 5 6 |
Top |
Related drugs of malignant transformation related genes |
| Identification of chemicals and drugs interact with genes involved in malignant transfromation |
| (DGIdb 4.0) |
| Entrez ID | Symbol | Category | Interaction Types | Drug Claim Name | Drug Name | PMIDs |
| Page: 1 |

Copyright 2023-Present -The University of Texas Health Science Center at Houston |