
|
|||||
|
 | |
| |
| |
| |
| |
| |
|
Gene: AIG1 |
Gene summary for AIG1 |
| Gene information | Species | Human | Gene symbol | AIG1 | Gene ID | 51390 |
| Gene name | androgen induced 1 | |
| Gene Alias | AIG-1 | |
| Cytomap | 6q24.2 | |
| Gene Type | protein-coding | GO ID | GO:0001676 | UniProtAcc | Q9NVV5 |
Top |
Malignant transformation analysis |
| Identification of the aberrant gene expression in precancerous and cancerous lesions by comparing the gene expression of stem-like cells in diseased tissues with normal stem cells |
| Entrez ID | Symbol | Replicates | Species | Organ | Tissue | Adj P-value | Log2FC | Malignancy |
| 51390 | AIG1 | LZE2T | Human | Esophagus | ESCC | 1.80e-04 | 5.42e-01 | 0.082 |
| 51390 | AIG1 | LZE4T | Human | Esophagus | ESCC | 9.03e-22 | 6.47e-01 | 0.0811 |
| 51390 | AIG1 | LZE5T | Human | Esophagus | ESCC | 8.59e-04 | 7.07e-01 | 0.0514 |
| 51390 | AIG1 | LZE7T | Human | Esophagus | ESCC | 6.88e-18 | 5.23e-01 | 0.0667 |
| 51390 | AIG1 | LZE8T | Human | Esophagus | ESCC | 3.96e-09 | 4.15e-01 | 0.067 |
| 51390 | AIG1 | LZE20T | Human | Esophagus | ESCC | 2.78e-02 | 2.22e-01 | 0.0662 |
| 51390 | AIG1 | LZE22T | Human | Esophagus | ESCC | 3.87e-06 | 4.28e-01 | 0.068 |
| 51390 | AIG1 | LZE24T | Human | Esophagus | ESCC | 1.93e-24 | 6.87e-01 | 0.0596 |
| 51390 | AIG1 | LZE21T | Human | Esophagus | ESCC | 7.28e-09 | 5.82e-01 | 0.0655 |
| 51390 | AIG1 | LZE6T | Human | Esophagus | ESCC | 2.09e-10 | 8.44e-01 | 0.0845 |
| 51390 | AIG1 | P1T-E | Human | Esophagus | ESCC | 1.15e-07 | 5.04e-01 | 0.0875 |
| 51390 | AIG1 | P2T-E | Human | Esophagus | ESCC | 1.83e-24 | 3.68e-01 | 0.1177 |
| 51390 | AIG1 | P4T-E | Human | Esophagus | ESCC | 4.13e-53 | 1.06e+00 | 0.1323 |
| 51390 | AIG1 | P5T-E | Human | Esophagus | ESCC | 1.31e-50 | 9.18e-01 | 0.1327 |
| 51390 | AIG1 | P8T-E | Human | Esophagus | ESCC | 5.29e-47 | 8.78e-01 | 0.0889 |
| 51390 | AIG1 | P9T-E | Human | Esophagus | ESCC | 1.68e-20 | 5.36e-01 | 0.1131 |
| 51390 | AIG1 | P10T-E | Human | Esophagus | ESCC | 3.74e-23 | 4.48e-01 | 0.116 |
| 51390 | AIG1 | P11T-E | Human | Esophagus | ESCC | 1.44e-15 | 8.01e-01 | 0.1426 |
| 51390 | AIG1 | P12T-E | Human | Esophagus | ESCC | 2.66e-26 | 5.49e-01 | 0.1122 |
| 51390 | AIG1 | P15T-E | Human | Esophagus | ESCC | 3.70e-40 | 8.04e-01 | 0.1149 |
| Page: 1 2 3 4 5 6 7 |
| Tissue | Expression Dynamics | Abbreviation |
| Esophagus | 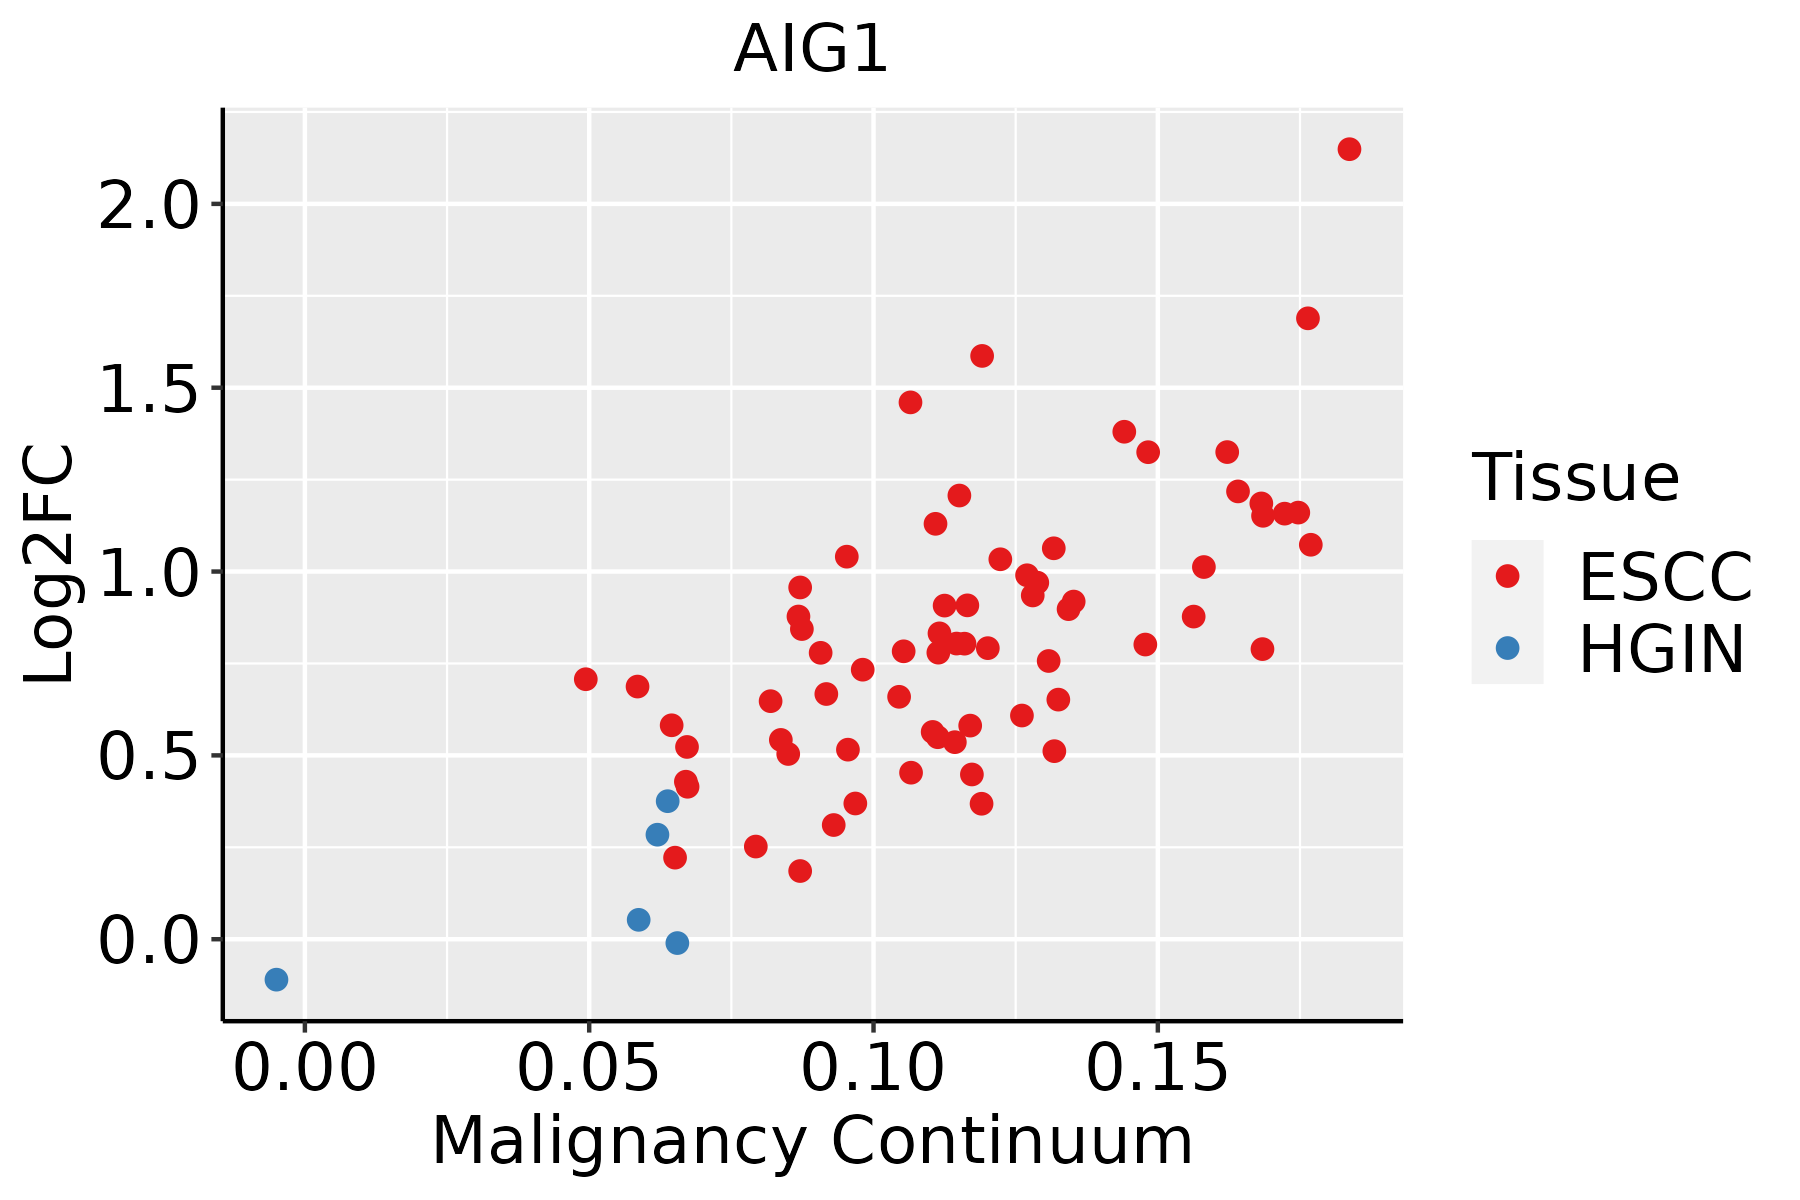 | ESCC: Esophageal squamous cell carcinoma |
| HGIN: High-grade intraepithelial neoplasias | ||
| LGIN: Low-grade intraepithelial neoplasias | ||
| Liver | 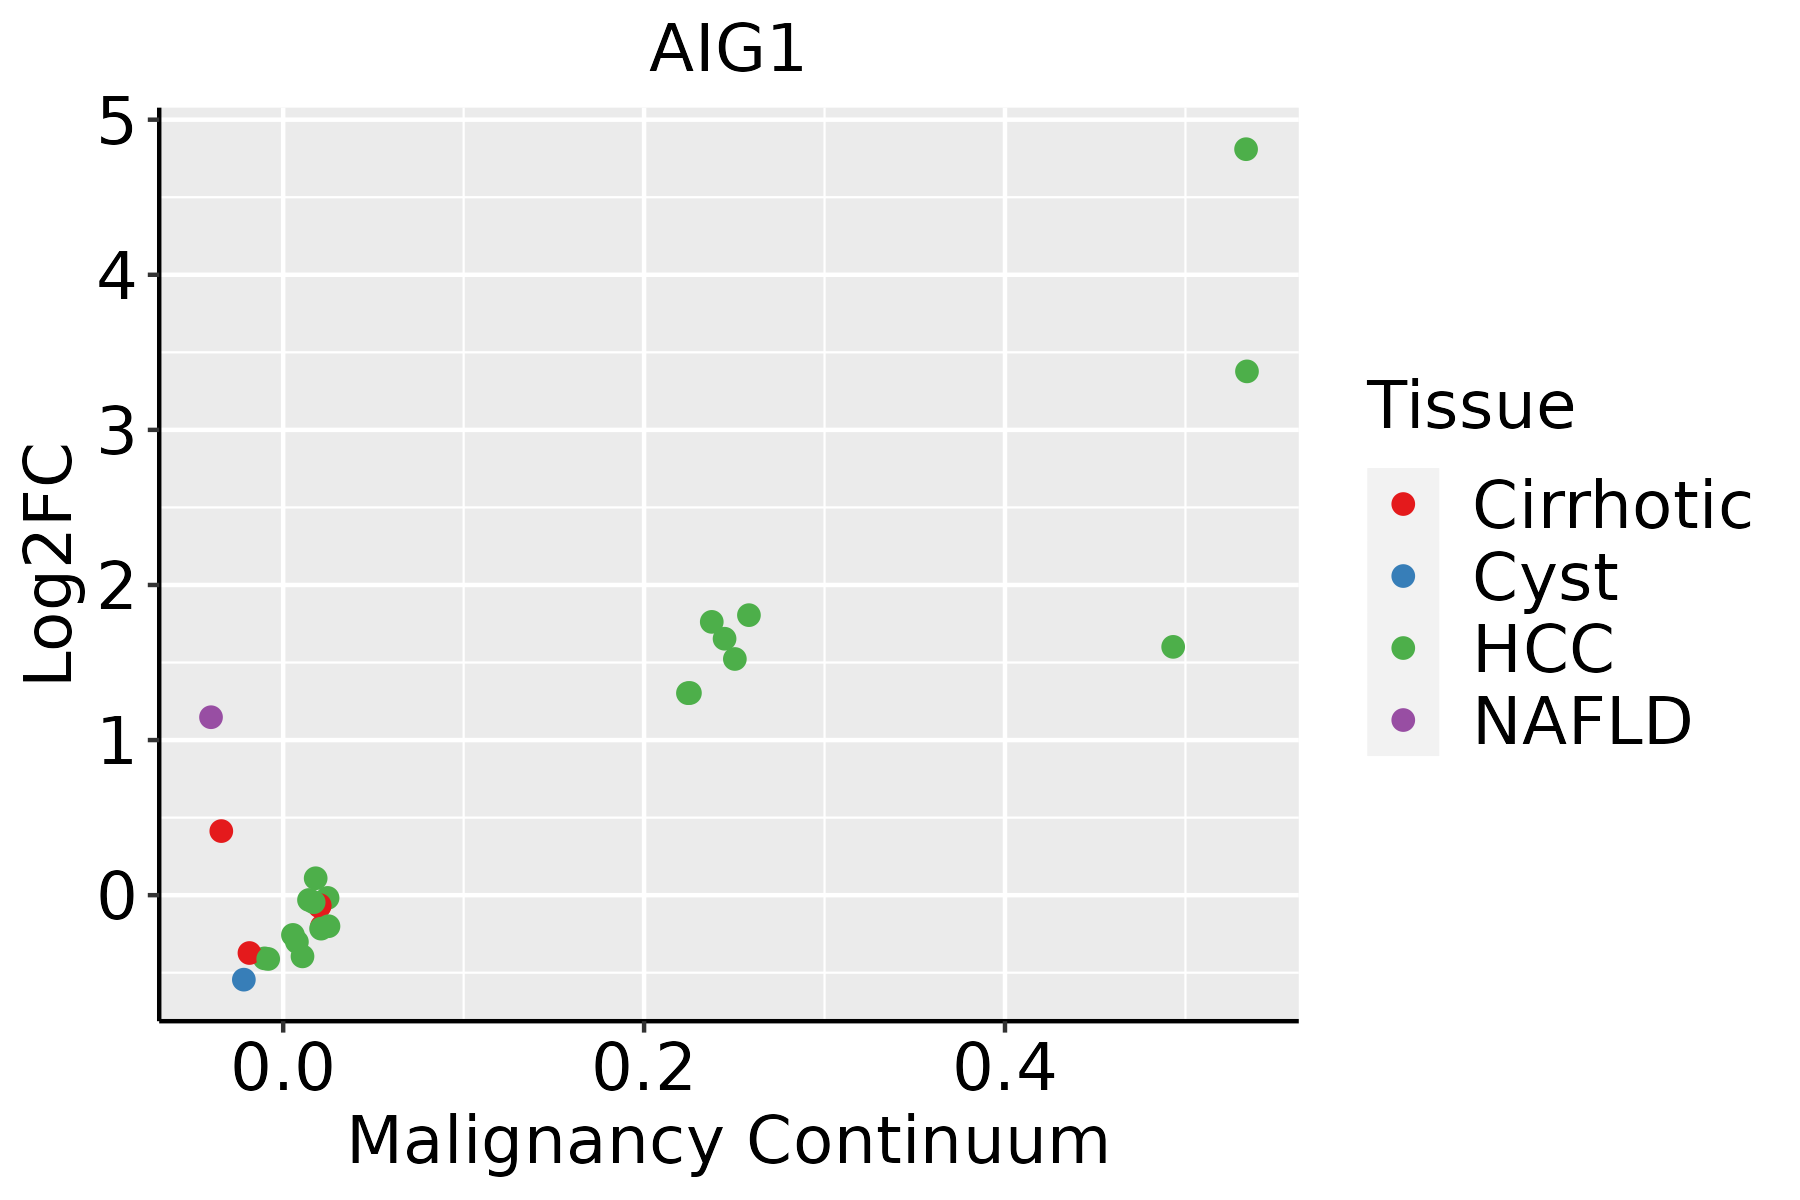 | HCC: Hepatocellular carcinoma |
| NAFLD: Non-alcoholic fatty liver disease | ||
| Lung | 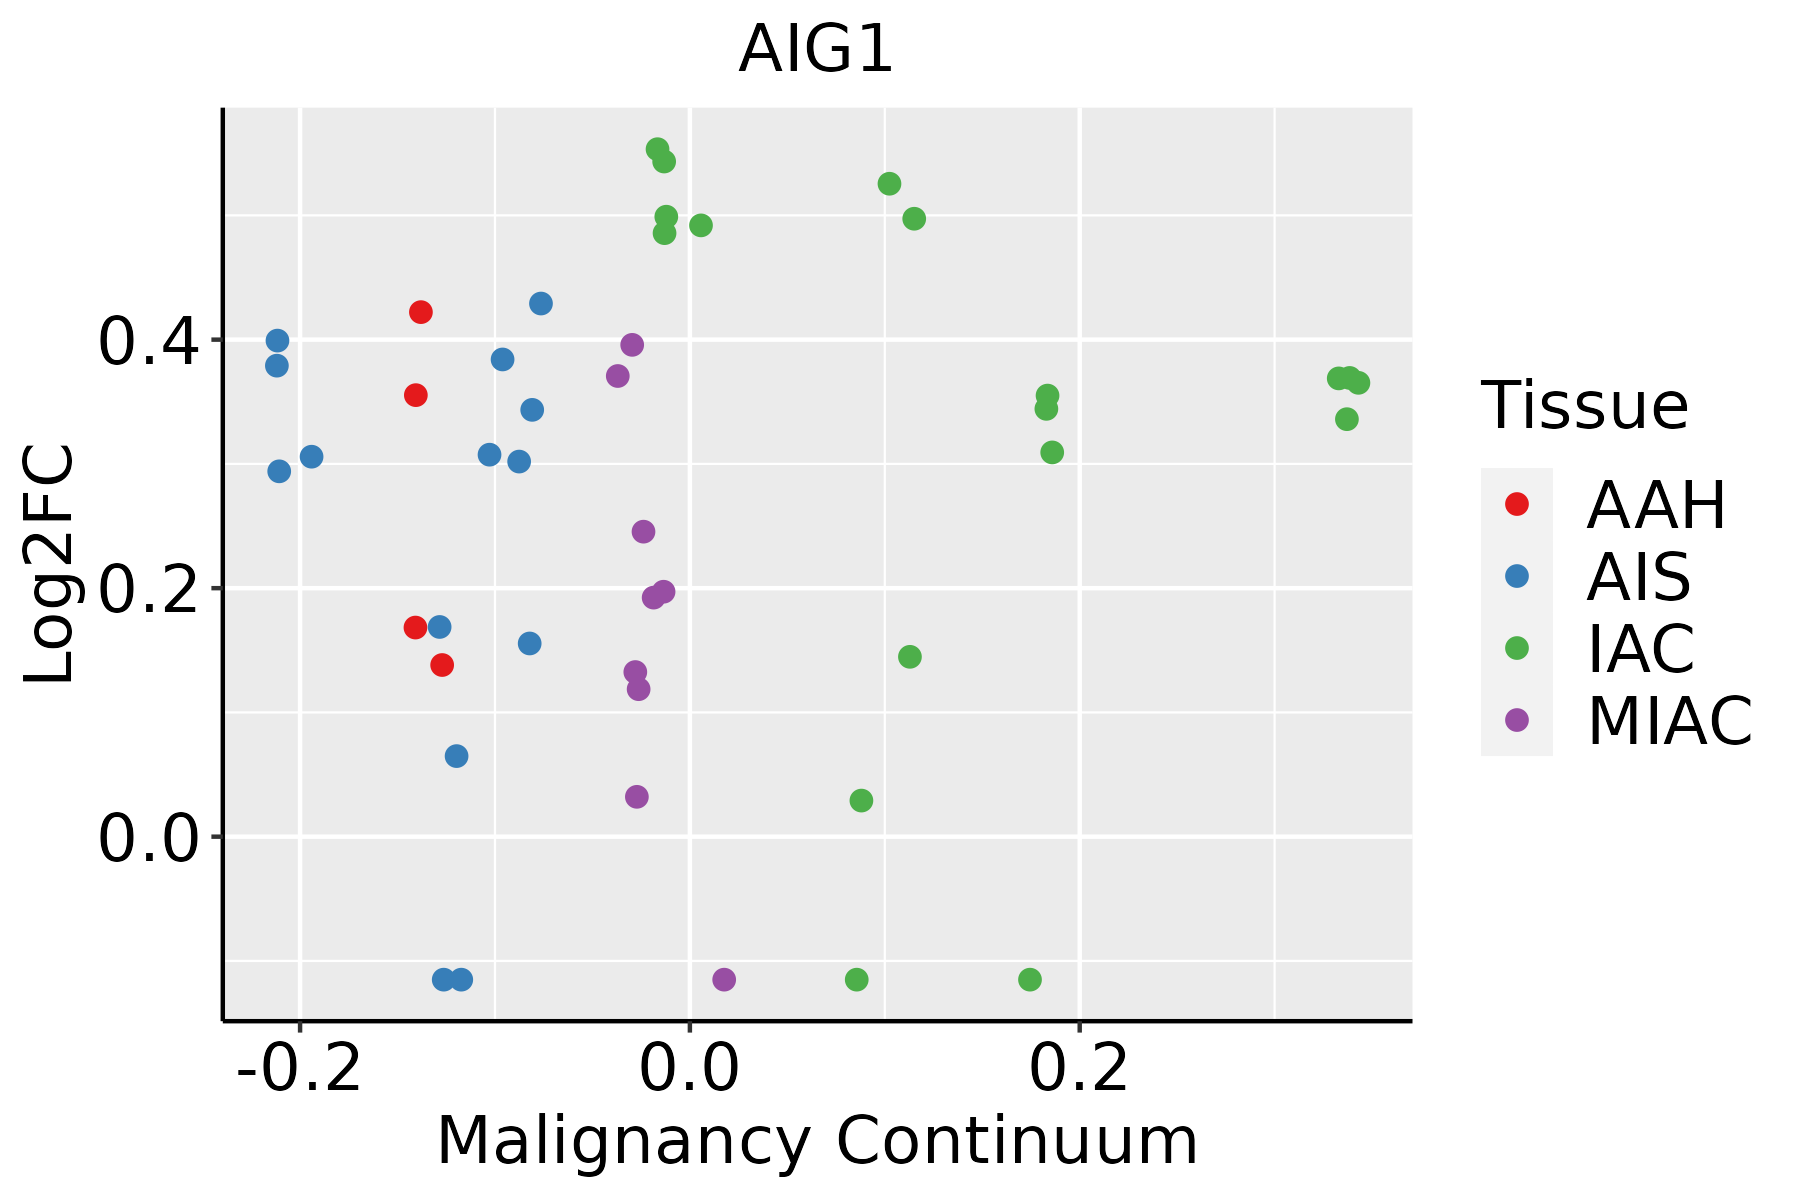 | AAH: Atypical adenomatous hyperplasia |
| AIS: Adenocarcinoma in situ | ||
| IAC: Invasive lung adenocarcinoma | ||
| MIA: Minimally invasive adenocarcinoma | ||
| Oral Cavity | 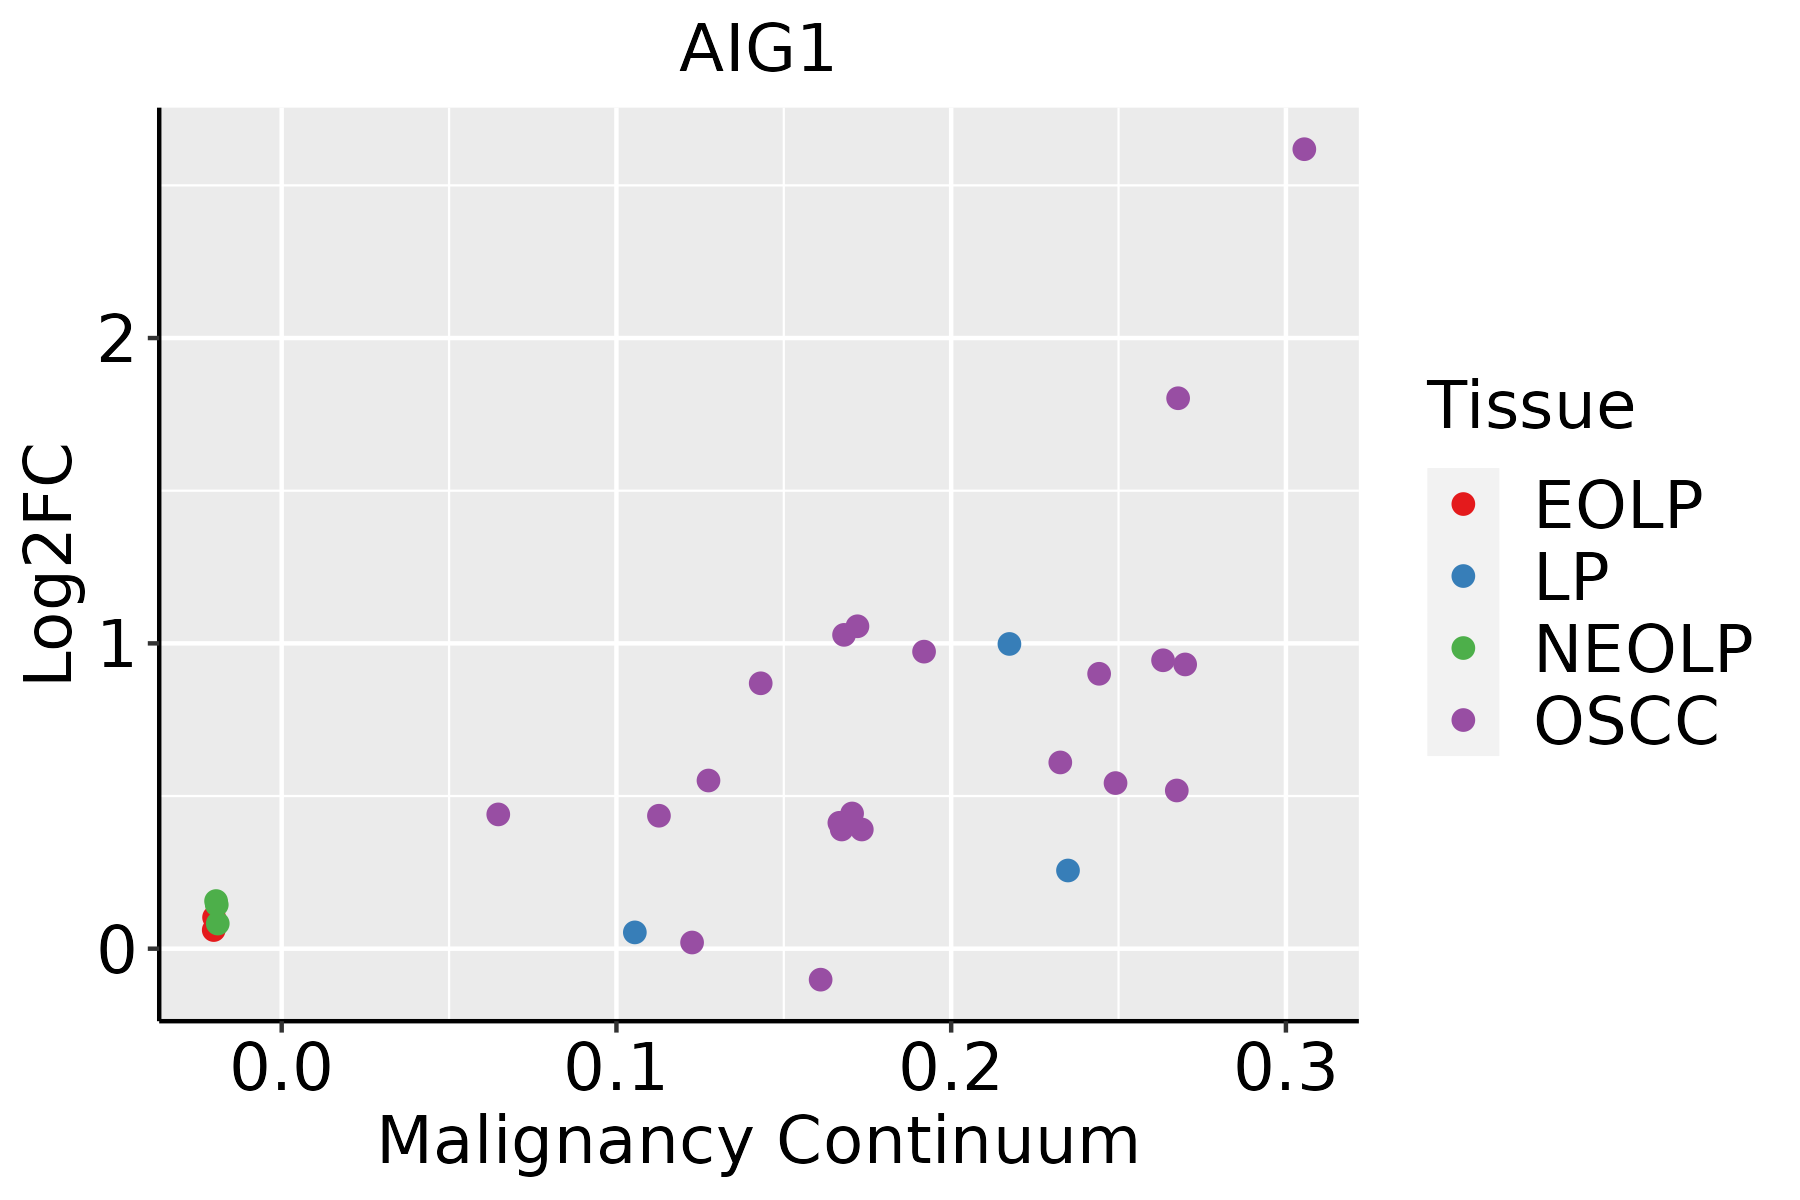 | EOLP: Erosive Oral lichen planus |
| LP: leukoplakia | ||
| NEOLP: Non-erosive oral lichen planus | ||
| OSCC: Oral squamous cell carcinoma | ||
| Skin | 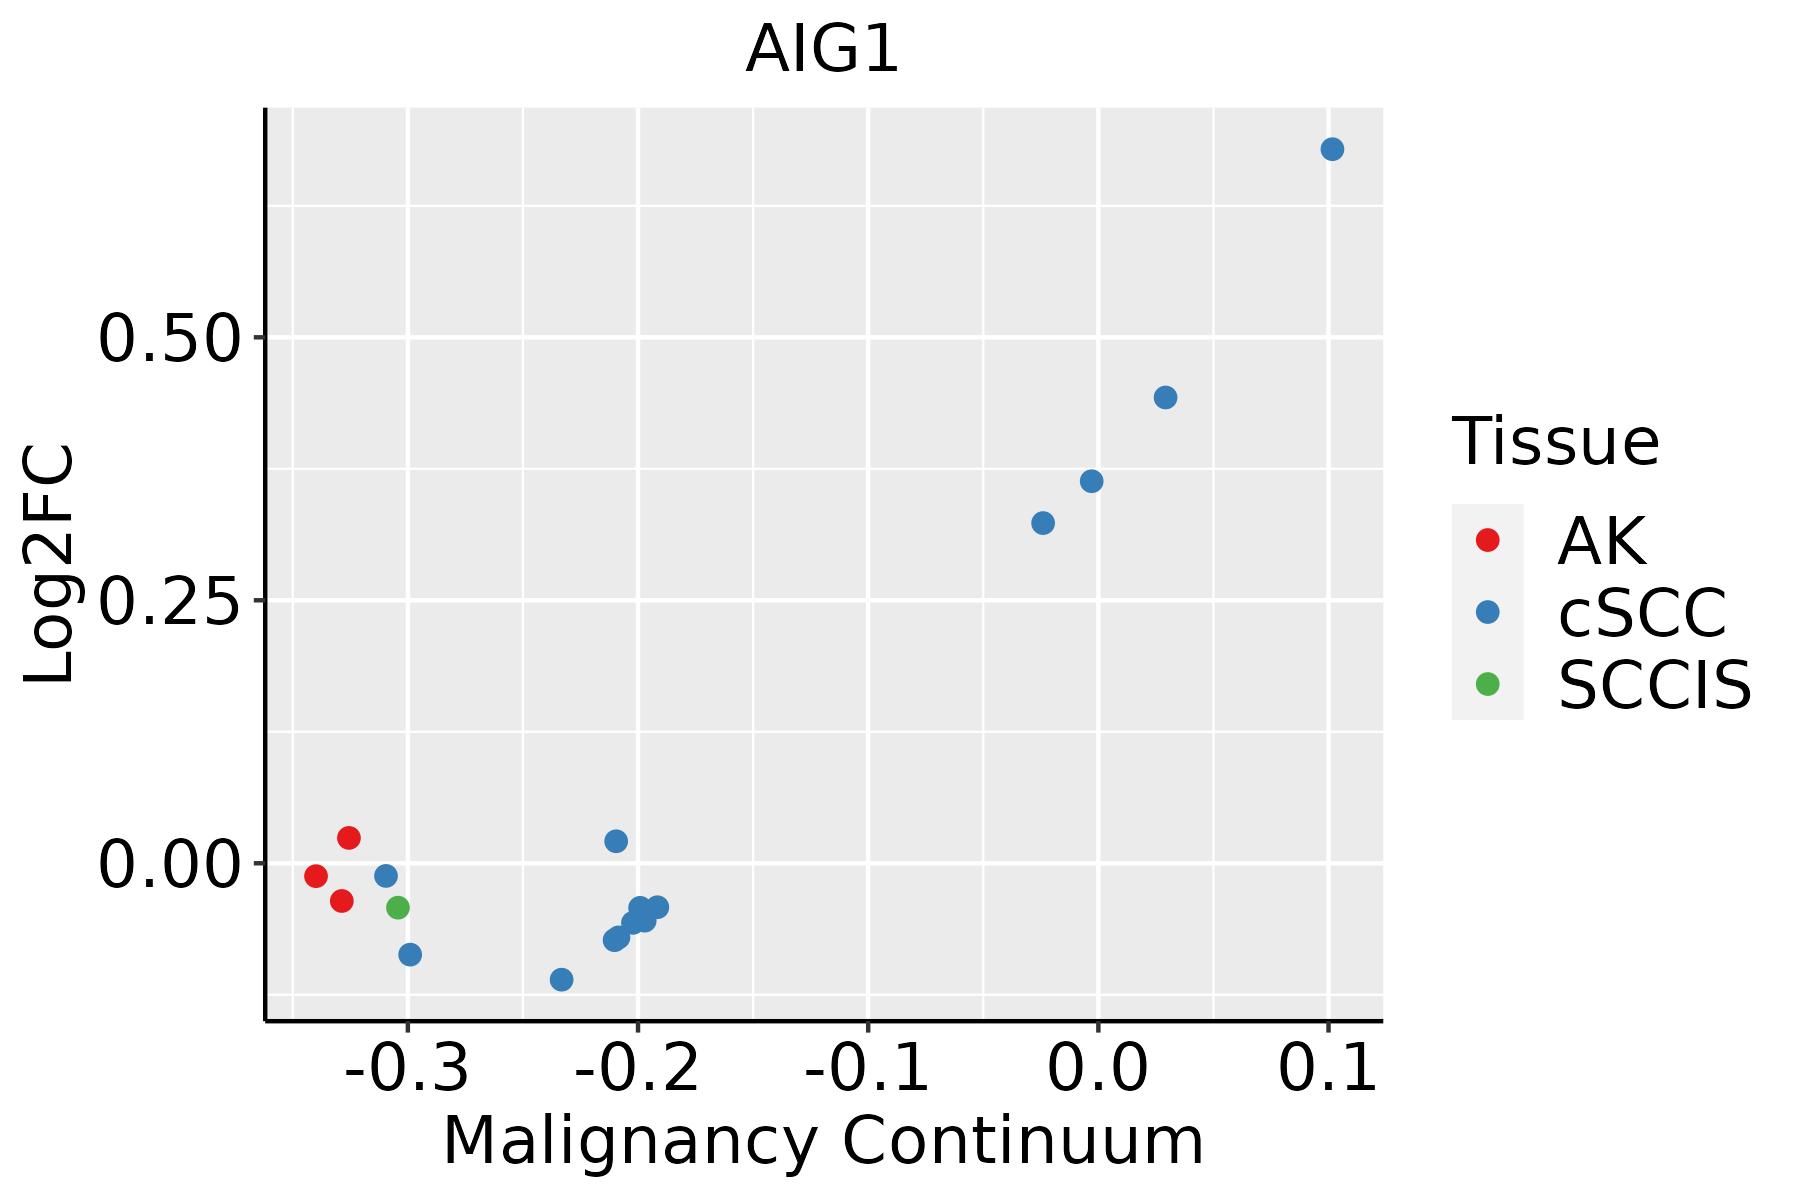 | AK: Actinic keratosis |
| cSCC: Cutaneous squamous cell carcinoma | ||
| SCCIS:squamous cell carcinoma in situ | ||
| Thyroid | 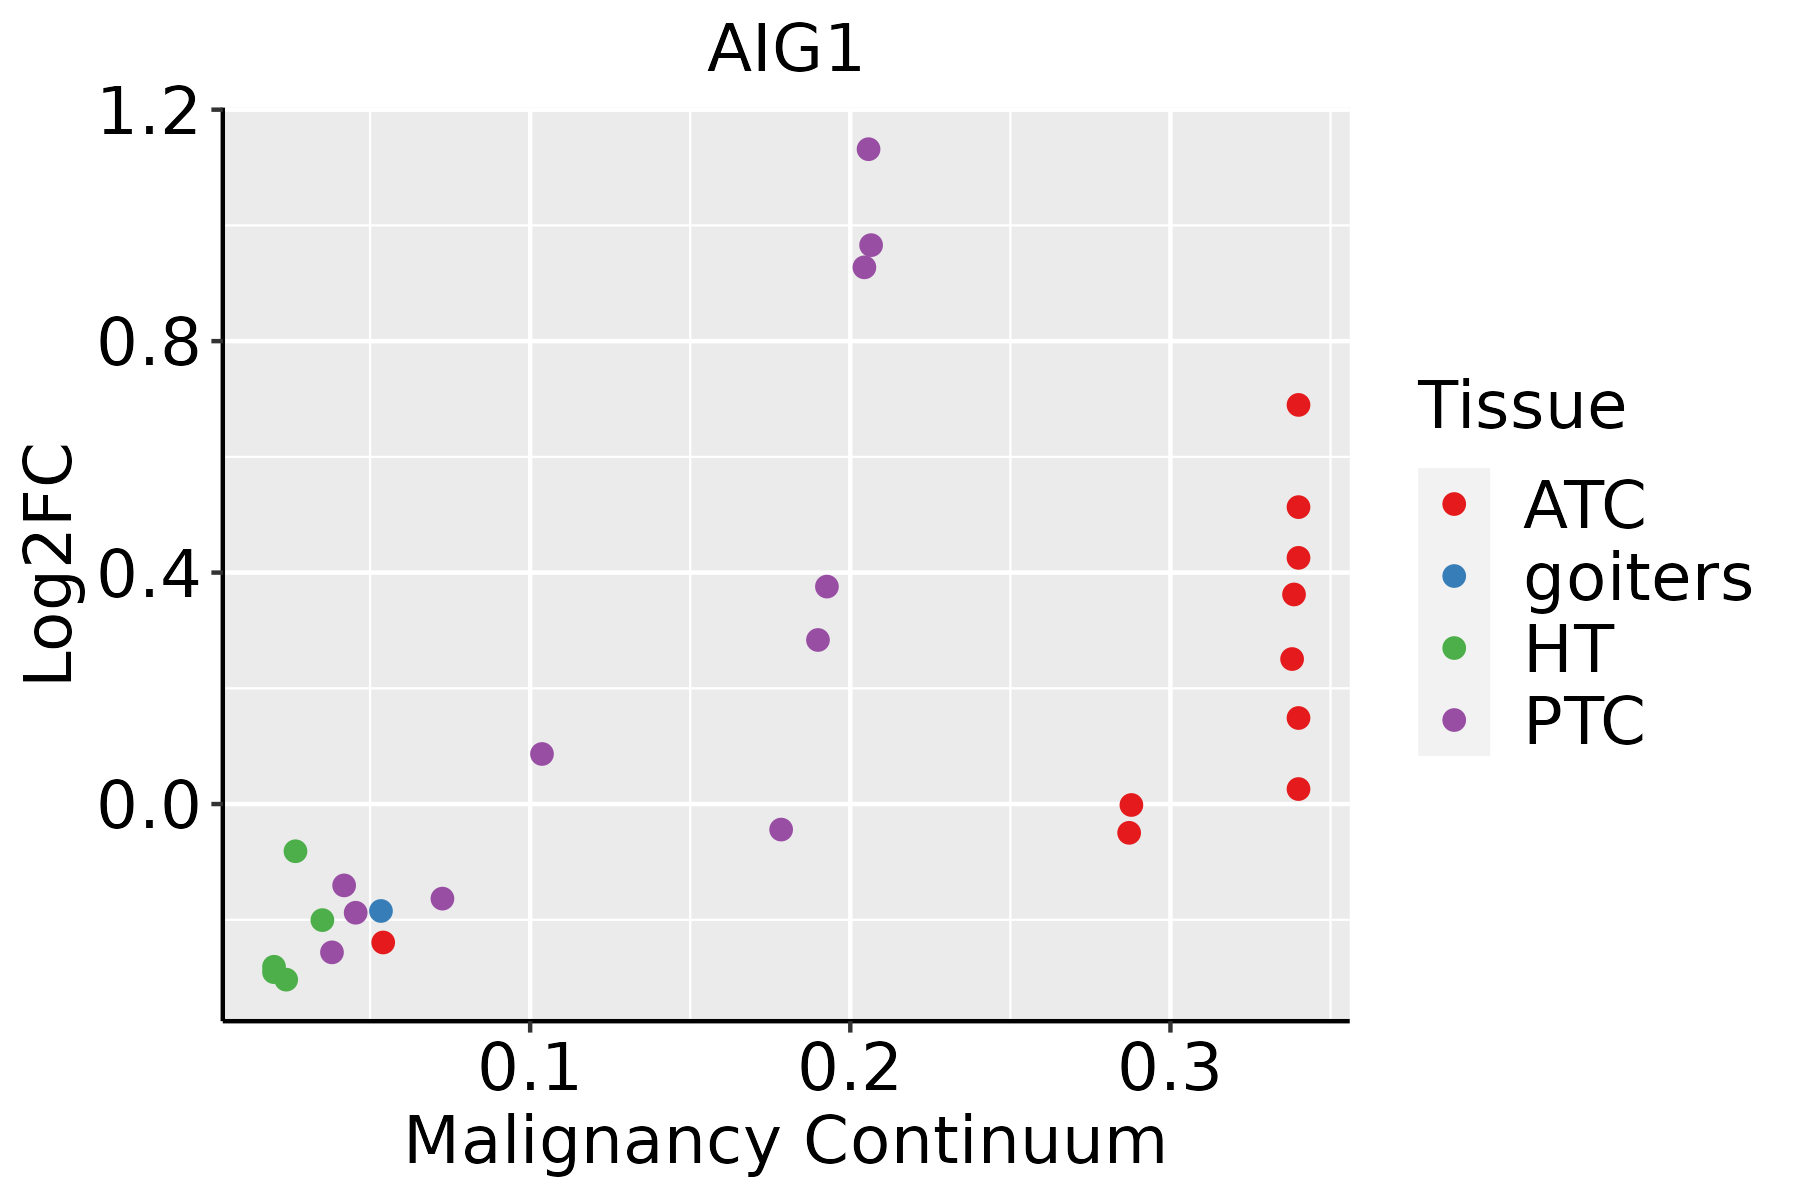 | ATC: Anaplastic thyroid cancer |
| HT: Hashimoto's thyroiditis | ||
| PTC: Papillary thyroid cancer |
| ∗log2FC in expression of this searched gene in stem-like cells from each diseased tissue sample relative to stem-like cells in normal samples in each tissue plotted against the malignancy continuum. Samples are colored based on if they are from different disease stage. |
Top |
Malignant transformation related pathway analysis |
| Find out the enriched GO biological processes and KEGG pathways involved in transition from healthy to precancer to cancer |
| Tissue | Disease Stage | Enriched GO biological Processes |
| Colorectum | AD |  |
| Colorectum | SER |  |
| Colorectum | MSS |  |
| Colorectum | MSI-H |  |
| Colorectum | FAP |  |
| ∗Top 15 enriched GO BP terms are showed in the bar plot of each disease state in each tissue. Each row represents a significant GO biological process which is colored according to the -log10(p.adjust). |
| Page: 1 2 3 4 5 6 7 8 9 |
| GO ID | Tissue | Disease Stage | Description | Gene Ratio | Bg Ratio | pvalue | p.adjust | Count |
| GO:00090628 | Esophagus | ESCC | fatty acid catabolic process | 66/8552 | 100/18723 | 3.21e-05 | 2.66e-04 | 66 |
| GO:00066318 | Esophagus | ESCC | fatty acid metabolic process | 217/8552 | 390/18723 | 4.21e-05 | 3.39e-04 | 217 |
| GO:00723297 | Esophagus | ESCC | monocarboxylic acid catabolic process | 74/8552 | 122/18723 | 6.03e-04 | 3.27e-03 | 74 |
| GO:00442427 | Esophagus | ESCC | cellular lipid catabolic process | 121/8552 | 214/18723 | 8.63e-04 | 4.43e-03 | 121 |
| GO:00442827 | Esophagus | ESCC | small molecule catabolic process | 201/8552 | 376/18723 | 1.35e-03 | 6.41e-03 | 201 |
| GO:00160427 | Esophagus | ESCC | lipid catabolic process | 168/8552 | 320/18723 | 7.97e-03 | 2.84e-02 | 168 |
| GO:00463953 | Liver | NAFLD | carboxylic acid catabolic process | 73/1882 | 236/18723 | 4.16e-19 | 1.22e-15 | 73 |
| GO:00160544 | Liver | NAFLD | organic acid catabolic process | 73/1882 | 240/18723 | 1.20e-18 | 2.34e-15 | 73 |
| GO:00442825 | Liver | NAFLD | small molecule catabolic process | 91/1882 | 376/18723 | 8.96e-16 | 1.31e-12 | 91 |
| GO:00066316 | Liver | NAFLD | fatty acid metabolic process | 92/1882 | 390/18723 | 3.38e-15 | 3.29e-12 | 92 |
| GO:00723295 | Liver | NAFLD | monocarboxylic acid catabolic process | 39/1882 | 122/18723 | 2.40e-11 | 8.77e-09 | 39 |
| GO:00090626 | Liver | NAFLD | fatty acid catabolic process | 34/1882 | 100/18723 | 6.81e-11 | 1.99e-08 | 34 |
| GO:00442425 | Liver | NAFLD | cellular lipid catabolic process | 52/1882 | 214/18723 | 1.15e-09 | 2.17e-07 | 52 |
| GO:00160426 | Liver | NAFLD | lipid catabolic process | 63/1882 | 320/18723 | 1.35e-07 | 1.02e-05 | 63 |
| GO:00016763 | Liver | NAFLD | long-chain fatty acid metabolic process | 23/1882 | 112/18723 | 6.73e-04 | 8.66e-03 | 23 |
| GO:000663112 | Liver | Cirrhotic | fatty acid metabolic process | 165/4634 | 390/18723 | 1.29e-14 | 1.26e-12 | 165 |
| GO:004428211 | Liver | Cirrhotic | small molecule catabolic process | 151/4634 | 376/18723 | 2.20e-11 | 1.34e-09 | 151 |
| GO:001605411 | Liver | Cirrhotic | organic acid catabolic process | 104/4634 | 240/18723 | 1.91e-10 | 9.53e-09 | 104 |
| GO:004639511 | Liver | Cirrhotic | carboxylic acid catabolic process | 102/4634 | 236/18723 | 3.41e-10 | 1.63e-08 | 102 |
| GO:007232911 | Liver | Cirrhotic | monocarboxylic acid catabolic process | 56/4634 | 122/18723 | 2.87e-07 | 7.01e-06 | 56 |
| Page: 1 2 |
| Pathway ID | Tissue | Disease Stage | Description | Gene Ratio | Bg Ratio | pvalue | p.adjust | qvalue | Count |
| Page: 1 |
Top |
Cell-cell communication analysis |
| Identification of potential cell-cell interactions between two cell types and their ligand-receptor pairs for different disease states |
| Ligand | Receptor | LRpair | Pathway | Tissue | Disease Stage |
| Page: 1 |
Top |
Single-cell gene regulatory network inference analysis |
| Find out the significant the regulons (TFs) and the target genes of each regulon across cell types for different disease states |
| TF | Cell Type | Tissue | Disease Stage | Target Gene | RSS | Regulon Activity |
| ∗The dot plots of a searched regulon are shown for all cell subpopulations in each disease state of each tissue based on the regulon specific score inferred using pySCENIC and by calculating the average expression. |
| Page: 1 |
Top |
Somatic mutation of malignant transformation related genes |
| Annotation of somatic variants for genes involved in malignant transformation |
| Hugo Symbol | Variant Class | Variant Classification | dbSNP RS | HGVSc | HGVSp | HGVSp Short | SWISSPROT | BIOTYPE | SIFT | PolyPhen | Tumor Sample Barcode | Tissue | Histology | Sex | Age | Stage | Therapy Types | Drugs | Outcome |
| AIG1 | SNV | Missense_Mutation | novel | c.115N>A | p.Trp39Arg | p.W39R | Q9NVV5 | protein_coding | deleterious(0) | probably_damaging(0.999) | TCGA-A2-A3XT-01 | Breast | breast invasive carcinoma | Female | <65 | I/II | Chemotherapy | cyclophosphamide | PR |
| AIG1 | SNV | Missense_Mutation | novel | c.125T>G | p.Leu42Arg | p.L42R | Q9NVV5 | protein_coding | deleterious(0) | probably_damaging(0.999) | TCGA-5M-AAT6-01 | Colorectum | colon adenocarcinoma | Female | <65 | III/IV | Unknown | Unknown | PD |
| AIG1 | SNV | Missense_Mutation | c.178N>G | p.Thr60Ala | p.T60A | Q9NVV5 | protein_coding | tolerated(0.58) | benign(0.053) | TCGA-AA-A010-01 | Colorectum | colon adenocarcinoma | Female | <65 | I/II | Chemotherapy | folinic | CR | |
| AIG1 | SNV | Missense_Mutation | rs549007002 | c.203N>A | p.Arg68Gln | p.R68Q | Q9NVV5 | protein_coding | tolerated(0.24) | benign(0.039) | TCGA-A5-A0G2-01 | Endometrium | uterine corpus endometrioid carcinoma | Female | <65 | III/IV | Unknown | Unknown | SD |
| AIG1 | SNV | Missense_Mutation | novel | c.342N>T | p.Glu114Asp | p.E114D | Q9NVV5 | protein_coding | tolerated(0.13) | benign(0.007) | TCGA-A5-A0G2-01 | Endometrium | uterine corpus endometrioid carcinoma | Female | <65 | III/IV | Unknown | Unknown | SD |
| AIG1 | SNV | Missense_Mutation | c.554A>G | p.Tyr185Cys | p.Y185C | Q9NVV5 | protein_coding | deleterious(0) | probably_damaging(0.999) | TCGA-AP-A059-01 | Endometrium | uterine corpus endometrioid carcinoma | Female | >=65 | I/II | Unknown | Unknown | SD | |
| AIG1 | SNV | Missense_Mutation | novel | c.74N>G | p.Lys25Arg | p.K25R | Q9NVV5 | protein_coding | tolerated(0.26) | benign(0.011) | TCGA-AX-A2HD-01 | Endometrium | uterine corpus endometrioid carcinoma | Female | >=65 | III/IV | Unknown | Unknown | SD |
| AIG1 | SNV | Missense_Mutation | novel | c.502N>T | p.Gly168Cys | p.G168C | Q9NVV5 | protein_coding | tolerated(0.17) | benign(0.037) | TCGA-BG-A0VW-01 | Endometrium | uterine corpus endometrioid carcinoma | Female | >=65 | I/II | Unknown | Unknown | SD |
| AIG1 | SNV | Missense_Mutation | rs201448093 | c.430N>A | p.Glu144Lys | p.E144K | Q9NVV5 | protein_coding | deleterious(0.03) | probably_damaging(0.926) | TCGA-BS-A0UV-01 | Endometrium | uterine corpus endometrioid carcinoma | Female | <65 | III/IV | Unknown | Unknown | SD |
| AIG1 | SNV | Missense_Mutation | novel | c.70N>C | p.Tyr24His | p.Y24H | Q9NVV5 | protein_coding | tolerated(0.14) | possibly_damaging(0.864) | TCGA-D1-A175-01 | Endometrium | uterine corpus endometrioid carcinoma | Female | <65 | I/II | Chemotherapy | paclitaxel | SD |
| Page: 1 2 |
Top |
Related drugs of malignant transformation related genes |
| Identification of chemicals and drugs interact with genes involved in malignant transfromation |
| (DGIdb 4.0) |
| Entrez ID | Symbol | Category | Interaction Types | Drug Claim Name | Drug Name | PMIDs |
| Page: 1 |

Copyright 2023-Present -The University of Texas Health Science Center at Houston |