
|
|||||
|
 | |
| |
| |
| |
| |
| |
|
Gene: AIFM2 |
Gene summary for AIFM2 |
| Gene information | Species | Human | Gene symbol | AIFM2 | Gene ID | 84883 |
| Gene name | apoptosis inducing factor mitochondria associated 2 | |
| Gene Alias | AMID | |
| Cytomap | 10q22.1 | |
| Gene Type | protein-coding | GO ID | GO:0006091 | UniProtAcc | Q9BRQ8 |
Top |
Malignant transformation analysis |
| Identification of the aberrant gene expression in precancerous and cancerous lesions by comparing the gene expression of stem-like cells in diseased tissues with normal stem cells |
| Entrez ID | Symbol | Replicates | Species | Organ | Tissue | Adj P-value | Log2FC | Malignancy |
| 84883 | AIFM2 | LZE4T | Human | Esophagus | ESCC | 1.18e-06 | 2.34e-01 | 0.0811 |
| 84883 | AIFM2 | LZE22T | Human | Esophagus | ESCC | 3.05e-05 | 3.09e-01 | 0.068 |
| 84883 | AIFM2 | LZE24T | Human | Esophagus | ESCC | 3.62e-04 | 2.32e-01 | 0.0596 |
| 84883 | AIFM2 | LZE6T | Human | Esophagus | ESCC | 3.34e-03 | 2.84e-01 | 0.0845 |
| 84883 | AIFM2 | P2T-E | Human | Esophagus | ESCC | 4.30e-09 | 2.51e-01 | 0.1177 |
| 84883 | AIFM2 | P4T-E | Human | Esophagus | ESCC | 4.51e-12 | 4.11e-01 | 0.1323 |
| 84883 | AIFM2 | P5T-E | Human | Esophagus | ESCC | 1.84e-15 | 2.93e-01 | 0.1327 |
| 84883 | AIFM2 | P8T-E | Human | Esophagus | ESCC | 6.80e-03 | 7.46e-02 | 0.0889 |
| 84883 | AIFM2 | P9T-E | Human | Esophagus | ESCC | 4.56e-09 | 2.32e-01 | 0.1131 |
| 84883 | AIFM2 | P11T-E | Human | Esophagus | ESCC | 1.93e-05 | 1.96e-01 | 0.1426 |
| 84883 | AIFM2 | P12T-E | Human | Esophagus | ESCC | 4.53e-07 | 2.06e-01 | 0.1122 |
| 84883 | AIFM2 | P15T-E | Human | Esophagus | ESCC | 6.36e-05 | 2.31e-01 | 0.1149 |
| 84883 | AIFM2 | P16T-E | Human | Esophagus | ESCC | 1.22e-05 | 5.55e-02 | 0.1153 |
| 84883 | AIFM2 | P17T-E | Human | Esophagus | ESCC | 4.20e-02 | 1.96e-01 | 0.1278 |
| 84883 | AIFM2 | P19T-E | Human | Esophagus | ESCC | 2.10e-05 | 3.78e-01 | 0.1662 |
| 84883 | AIFM2 | P20T-E | Human | Esophagus | ESCC | 3.11e-09 | 1.38e-01 | 0.1124 |
| 84883 | AIFM2 | P21T-E | Human | Esophagus | ESCC | 5.05e-28 | 6.65e-01 | 0.1617 |
| 84883 | AIFM2 | P22T-E | Human | Esophagus | ESCC | 8.63e-05 | 7.97e-02 | 0.1236 |
| 84883 | AIFM2 | P23T-E | Human | Esophagus | ESCC | 6.29e-07 | 9.94e-02 | 0.108 |
| 84883 | AIFM2 | P24T-E | Human | Esophagus | ESCC | 3.02e-19 | 4.96e-01 | 0.1287 |
| Page: 1 2 3 4 |
| Tissue | Expression Dynamics | Abbreviation |
| Esophagus |  | ESCC: Esophageal squamous cell carcinoma |
| HGIN: High-grade intraepithelial neoplasias | ||
| LGIN: Low-grade intraepithelial neoplasias | ||
| Liver |  | HCC: Hepatocellular carcinoma |
| NAFLD: Non-alcoholic fatty liver disease | ||
| Oral Cavity | 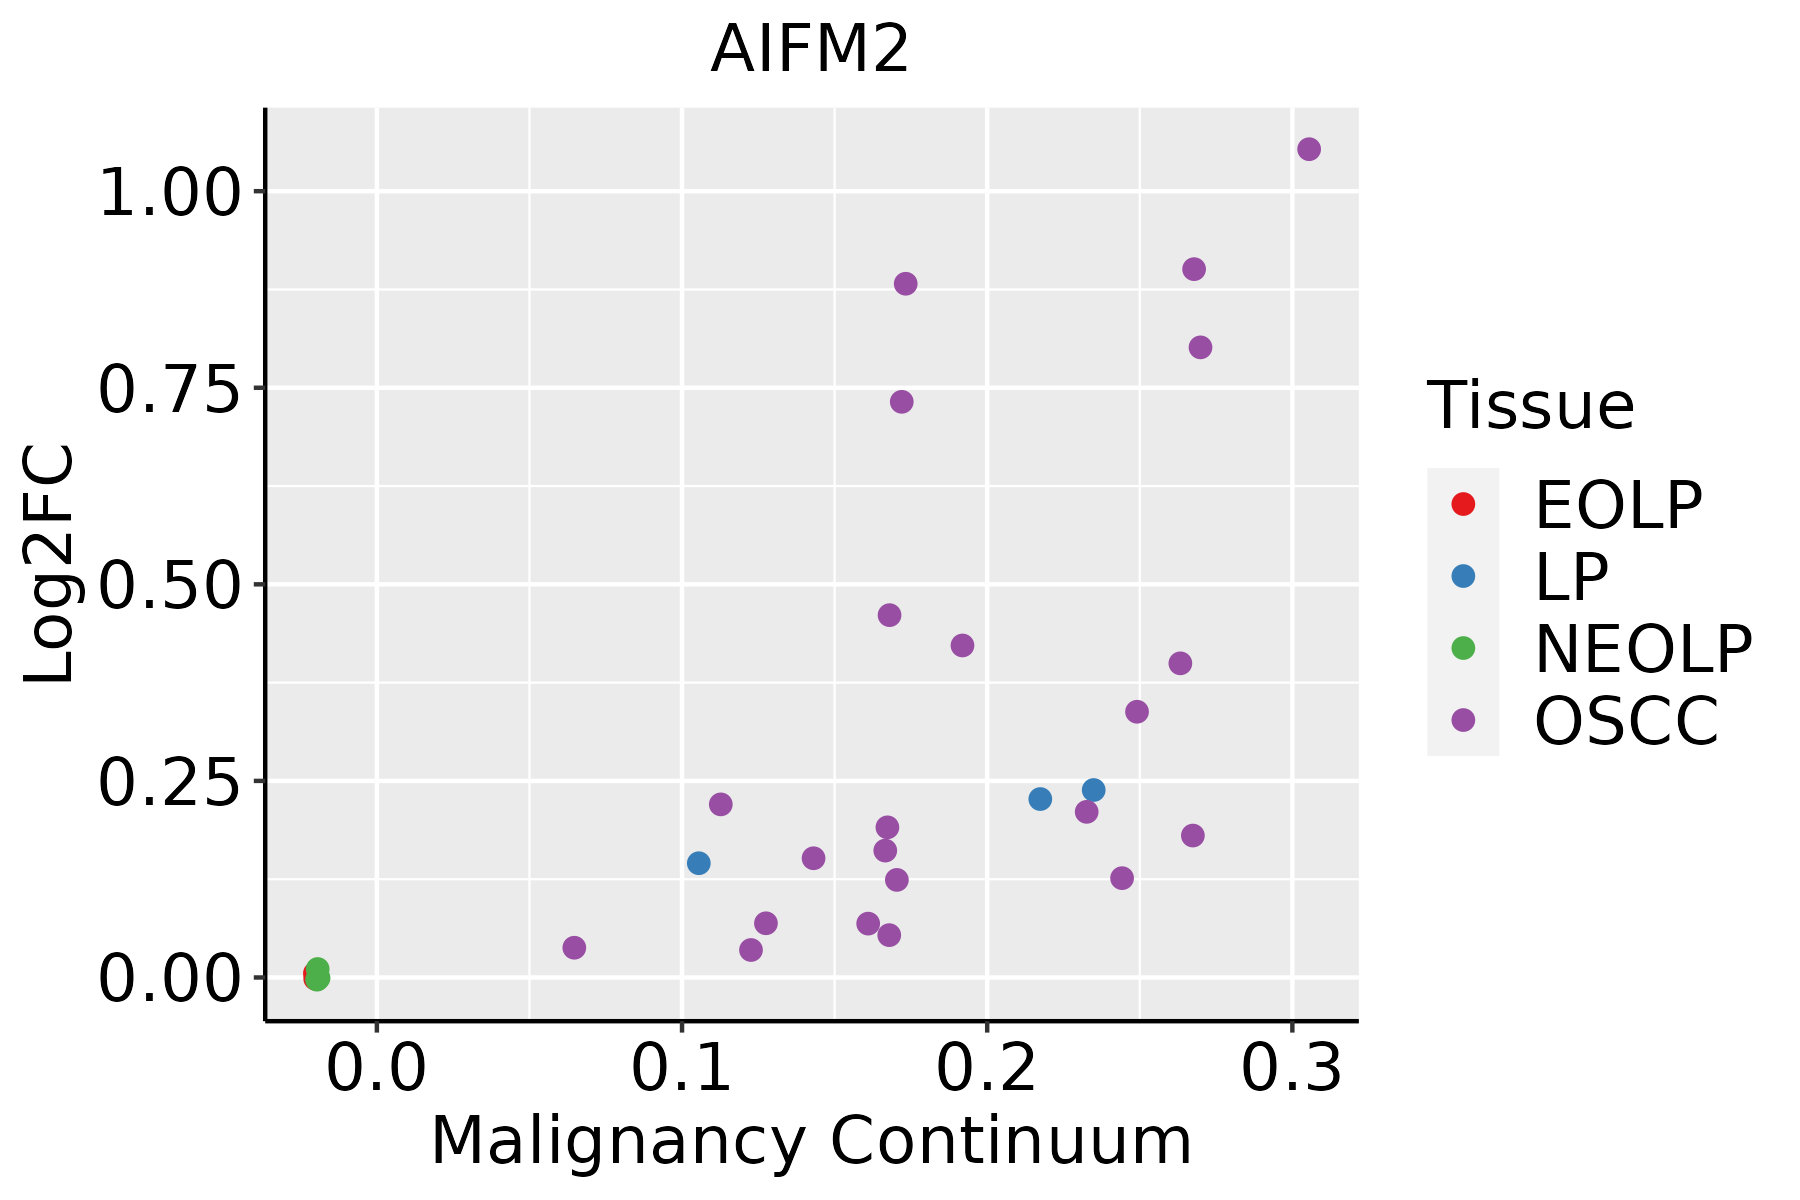 | EOLP: Erosive Oral lichen planus |
| LP: leukoplakia | ||
| NEOLP: Non-erosive oral lichen planus | ||
| OSCC: Oral squamous cell carcinoma |
| ∗log2FC in expression of this searched gene in stem-like cells from each diseased tissue sample relative to stem-like cells in normal samples in each tissue plotted against the malignancy continuum. Samples are colored based on if they are from different disease stage. |
Top |
Malignant transformation related pathway analysis |
| Find out the enriched GO biological processes and KEGG pathways involved in transition from healthy to precancer to cancer |
| Tissue | Disease Stage | Enriched GO biological Processes |
| Colorectum | AD |  |
| Colorectum | SER |  |
| Colorectum | MSS |  |
| Colorectum | MSI-H |  |
| Colorectum | FAP |  |
| ∗Top 15 enriched GO BP terms are showed in the bar plot of each disease state in each tissue. Each row represents a significant GO biological process which is colored according to the -log10(p.adjust). |
| Page: 1 2 3 4 5 6 7 8 9 |
| GO ID | Tissue | Disease Stage | Description | Gene Ratio | Bg Ratio | pvalue | p.adjust | Count |
| GO:0006091110 | Esophagus | ESCC | generation of precursor metabolites and energy | 331/8552 | 490/18723 | 3.86e-23 | 8.45e-21 | 331 |
| GO:0006979111 | Esophagus | ESCC | response to oxidative stress | 303/8552 | 446/18723 | 7.15e-22 | 1.30e-19 | 303 |
| GO:0045333110 | Esophagus | ESCC | cellular respiration | 173/8552 | 230/18723 | 4.53e-20 | 5.99e-18 | 173 |
| GO:0062197111 | Esophagus | ESCC | cellular response to chemical stress | 234/8552 | 337/18723 | 5.37e-19 | 5.97e-17 | 234 |
| GO:0015980110 | Esophagus | ESCC | energy derivation by oxidation of organic compounds | 220/8552 | 318/18723 | 1.20e-17 | 1.09e-15 | 220 |
| GO:0022900110 | Esophagus | ESCC | electron transport chain | 133/8552 | 175/18723 | 2.18e-16 | 1.67e-14 | 133 |
| GO:0034599111 | Esophagus | ESCC | cellular response to oxidative stress | 197/8552 | 288/18723 | 3.76e-15 | 2.15e-13 | 197 |
| GO:0022904110 | Esophagus | ESCC | respiratory electron transport chain | 89/8552 | 114/18723 | 1.36e-12 | 5.80e-11 | 89 |
| GO:0008637110 | Esophagus | ESCC | apoptotic mitochondrial changes | 83/8552 | 107/18723 | 1.43e-11 | 5.08e-10 | 83 |
| GO:190166112 | Esophagus | ESCC | quinone metabolic process | 34/8552 | 40/18723 | 3.00e-07 | 4.27e-06 | 34 |
| GO:00067432 | Esophagus | ESCC | ubiquinone metabolic process | 17/8552 | 19/18723 | 9.02e-05 | 6.50e-04 | 17 |
| GO:00421805 | Esophagus | ESCC | cellular ketone metabolic process | 120/8552 | 211/18723 | 6.70e-04 | 3.55e-03 | 120 |
| GO:190288220 | Esophagus | ESCC | regulation of response to oxidative stress | 58/8552 | 98/18723 | 4.86e-03 | 1.88e-02 | 58 |
| GO:190040720 | Esophagus | ESCC | regulation of cellular response to oxidative stress | 52/8552 | 89/18723 | 1.04e-02 | 3.56e-02 | 52 |
| GO:000609122 | Liver | HCC | generation of precursor metabolites and energy | 340/7958 | 490/18723 | 4.04e-34 | 2.85e-31 | 340 |
| GO:004533312 | Liver | HCC | cellular respiration | 171/7958 | 230/18723 | 6.35e-23 | 1.26e-20 | 171 |
| GO:001598022 | Liver | HCC | energy derivation by oxidation of organic compounds | 221/7958 | 318/18723 | 1.02e-22 | 1.86e-20 | 221 |
| GO:002290022 | Liver | HCC | electron transport chain | 134/7958 | 175/18723 | 3.32e-20 | 4.68e-18 | 134 |
| GO:000697922 | Liver | HCC | response to oxidative stress | 281/7958 | 446/18723 | 9.75e-19 | 1.24e-16 | 281 |
| GO:006219722 | Liver | HCC | cellular response to chemical stress | 216/7958 | 337/18723 | 6.86e-16 | 5.44e-14 | 216 |
| Page: 1 2 3 |
| Pathway ID | Tissue | Disease Stage | Description | Gene Ratio | Bg Ratio | pvalue | p.adjust | qvalue | Count |
| hsa0411524 | Esophagus | ESCC | p53 signaling pathway | 65/4205 | 74/8465 | 3.88e-12 | 6.50e-11 | 3.33e-11 | 65 |
| hsa0411534 | Esophagus | ESCC | p53 signaling pathway | 65/4205 | 74/8465 | 3.88e-12 | 6.50e-11 | 3.33e-11 | 65 |
| hsa041156 | Liver | HCC | p53 signaling pathway | 46/4020 | 74/8465 | 7.64e-03 | 2.08e-02 | 1.16e-02 | 46 |
| hsa0411511 | Liver | HCC | p53 signaling pathway | 46/4020 | 74/8465 | 7.64e-03 | 2.08e-02 | 1.16e-02 | 46 |
| Page: 1 |
Top |
Cell-cell communication analysis |
| Identification of potential cell-cell interactions between two cell types and their ligand-receptor pairs for different disease states |
| Ligand | Receptor | LRpair | Pathway | Tissue | Disease Stage |
| Page: 1 |
Top |
Single-cell gene regulatory network inference analysis |
| Find out the significant the regulons (TFs) and the target genes of each regulon across cell types for different disease states |
| TF | Cell Type | Tissue | Disease Stage | Target Gene | RSS | Regulon Activity |
| ∗The dot plots of a searched regulon are shown for all cell subpopulations in each disease state of each tissue based on the regulon specific score inferred using pySCENIC and by calculating the average expression. |
| Page: 1 |
Top |
Somatic mutation of malignant transformation related genes |
| Annotation of somatic variants for genes involved in malignant transformation |
| Hugo Symbol | Variant Class | Variant Classification | dbSNP RS | HGVSc | HGVSp | HGVSp Short | SWISSPROT | BIOTYPE | SIFT | PolyPhen | Tumor Sample Barcode | Tissue | Histology | Sex | Age | Stage | Therapy Types | Drugs | Outcome |
| AIFM2 | SNV | Missense_Mutation | c.952C>G | p.Leu318Val | p.L318V | Q9BRQ8 | protein_coding | deleterious(0.04) | benign(0.06) | TCGA-A2-A0YK-01 | Breast | breast invasive carcinoma | Female | <65 | I/II | Chemotherapy | cytoxan | SD | |
| AIFM2 | SNV | Missense_Mutation | c.853G>A | p.Asp285Asn | p.D285N | Q9BRQ8 | protein_coding | deleterious(0) | probably_damaging(0.985) | TCGA-AC-A23H-01 | Breast | breast invasive carcinoma | Female | >=65 | I/II | Unknown | Unknown | PD | |
| AIFM2 | SNV | Missense_Mutation | rs138906337 | c.928N>A | p.Val310Ile | p.V310I | Q9BRQ8 | protein_coding | tolerated(1) | benign(0) | TCGA-AA-3710-01 | Colorectum | colon adenocarcinoma | Female | >=65 | I/II | Unknown | Unknown | SD |
| AIFM2 | SNV | Missense_Mutation | rs774916584 | c.592N>T | p.Arg198Trp | p.R198W | Q9BRQ8 | protein_coding | deleterious(0) | possibly_damaging(0.809) | TCGA-AA-A01R-01 | Colorectum | colon adenocarcinoma | Male | <65 | III/IV | Chemotherapy | 5-fluorouracil | PD |
| AIFM2 | SNV | Missense_Mutation | novel | c.256N>T | p.Asp86Tyr | p.D86Y | Q9BRQ8 | protein_coding | deleterious(0) | probably_damaging(0.984) | TCGA-EI-6917-01 | Colorectum | rectum adenocarcinoma | Male | <65 | III/IV | Chemotherapy | 5fluorouracil+oxaciplatina+l-folinian | SD |
| AIFM2 | SNV | Missense_Mutation | novel | c.761N>G | p.Lys254Arg | p.K254R | Q9BRQ8 | protein_coding | tolerated(0.14) | benign(0.003) | TCGA-AJ-A3EK-01 | Endometrium | uterine corpus endometrioid carcinoma | Female | <65 | I/II | Chemotherapy | carboplatin | CR |
| AIFM2 | SNV | Missense_Mutation | c.656N>C | p.Glu219Ala | p.E219A | Q9BRQ8 | protein_coding | tolerated(0.42) | benign(0.015) | TCGA-AP-A059-01 | Endometrium | uterine corpus endometrioid carcinoma | Female | >=65 | I/II | Unknown | Unknown | SD | |
| AIFM2 | SNV | Missense_Mutation | c.538N>A | p.Ala180Thr | p.A180T | Q9BRQ8 | protein_coding | deleterious(0.01) | possibly_damaging(0.762) | TCGA-AP-A059-01 | Endometrium | uterine corpus endometrioid carcinoma | Female | >=65 | I/II | Unknown | Unknown | SD | |
| AIFM2 | SNV | Missense_Mutation | c.322N>A | p.Ala108Thr | p.A108T | Q9BRQ8 | protein_coding | deleterious(0.01) | probably_damaging(0.986) | TCGA-AP-A05N-01 | Endometrium | uterine corpus endometrioid carcinoma | Female | <65 | I/II | Unknown | Unknown | SD | |
| AIFM2 | SNV | Missense_Mutation | rs771383095 | c.161N>A | p.Arg54Gln | p.R54Q | Q9BRQ8 | protein_coding | deleterious(0) | probably_damaging(1) | TCGA-AP-A0LM-01 | Endometrium | uterine corpus endometrioid carcinoma | Female | <65 | III/IV | Chemotherapy | cisplatin | SD |
| Page: 1 2 3 4 |
Top |
Related drugs of malignant transformation related genes |
| Identification of chemicals and drugs interact with genes involved in malignant transfromation |
| (DGIdb 4.0) |
| Entrez ID | Symbol | Category | Interaction Types | Drug Claim Name | Drug Name | PMIDs |
| Page: 1 |

Copyright 2023-Present -The University of Texas Health Science Center at Houston |