
|
|||||
|
 | |
| |
| |
| |
| |
| |
|
Gene: AIFM1 |
Gene summary for AIFM1 |
| Gene information | Species | Human | Gene symbol | AIFM1 | Gene ID | 9131 |
| Gene name | apoptosis inducing factor mitochondria associated 1 | |
| Gene Alias | AIF | |
| Cytomap | Xq26.1 | |
| Gene Type | protein-coding | GO ID | GO:0000302 | UniProtAcc | E9PMA0 |
Top |
Malignant transformation analysis |
| Identification of the aberrant gene expression in precancerous and cancerous lesions by comparing the gene expression of stem-like cells in diseased tissues with normal stem cells |
| Entrez ID | Symbol | Replicates | Species | Organ | Tissue | Adj P-value | Log2FC | Malignancy |
| 9131 | AIFM1 | LZE4T | Human | Esophagus | ESCC | 1.29e-08 | 1.75e-01 | 0.0811 |
| 9131 | AIFM1 | LZE7T | Human | Esophagus | ESCC | 3.56e-11 | 4.24e-01 | 0.0667 |
| 9131 | AIFM1 | LZE8T | Human | Esophagus | ESCC | 3.16e-05 | 1.63e-01 | 0.067 |
| 9131 | AIFM1 | LZE20T | Human | Esophagus | ESCC | 4.96e-03 | 1.27e-01 | 0.0662 |
| 9131 | AIFM1 | LZE22T | Human | Esophagus | ESCC | 1.73e-04 | 3.52e-01 | 0.068 |
| 9131 | AIFM1 | LZE24T | Human | Esophagus | ESCC | 1.19e-17 | 4.30e-01 | 0.0596 |
| 9131 | AIFM1 | LZE6T | Human | Esophagus | ESCC | 5.45e-06 | 3.17e-01 | 0.0845 |
| 9131 | AIFM1 | P1T-E | Human | Esophagus | ESCC | 1.83e-07 | 3.27e-01 | 0.0875 |
| 9131 | AIFM1 | P2T-E | Human | Esophagus | ESCC | 7.28e-21 | 3.93e-01 | 0.1177 |
| 9131 | AIFM1 | P4T-E | Human | Esophagus | ESCC | 1.14e-15 | 3.94e-01 | 0.1323 |
| 9131 | AIFM1 | P5T-E | Human | Esophagus | ESCC | 2.16e-07 | 1.44e-01 | 0.1327 |
| 9131 | AIFM1 | P8T-E | Human | Esophagus | ESCC | 8.97e-13 | 2.60e-01 | 0.0889 |
| 9131 | AIFM1 | P9T-E | Human | Esophagus | ESCC | 1.53e-16 | 3.76e-01 | 0.1131 |
| 9131 | AIFM1 | P10T-E | Human | Esophagus | ESCC | 2.13e-23 | 3.23e-01 | 0.116 |
| 9131 | AIFM1 | P11T-E | Human | Esophagus | ESCC | 1.87e-11 | 3.52e-01 | 0.1426 |
| 9131 | AIFM1 | P12T-E | Human | Esophagus | ESCC | 7.33e-12 | 1.92e-01 | 0.1122 |
| 9131 | AIFM1 | P15T-E | Human | Esophagus | ESCC | 5.35e-17 | 2.68e-01 | 0.1149 |
| 9131 | AIFM1 | P16T-E | Human | Esophagus | ESCC | 1.33e-07 | 1.28e-01 | 0.1153 |
| 9131 | AIFM1 | P17T-E | Human | Esophagus | ESCC | 2.35e-04 | 1.69e-01 | 0.1278 |
| 9131 | AIFM1 | P19T-E | Human | Esophagus | ESCC | 2.22e-10 | 6.11e-01 | 0.1662 |
| Page: 1 2 3 4 5 6 |
| Tissue | Expression Dynamics | Abbreviation |
| Esophagus | 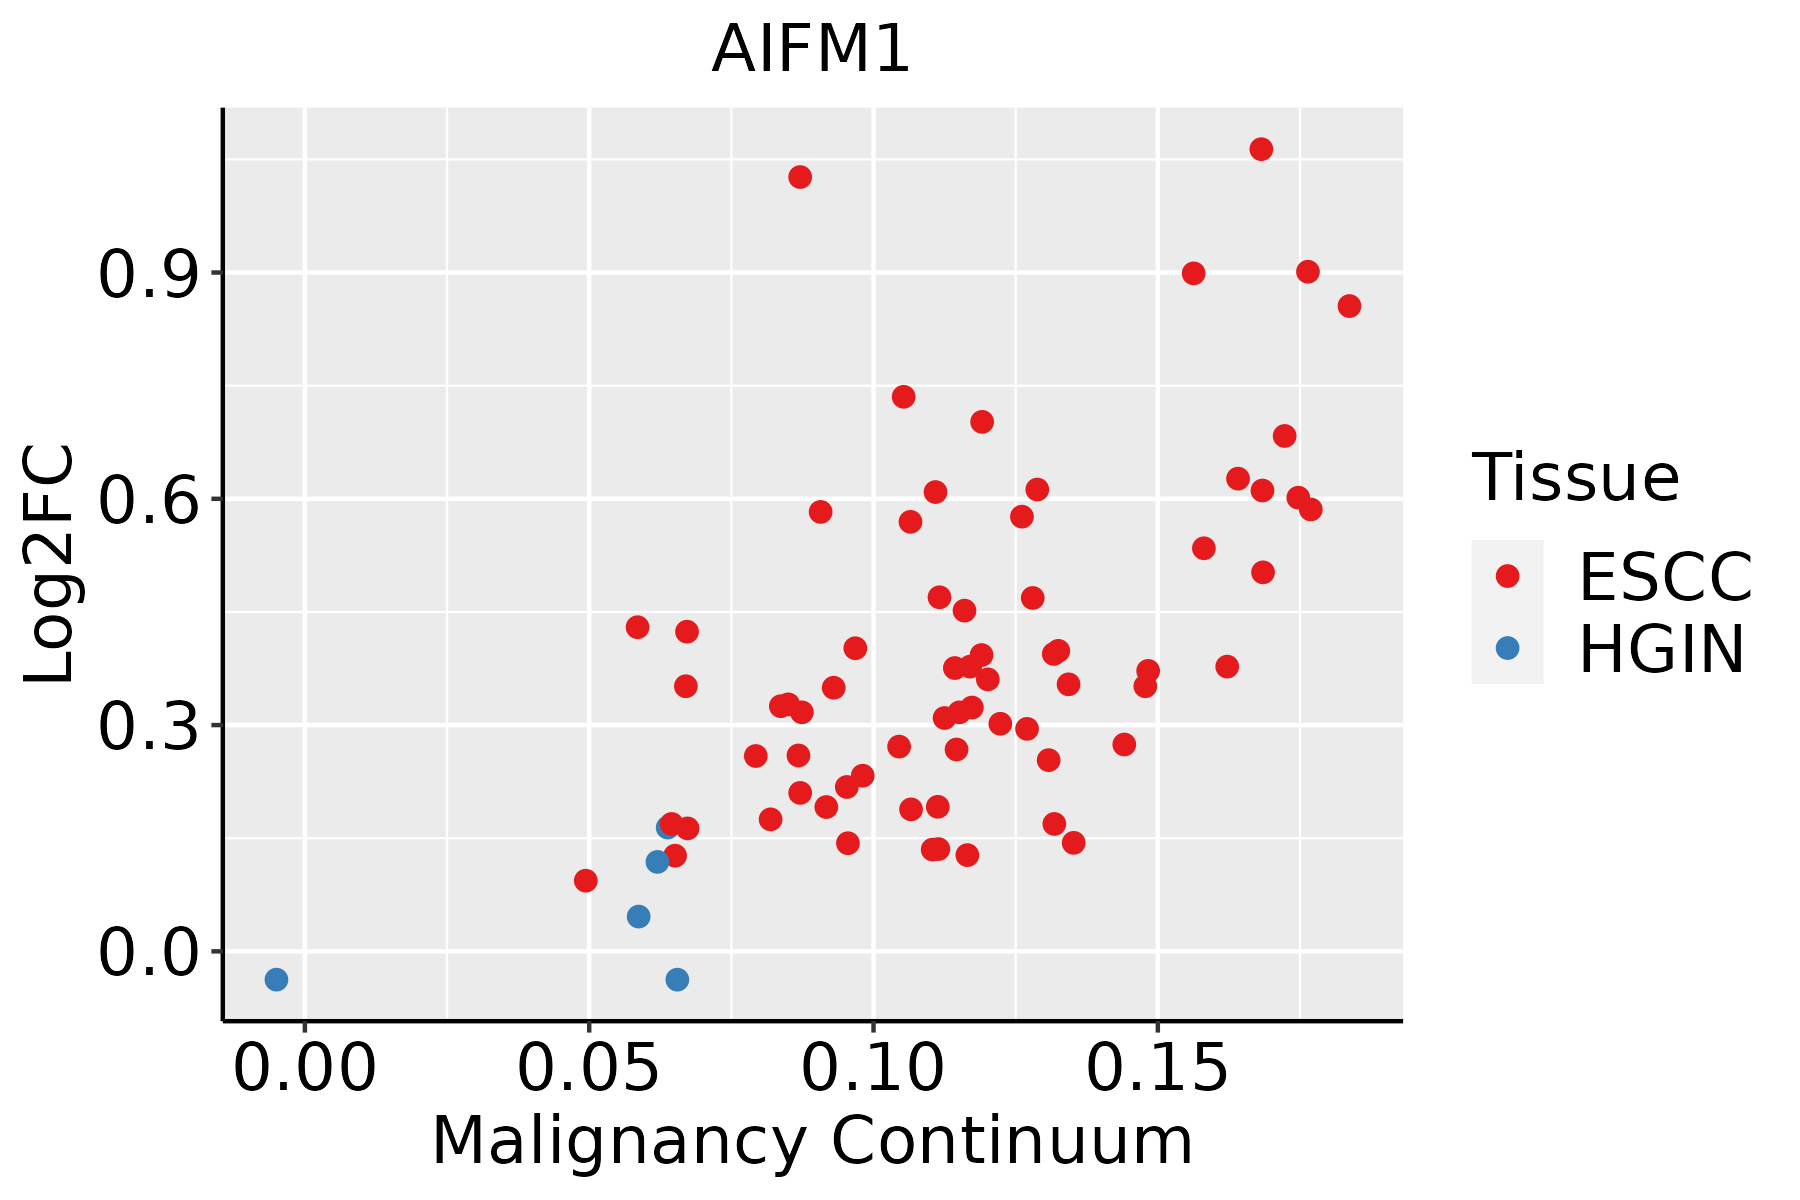 | ESCC: Esophageal squamous cell carcinoma |
| HGIN: High-grade intraepithelial neoplasias | ||
| LGIN: Low-grade intraepithelial neoplasias | ||
| Liver | 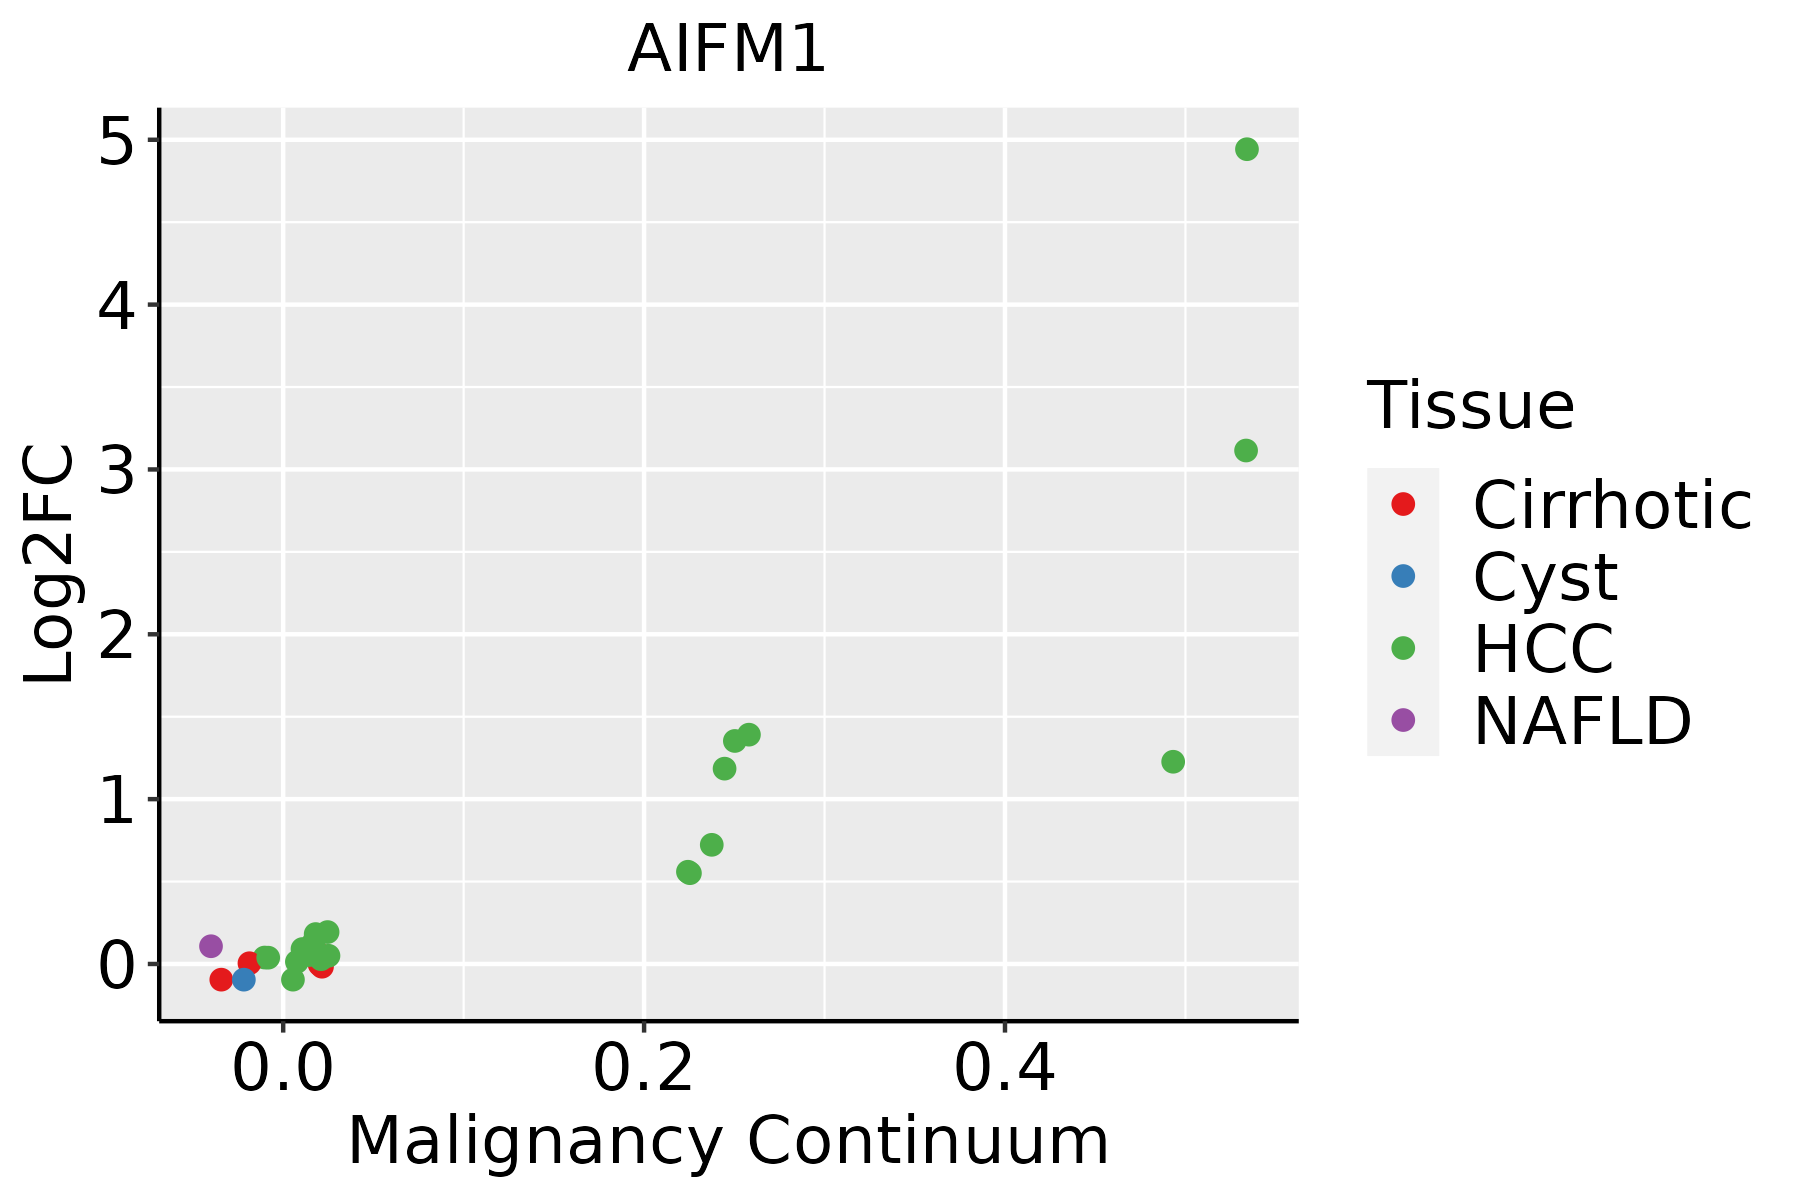 | HCC: Hepatocellular carcinoma |
| NAFLD: Non-alcoholic fatty liver disease | ||
| Oral Cavity | 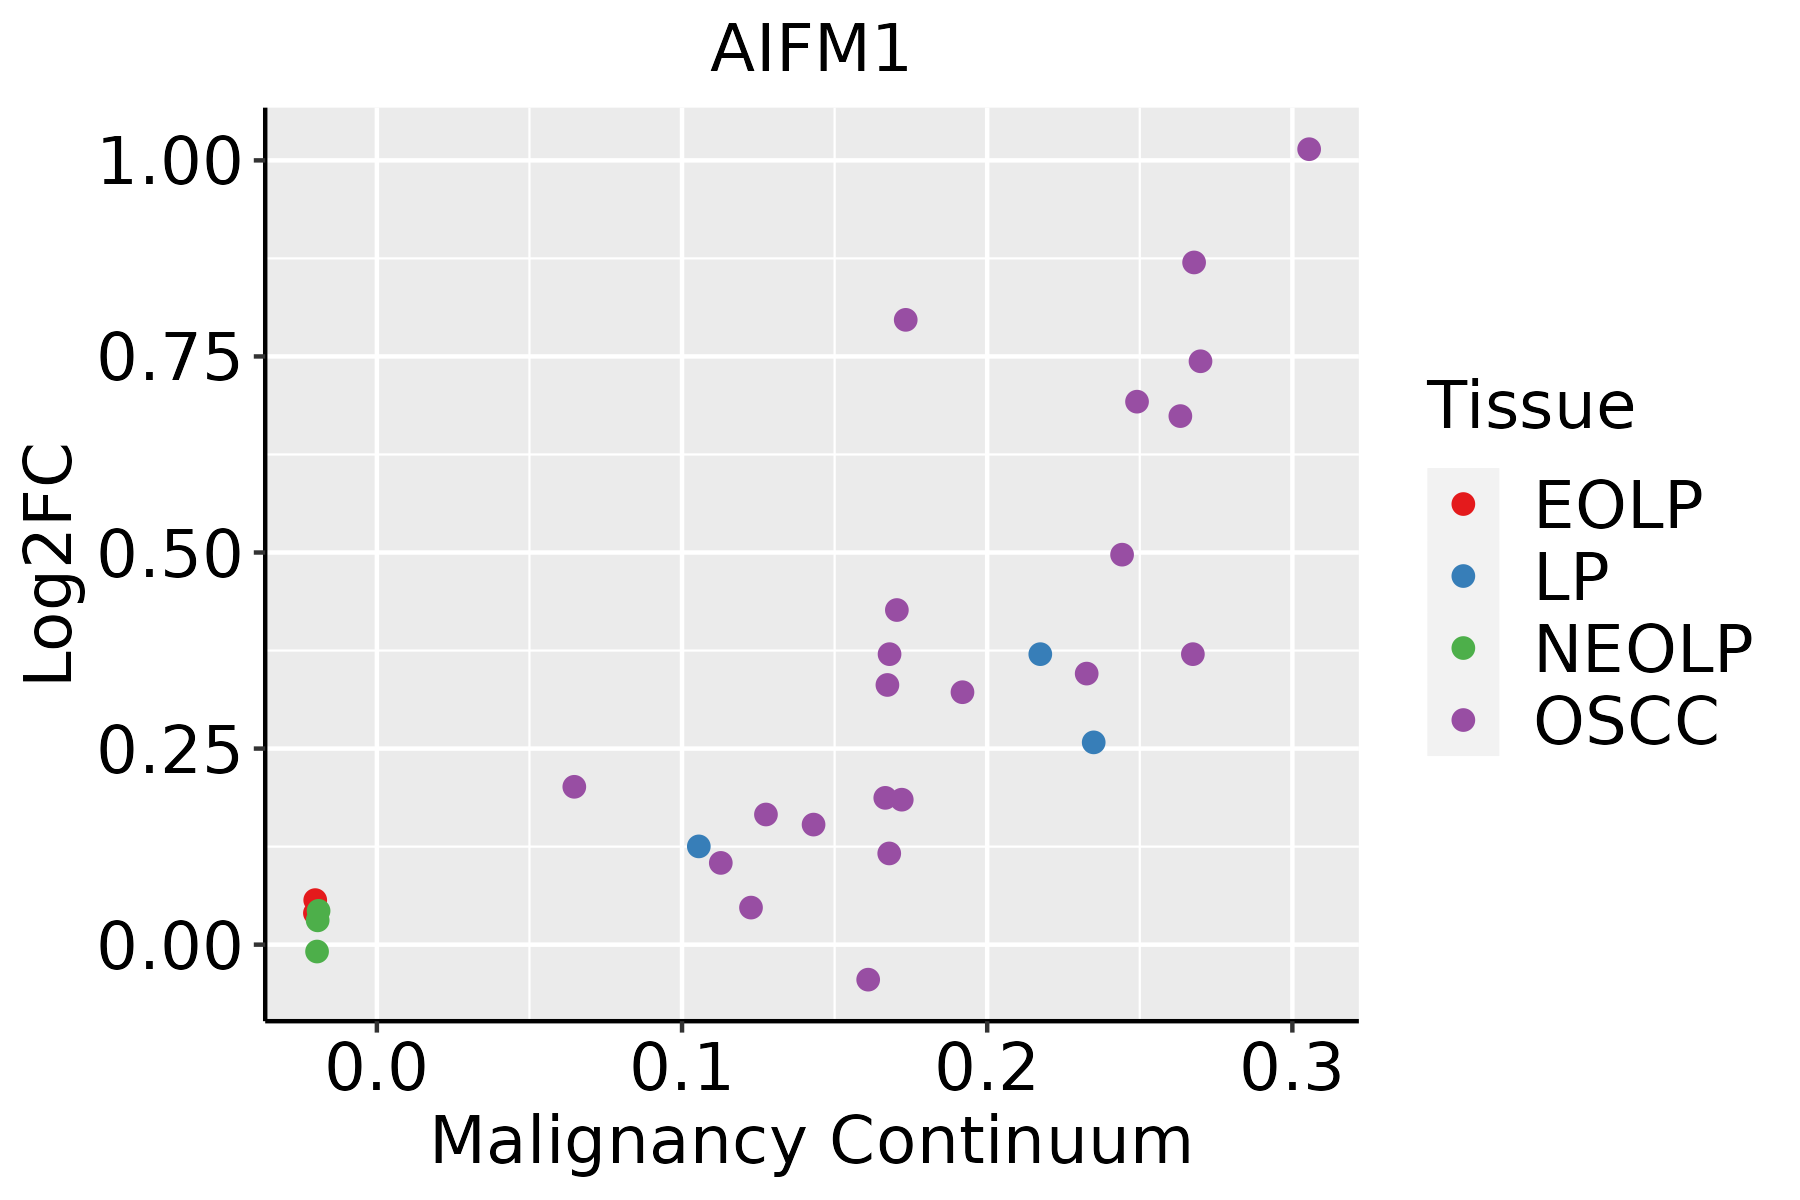 | EOLP: Erosive Oral lichen planus |
| LP: leukoplakia | ||
| NEOLP: Non-erosive oral lichen planus | ||
| OSCC: Oral squamous cell carcinoma | ||
| Thyroid | 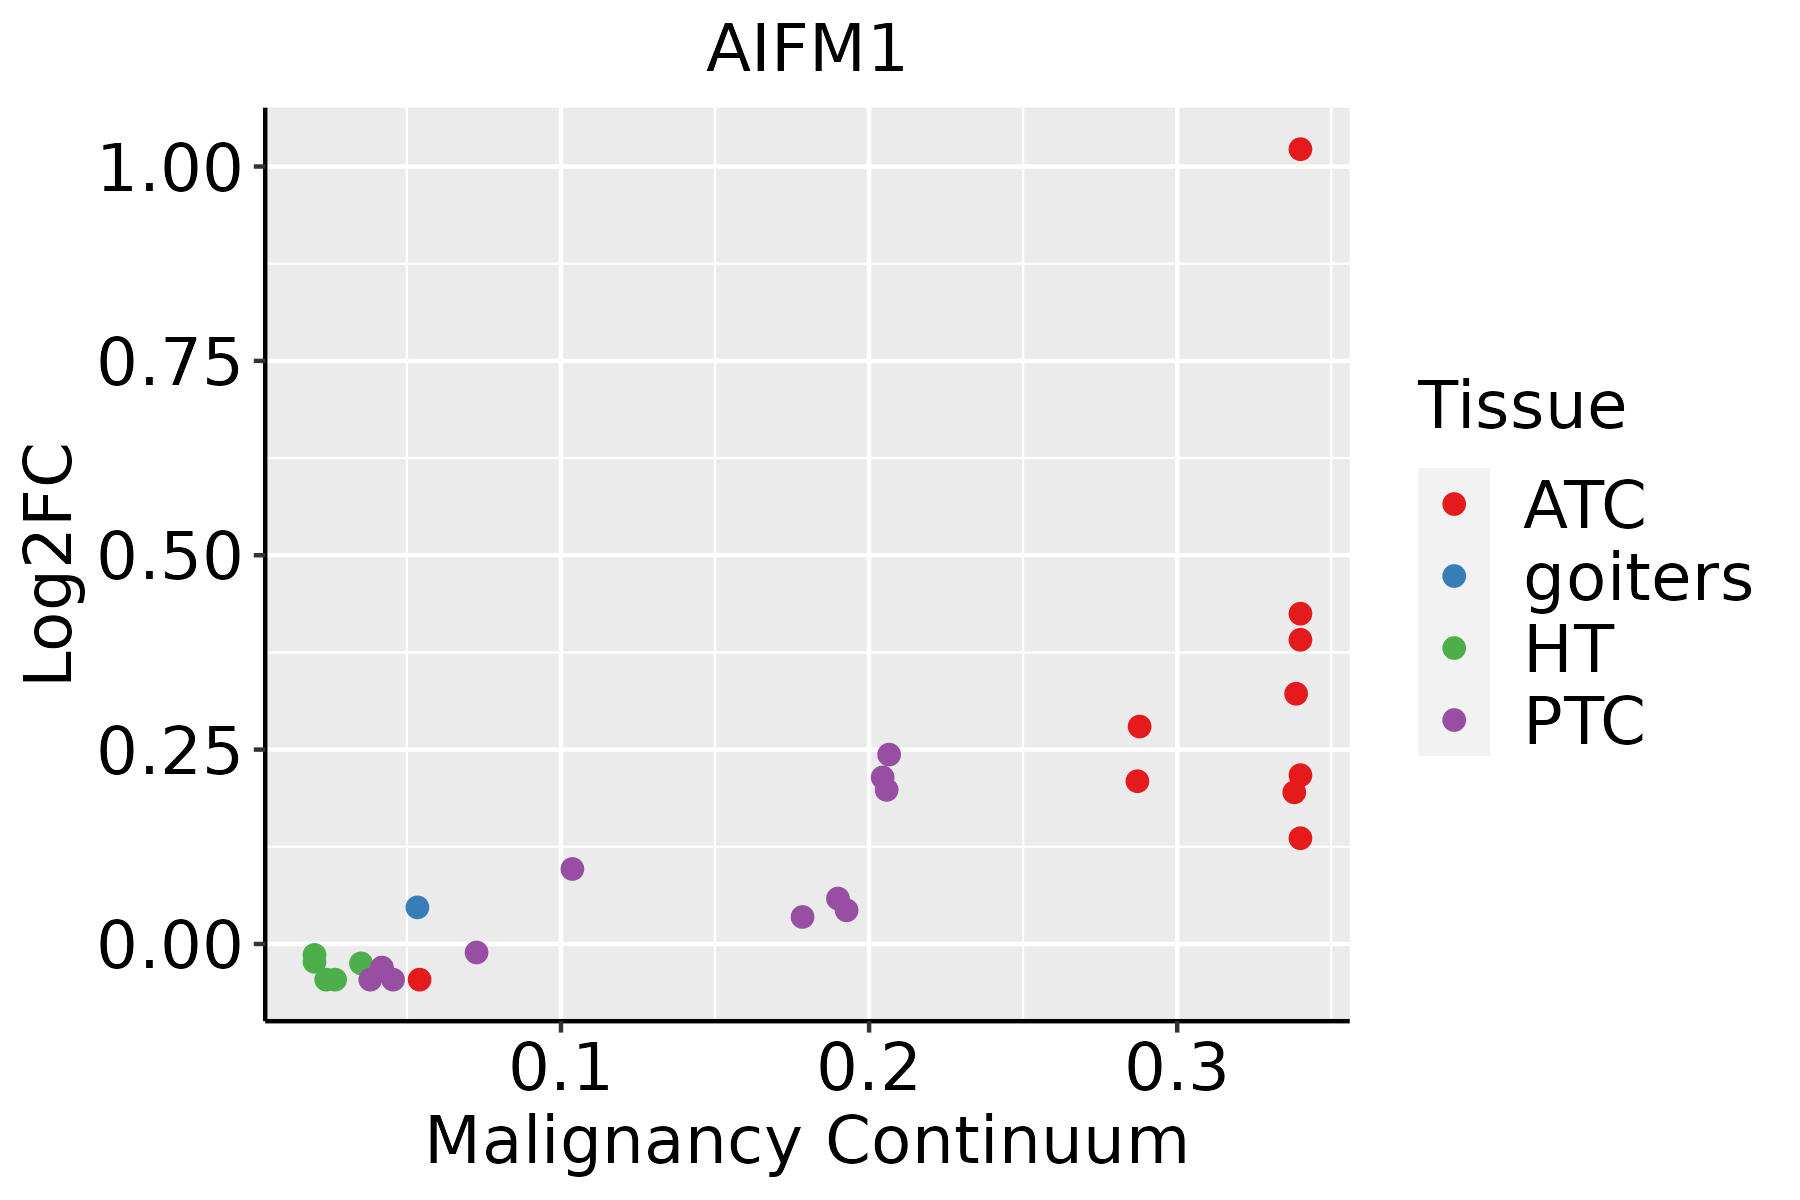 | ATC: Anaplastic thyroid cancer |
| HT: Hashimoto's thyroiditis | ||
| PTC: Papillary thyroid cancer |
| ∗log2FC in expression of this searched gene in stem-like cells from each diseased tissue sample relative to stem-like cells in normal samples in each tissue plotted against the malignancy continuum. Samples are colored based on if they are from different disease stage. |
Top |
Malignant transformation related pathway analysis |
| Find out the enriched GO biological processes and KEGG pathways involved in transition from healthy to precancer to cancer |
| Tissue | Disease Stage | Enriched GO biological Processes |
| Colorectum | AD |  |
| Colorectum | SER |  |
| Colorectum | MSS |  |
| Colorectum | MSI-H |  |
| Colorectum | FAP |  |
| ∗Top 15 enriched GO BP terms are showed in the bar plot of each disease state in each tissue. Each row represents a significant GO biological process which is colored according to the -log10(p.adjust). |
| Page: 1 2 3 4 5 6 7 8 9 |
| GO ID | Tissue | Disease Stage | Description | Gene Ratio | Bg Ratio | pvalue | p.adjust | Count |
| GO:0072594110 | Esophagus | ESCC | establishment of protein localization to organelle | 311/8552 | 422/18723 | 3.02e-32 | 2.13e-29 | 311 |
| GO:0097193111 | Esophagus | ESCC | intrinsic apoptotic signaling pathway | 222/8552 | 288/18723 | 5.87e-28 | 2.02e-25 | 222 |
| GO:0022411111 | Esophagus | ESCC | cellular component disassembly | 305/8552 | 443/18723 | 1.94e-23 | 4.57e-21 | 305 |
| GO:0006605111 | Esophagus | ESCC | protein targeting | 229/8552 | 314/18723 | 4.93e-23 | 1.01e-20 | 229 |
| GO:0034976111 | Esophagus | ESCC | response to endoplasmic reticulum stress | 192/8552 | 256/18723 | 7.15e-22 | 1.30e-19 | 192 |
| GO:0006979111 | Esophagus | ESCC | response to oxidative stress | 303/8552 | 446/18723 | 7.15e-22 | 1.30e-19 | 303 |
| GO:0045862111 | Esophagus | ESCC | positive regulation of proteolysis | 256/8552 | 372/18723 | 7.88e-20 | 9.43e-18 | 256 |
| GO:0006839110 | Esophagus | ESCC | mitochondrial transport | 187/8552 | 254/18723 | 8.35e-20 | 9.81e-18 | 187 |
| GO:0062197111 | Esophagus | ESCC | cellular response to chemical stress | 234/8552 | 337/18723 | 5.37e-19 | 5.97e-17 | 234 |
| GO:0033108110 | Esophagus | ESCC | mitochondrial respiratory chain complex assembly | 83/8552 | 93/18723 | 9.56e-19 | 1.05e-16 | 83 |
| GO:0034655110 | Esophagus | ESCC | nucleobase-containing compound catabolic process | 272/8552 | 407/18723 | 2.92e-18 | 2.90e-16 | 272 |
| GO:004670018 | Esophagus | ESCC | heterocycle catabolic process | 286/8552 | 445/18723 | 1.12e-15 | 7.47e-14 | 286 |
| GO:0072655110 | Esophagus | ESCC | establishment of protein localization to mitochondrion | 97/8552 | 120/18723 | 2.17e-15 | 1.33e-13 | 97 |
| GO:0070585110 | Esophagus | ESCC | protein localization to mitochondrion | 100/8552 | 125/18723 | 2.96e-15 | 1.77e-13 | 100 |
| GO:004427019 | Esophagus | ESCC | cellular nitrogen compound catabolic process | 288/8552 | 451/18723 | 3.03e-15 | 1.79e-13 | 288 |
| GO:0034599111 | Esophagus | ESCC | cellular response to oxidative stress | 197/8552 | 288/18723 | 3.76e-15 | 2.15e-13 | 197 |
| GO:0071496111 | Esophagus | ESCC | cellular response to external stimulus | 215/8552 | 320/18723 | 4.29e-15 | 2.43e-13 | 215 |
| GO:001703818 | Esophagus | ESCC | protein import | 149/8552 | 206/18723 | 5.90e-15 | 3.31e-13 | 149 |
| GO:001943918 | Esophagus | ESCC | aromatic compound catabolic process | 295/8552 | 467/18723 | 1.09e-14 | 5.98e-13 | 295 |
| GO:190136118 | Esophagus | ESCC | organic cyclic compound catabolic process | 307/8552 | 495/18723 | 9.99e-14 | 4.80e-12 | 307 |
| Page: 1 2 3 4 5 6 7 8 9 10 11 12 13 14 15 16 17 |
| Pathway ID | Tissue | Disease Stage | Description | Gene Ratio | Bg Ratio | pvalue | p.adjust | qvalue | Count |
| hsa0421027 | Esophagus | ESCC | Apoptosis | 102/4205 | 136/8465 | 1.05e-09 | 1.21e-08 | 6.21e-09 | 102 |
| hsa0421037 | Esophagus | ESCC | Apoptosis | 102/4205 | 136/8465 | 1.05e-09 | 1.21e-08 | 6.21e-09 | 102 |
| hsa042102 | Liver | HCC | Apoptosis | 83/4020 | 136/8465 | 9.51e-04 | 3.58e-03 | 1.99e-03 | 83 |
| hsa042103 | Liver | HCC | Apoptosis | 83/4020 | 136/8465 | 9.51e-04 | 3.58e-03 | 1.99e-03 | 83 |
| hsa0421018 | Oral cavity | OSCC | Apoptosis | 101/3704 | 136/8465 | 3.34e-13 | 7.00e-12 | 3.56e-12 | 101 |
| hsa0421019 | Oral cavity | OSCC | Apoptosis | 101/3704 | 136/8465 | 3.34e-13 | 7.00e-12 | 3.56e-12 | 101 |
| Page: 1 |
Top |
Cell-cell communication analysis |
| Identification of potential cell-cell interactions between two cell types and their ligand-receptor pairs for different disease states |
| Ligand | Receptor | LRpair | Pathway | Tissue | Disease Stage |
| Page: 1 |
Top |
Single-cell gene regulatory network inference analysis |
| Find out the significant the regulons (TFs) and the target genes of each regulon across cell types for different disease states |
| TF | Cell Type | Tissue | Disease Stage | Target Gene | RSS | Regulon Activity |
| ∗The dot plots of a searched regulon are shown for all cell subpopulations in each disease state of each tissue based on the regulon specific score inferred using pySCENIC and by calculating the average expression. |
| Page: 1 |
Top |
Somatic mutation of malignant transformation related genes |
| Annotation of somatic variants for genes involved in malignant transformation |
| Hugo Symbol | Variant Class | Variant Classification | dbSNP RS | HGVSc | HGVSp | HGVSp Short | SWISSPROT | BIOTYPE | SIFT | PolyPhen | Tumor Sample Barcode | Tissue | Histology | Sex | Age | Stage | Therapy Types | Drugs | Outcome |
| AIFM1 | SNV | Missense_Mutation | c.1743N>G | p.Ile581Met | p.I581M | O95831 | protein_coding | deleterious(0) | benign(0.06) | TCGA-A2-A25A-01 | Breast | breast invasive carcinoma | Female | <65 | I/II | Unspecific | Cytoxan | SD | |
| AIFM1 | SNV | Missense_Mutation | novel | c.1502G>A | p.Ser501Asn | p.S501N | O95831 | protein_coding | deleterious(0.03) | benign(0.408) | TCGA-AC-A6IX-01 | Breast | breast invasive carcinoma | Female | <65 | III/IV | Unknown | Unknown | SD |
| AIFM1 | SNV | Missense_Mutation | novel | c.133C>G | p.Pro45Ala | p.P45A | O95831 | protein_coding | tolerated_low_confidence(0.17) | benign(0.134) | TCGA-BH-A2L8-01 | Breast | breast invasive carcinoma | Female | <65 | I/II | Chemotherapy | cytoxan | CR |
| AIFM1 | SNV | Missense_Mutation | novel | c.68N>G | p.Val23Gly | p.V23G | O95831 | protein_coding | deleterious_low_confidence(0) | benign(0.143) | TCGA-EW-A3U0-01 | Breast | breast invasive carcinoma | Female | <65 | III/IV | Chemotherapy | cisplatin | CR |
| AIFM1 | SNV | Missense_Mutation | rs763199888 | c.1651N>A | p.Pro551Thr | p.P551T | O95831 | protein_coding | tolerated(0.15) | benign(0.001) | TCGA-GM-A2DD-01 | Breast | breast invasive carcinoma | Female | <65 | I/II | Chemotherapy | fluorouracil | CR |
| AIFM1 | SNV | Missense_Mutation | novel | c.176C>A | p.Ala59Glu | p.A59E | O95831 | protein_coding | tolerated_low_confidence(0.28) | benign(0.145) | TCGA-OL-A66P-01 | Breast | breast invasive carcinoma | Female | >=65 | I/II | Chemotherapy | cytoxan | CR |
| AIFM1 | insertion | Nonsense_Mutation | novel | c.1511_1512insGGCCTGATAGGCTTAGCTTAAGACTGGCTATC | p.Val505AlafsTer2 | p.V505Afs*2 | O95831 | protein_coding | TCGA-BH-A0DS-01 | Breast | breast invasive carcinoma | Female | >=65 | III/IV | Chemotherapy | cyclophosphamide | SD | ||
| AIFM1 | SNV | Missense_Mutation | c.527N>T | p.Ser176Leu | p.S176L | O95831 | protein_coding | deleterious(0) | probably_damaging(1) | TCGA-Q1-A73O-01 | Cervix | cervical & endocervical cancer | Female | <65 | I/II | Chemotherapy | cisplatin | CR | |
| AIFM1 | SNV | Missense_Mutation | novel | c.890N>T | p.Ser297Leu | p.S297L | O95831 | protein_coding | tolerated(0.3) | possibly_damaging(0.752) | TCGA-UC-A7PG-06 | Cervix | cervical & endocervical cancer | Female | <65 | III/IV | Chemotherapy | cisplatin | PD |
| AIFM1 | SNV | Missense_Mutation | novel | c.301N>A | p.Gly101Arg | p.G101R | O95831 | protein_coding | tolerated(0.44) | benign(0.052) | TCGA-ZJ-A8QR-01 | Cervix | cervical & endocervical cancer | Female | <65 | I/II | Unknown | Unknown | SD |
| Page: 1 2 3 4 5 6 7 8 |
Top |
Related drugs of malignant transformation related genes |
| Identification of chemicals and drugs interact with genes involved in malignant transfromation |
| (DGIdb 4.0) |
| Entrez ID | Symbol | Category | Interaction Types | Drug Claim Name | Drug Name | PMIDs |
| 9131 | AIFM1 | DRUGGABLE GENOME | HSP70 | 12022952 | ||
| 9131 | AIFM1 | DRUGGABLE GENOME | CYCLOSPORIN A | 12787063 |
| Page: 1 |

Copyright 2023-Present -The University of Texas Health Science Center at Houston |