
|
|||||
|
 | |
| |
| |
| |
| |
| |
|
Gene: AIF1L |
Gene summary for AIF1L |
| Gene information | Species | Human | Gene symbol | AIF1L | Gene ID | 83543 |
| Gene name | allograft inflammatory factor 1 like | |
| Gene Alias | C9orf58 | |
| Cytomap | 9q34.12-q34.13 | |
| Gene Type | protein-coding | GO ID | GO:0006996 | UniProtAcc | Q9BQI0 |
Top |
Malignant transformation analysis |
| Identification of the aberrant gene expression in precancerous and cancerous lesions by comparing the gene expression of stem-like cells in diseased tissues with normal stem cells |
| Entrez ID | Symbol | Replicates | Species | Organ | Tissue | Adj P-value | Log2FC | Malignancy |
| 83543 | AIF1L | LZE7T | Human | Esophagus | ESCC | 1.23e-06 | 2.74e-01 | 0.0667 |
| 83543 | AIF1L | LZE20T | Human | Esophagus | ESCC | 2.57e-05 | 2.44e-01 | 0.0662 |
| 83543 | AIF1L | LZE24T | Human | Esophagus | ESCC | 8.34e-03 | 5.73e-02 | 0.0596 |
| 83543 | AIF1L | P2T-E | Human | Esophagus | ESCC | 1.70e-25 | 5.68e-01 | 0.1177 |
| 83543 | AIF1L | P4T-E | Human | Esophagus | ESCC | 6.58e-26 | 5.02e-01 | 0.1323 |
| 83543 | AIF1L | P5T-E | Human | Esophagus | ESCC | 1.03e-04 | 1.19e-01 | 0.1327 |
| 83543 | AIF1L | P8T-E | Human | Esophagus | ESCC | 4.11e-03 | 1.54e-01 | 0.0889 |
| 83543 | AIF1L | P9T-E | Human | Esophagus | ESCC | 5.31e-03 | 9.48e-02 | 0.1131 |
| 83543 | AIF1L | P10T-E | Human | Esophagus | ESCC | 3.31e-03 | 7.08e-02 | 0.116 |
| 83543 | AIF1L | P11T-E | Human | Esophagus | ESCC | 9.42e-05 | 1.81e-01 | 0.1426 |
| 83543 | AIF1L | P15T-E | Human | Esophagus | ESCC | 4.75e-08 | 1.87e-01 | 0.1149 |
| 83543 | AIF1L | P16T-E | Human | Esophagus | ESCC | 7.79e-18 | 4.26e-01 | 0.1153 |
| 83543 | AIF1L | P17T-E | Human | Esophagus | ESCC | 4.59e-04 | 1.47e-01 | 0.1278 |
| 83543 | AIF1L | P22T-E | Human | Esophagus | ESCC | 4.82e-03 | 1.09e-01 | 0.1236 |
| 83543 | AIF1L | P24T-E | Human | Esophagus | ESCC | 9.53e-07 | 1.71e-01 | 0.1287 |
| 83543 | AIF1L | P27T-E | Human | Esophagus | ESCC | 1.54e-03 | 1.11e-01 | 0.1055 |
| 83543 | AIF1L | P28T-E | Human | Esophagus | ESCC | 3.86e-07 | 1.63e-01 | 0.1149 |
| 83543 | AIF1L | P30T-E | Human | Esophagus | ESCC | 5.88e-05 | 2.15e-01 | 0.137 |
| 83543 | AIF1L | P31T-E | Human | Esophagus | ESCC | 1.51e-11 | 2.36e-01 | 0.1251 |
| 83543 | AIF1L | P37T-E | Human | Esophagus | ESCC | 1.27e-05 | 1.17e-01 | 0.1371 |
| Page: 1 2 3 |
| Tissue | Expression Dynamics | Abbreviation |
| Esophagus | 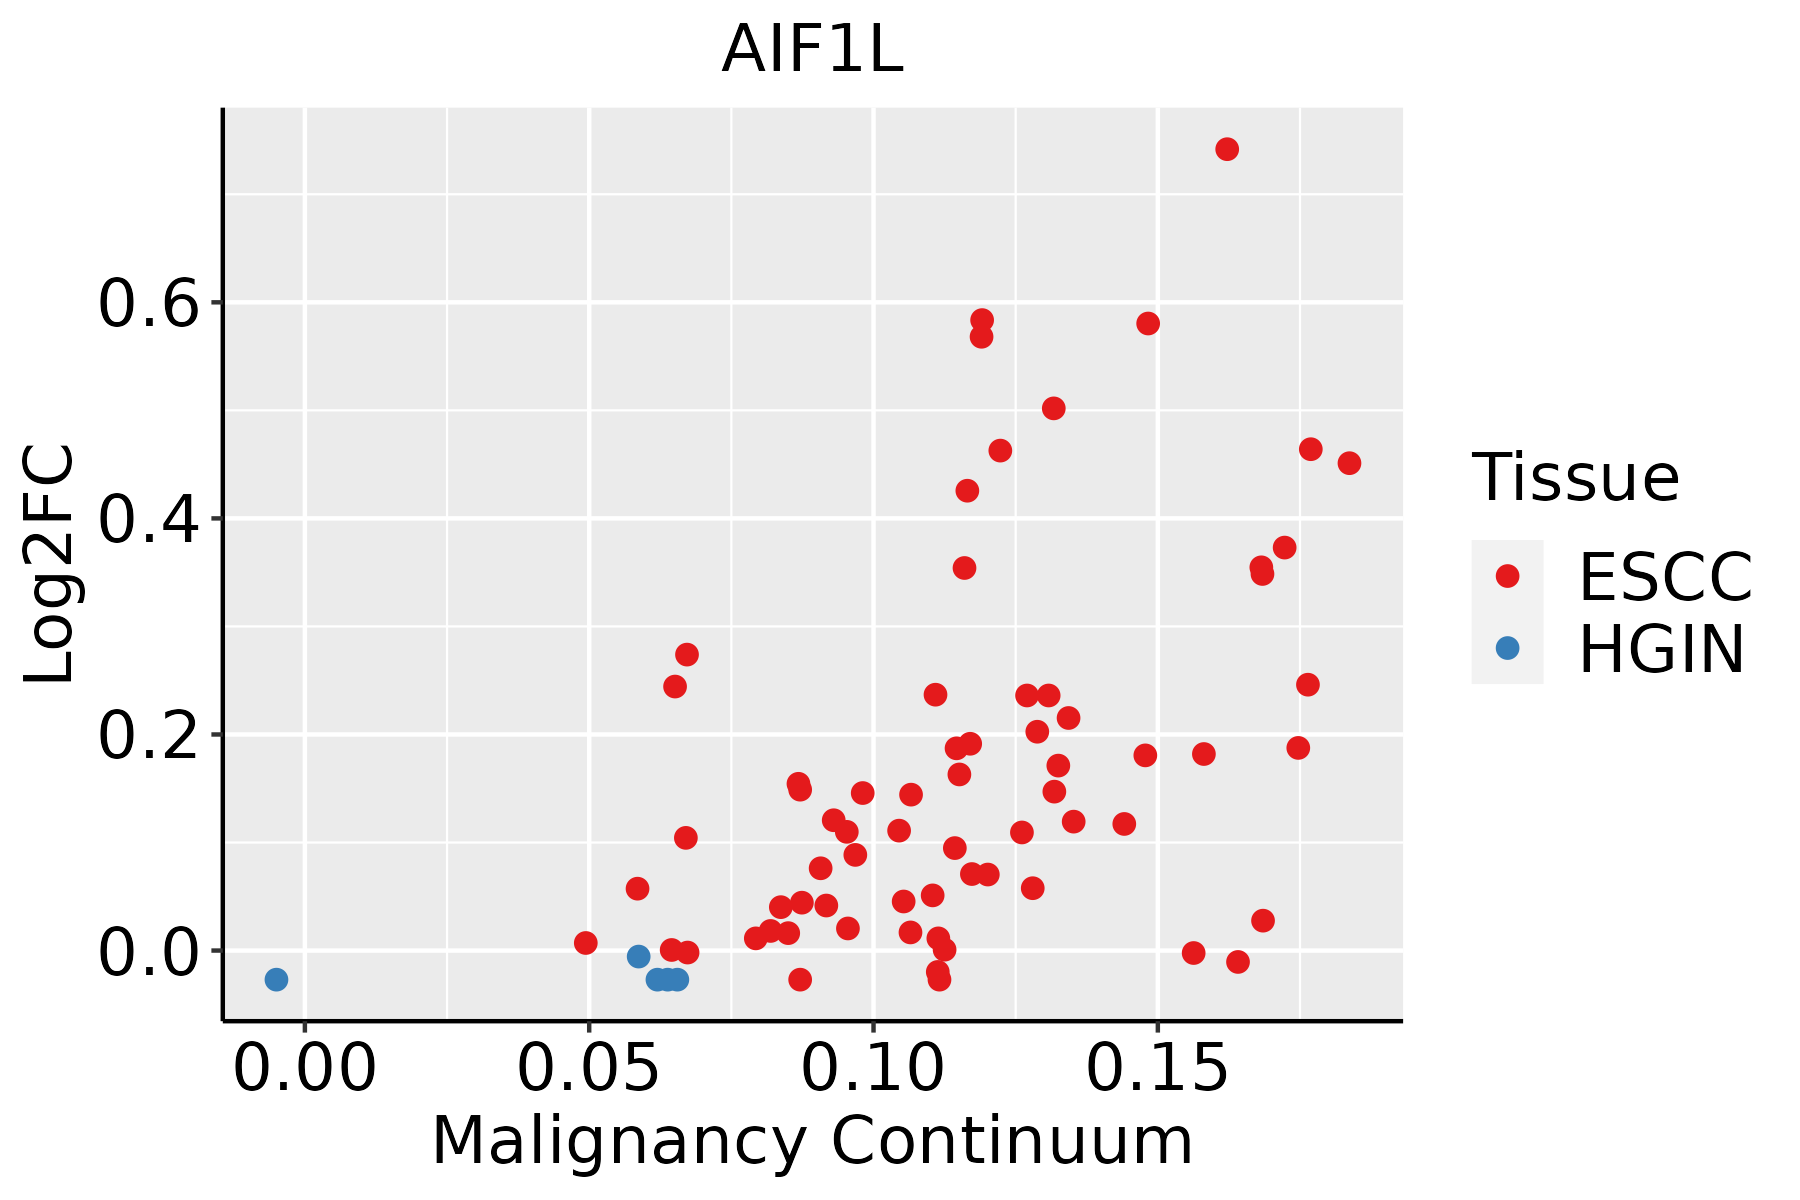 | ESCC: Esophageal squamous cell carcinoma |
| HGIN: High-grade intraepithelial neoplasias | ||
| LGIN: Low-grade intraepithelial neoplasias | ||
| Thyroid |  | ATC: Anaplastic thyroid cancer |
| HT: Hashimoto's thyroiditis | ||
| PTC: Papillary thyroid cancer |
| ∗log2FC in expression of this searched gene in stem-like cells from each diseased tissue sample relative to stem-like cells in normal samples in each tissue plotted against the malignancy continuum. Samples are colored based on if they are from different disease stage. |
Top |
Malignant transformation related pathway analysis |
| Find out the enriched GO biological processes and KEGG pathways involved in transition from healthy to precancer to cancer |
| Tissue | Disease Stage | Enriched GO biological Processes |
| Colorectum | AD |  |
| Colorectum | SER |  |
| Colorectum | MSS |  |
| Colorectum | MSI-H |  |
| Colorectum | FAP |  |
| ∗Top 15 enriched GO BP terms are showed in the bar plot of each disease state in each tissue. Each row represents a significant GO biological process which is colored according to the -log10(p.adjust). |
| Page: 1 2 3 4 5 6 7 8 9 |
| GO ID | Tissue | Disease Stage | Description | Gene Ratio | Bg Ratio | pvalue | p.adjust | Count |
| GO:000701527 | Esophagus | ESCC | actin filament organization | 259/8552 | 442/18723 | 2.37e-08 | 4.50e-07 | 259 |
| GO:005101727 | Esophagus | ESCC | actin filament bundle assembly | 100/8552 | 157/18723 | 3.87e-06 | 4.17e-05 | 100 |
| GO:006157227 | Esophagus | ESCC | actin filament bundle organization | 101/8552 | 161/18723 | 9.22e-06 | 8.82e-05 | 101 |
| GO:00315299 | Esophagus | ESCC | ruffle organization | 39/8552 | 56/18723 | 2.44e-04 | 1.51e-03 | 39 |
| GO:00971789 | Esophagus | ESCC | ruffle assembly | 32/8552 | 44/18723 | 2.50e-04 | 1.54e-03 | 32 |
| GO:000701530 | Thyroid | HT | actin filament organization | 50/1272 | 442/18723 | 2.71e-04 | 3.73e-03 | 50 |
| GO:005101730 | Thyroid | HT | actin filament bundle assembly | 23/1272 | 157/18723 | 3.91e-04 | 4.90e-03 | 23 |
| GO:006157230 | Thyroid | HT | actin filament bundle organization | 23/1272 | 161/18723 | 5.63e-04 | 6.62e-03 | 23 |
| GO:009717814 | Thyroid | HT | ruffle assembly | 10/1272 | 44/18723 | 5.97e-04 | 6.95e-03 | 10 |
| GO:003152916 | Thyroid | HT | ruffle organization | 11/1272 | 56/18723 | 1.19e-03 | 1.16e-02 | 11 |
| GO:0007015112 | Thyroid | PTC | actin filament organization | 225/5968 | 442/18723 | 3.76e-17 | 3.44e-15 | 225 |
| GO:0051017112 | Thyroid | PTC | actin filament bundle assembly | 83/5968 | 157/18723 | 3.73e-08 | 8.18e-07 | 83 |
| GO:0061572112 | Thyroid | PTC | actin filament bundle organization | 84/5968 | 161/18723 | 6.75e-08 | 1.40e-06 | 84 |
| GO:003152917 | Thyroid | PTC | ruffle organization | 35/5968 | 56/18723 | 2.34e-06 | 3.11e-05 | 35 |
| GO:009717815 | Thyroid | PTC | ruffle assembly | 28/5968 | 44/18723 | 1.46e-05 | 1.56e-04 | 28 |
| GO:0007015210 | Thyroid | ATC | actin filament organization | 227/6293 | 442/18723 | 5.96e-15 | 3.85e-13 | 227 |
| GO:0051017210 | Thyroid | ATC | actin filament bundle assembly | 85/6293 | 157/18723 | 8.99e-08 | 1.54e-06 | 85 |
| GO:0061572210 | Thyroid | ATC | actin filament bundle organization | 86/6293 | 161/18723 | 1.68e-07 | 2.69e-06 | 86 |
| GO:003152921 | Thyroid | ATC | ruffle organization | 34/6293 | 56/18723 | 2.92e-05 | 2.45e-04 | 34 |
| GO:009717821 | Thyroid | ATC | ruffle assembly | 27/6293 | 44/18723 | 1.49e-04 | 1.03e-03 | 27 |
| Page: 1 |
| Pathway ID | Tissue | Disease Stage | Description | Gene Ratio | Bg Ratio | pvalue | p.adjust | qvalue | Count |
| Page: 1 |
Top |
Cell-cell communication analysis |
| Identification of potential cell-cell interactions between two cell types and their ligand-receptor pairs for different disease states |
| Ligand | Receptor | LRpair | Pathway | Tissue | Disease Stage |
| Page: 1 |
Top |
Single-cell gene regulatory network inference analysis |
| Find out the significant the regulons (TFs) and the target genes of each regulon across cell types for different disease states |
| TF | Cell Type | Tissue | Disease Stage | Target Gene | RSS | Regulon Activity |
| ∗The dot plots of a searched regulon are shown for all cell subpopulations in each disease state of each tissue based on the regulon specific score inferred using pySCENIC and by calculating the average expression. |
| Page: 1 |
Top |
Somatic mutation of malignant transformation related genes |
| Annotation of somatic variants for genes involved in malignant transformation |
| Hugo Symbol | Variant Class | Variant Classification | dbSNP RS | HGVSc | HGVSp | HGVSp Short | SWISSPROT | BIOTYPE | SIFT | PolyPhen | Tumor Sample Barcode | Tissue | Histology | Sex | Age | Stage | Therapy Types | Drugs | Outcome |
| AIF1L | SNV | Missense_Mutation | c.362T>C | p.Val121Ala | p.V121A | Q9BQI0 | protein_coding | deleterious(0.03) | benign(0.065) | TCGA-WS-AB45-01 | Colorectum | colon adenocarcinoma | Female | <65 | I/II | Unknown | Unknown | SD | |
| AIF1L | SNV | Missense_Mutation | c.207N>T | p.Glu69Asp | p.E69D | Q9BQI0 | protein_coding | tolerated(0.1) | possibly_damaging(0.796) | TCGA-F5-6814-01 | Colorectum | rectum adenocarcinoma | Male | <65 | I/II | Unknown | Unknown | SD | |
| AIF1L | SNV | Missense_Mutation | novel | c.445N>T | p.Val149Phe | p.V149F | Q9BQI0 | protein_coding | deleterious(0) | probably_damaging(0.967) | TCGA-A5-A0G2-01 | Endometrium | uterine corpus endometrioid carcinoma | Female | <65 | III/IV | Unknown | Unknown | SD |
| AIF1L | SNV | Missense_Mutation | novel | c.288N>A | p.Met96Ile | p.M96I | Q9BQI0 | protein_coding | deleterious(0) | benign(0.075) | TCGA-A5-A1OF-01 | Endometrium | uterine corpus endometrioid carcinoma | Female | <65 | I/II | Unknown | Unknown | SD |
| AIF1L | SNV | Missense_Mutation | c.178N>A | p.Leu60Met | p.L60M | Q9BQI0 | protein_coding | deleterious(0.03) | possibly_damaging(0.558) | TCGA-AX-A2HC-01 | Endometrium | uterine corpus endometrioid carcinoma | Female | <65 | III/IV | Chemotherapy | paclitaxel | PD | |
| AIF1L | SNV | Missense_Mutation | c.207N>T | p.Glu69Asp | p.E69D | Q9BQI0 | protein_coding | tolerated(0.1) | possibly_damaging(0.796) | TCGA-BS-A0UF-01 | Endometrium | uterine corpus endometrioid carcinoma | Female | >=65 | I/II | Unknown | Unknown | SD | |
| AIF1L | SNV | Missense_Mutation | novel | c.240N>T | p.Glu80Asp | p.E80D | Q9BQI0 | protein_coding | tolerated(0.09) | benign(0.414) | TCGA-E6-A1LX-01 | Endometrium | uterine corpus endometrioid carcinoma | Female | <65 | I/II | Unknown | Unknown | SD |
| AIF1L | SNV | Missense_Mutation | novel | c.223C>T | p.Leu75Phe | p.L75F | Q9BQI0 | protein_coding | deleterious(0) | probably_damaging(0.999) | TCGA-EO-A22X-01 | Endometrium | uterine corpus endometrioid carcinoma | Female | <65 | III/IV | Unspecific | Carboplatin | Complete Response |
| AIF1L | SNV | Missense_Mutation | novel | c.410N>C | p.Met137Thr | p.M137T | Q9BQI0 | protein_coding | deleterious(0) | benign(0.213) | TCGA-EY-A1GK-01 | Endometrium | uterine corpus endometrioid carcinoma | Female | >=65 | I/II | Unknown | Unknown | SD |
| AIF1L | insertion | In_Frame_Ins | novel | c.424_425insAGCTCGATTCCAATGCAAGCCCGTCTGACTCTAGAA | p.Lys141_Arg142insGlnLeuAspSerAsnAlaSerProSerAspSerArg | p.K141_R142insQLDSNASPSDSR | Q9BQI0 | protein_coding | TCGA-BG-A0LX-01 | Endometrium | uterine corpus endometrioid carcinoma | Female | <65 | I/II | Unknown | Unknown | SD |
| Page: 1 2 |
Top |
Related drugs of malignant transformation related genes |
| Identification of chemicals and drugs interact with genes involved in malignant transfromation |
| (DGIdb 4.0) |
| Entrez ID | Symbol | Category | Interaction Types | Drug Claim Name | Drug Name | PMIDs |
| Page: 1 |

Copyright 2023-Present -The University of Texas Health Science Center at Houston |