
|
|||||
|
 | |
| |
| |
| |
| |
| |
|
Gene: AIDA |
Gene summary for AIDA |
| Gene information | Species | Human | Gene symbol | AIDA | Gene ID | 64853 |
| Gene name | axin interactor, dorsalization associated | |
| Gene Alias | C1orf80 | |
| Cytomap | 1q41 | |
| Gene Type | protein-coding | GO ID | GO:0000165 | UniProtAcc | Q96BJ3 |
Top |
Malignant transformation analysis |
| Identification of the aberrant gene expression in precancerous and cancerous lesions by comparing the gene expression of stem-like cells in diseased tissues with normal stem cells |
| Entrez ID | Symbol | Replicates | Species | Organ | Tissue | Adj P-value | Log2FC | Malignancy |
| 64853 | AIDA | LZE4T | Human | Esophagus | ESCC | 2.04e-11 | 3.11e-01 | 0.0811 |
| 64853 | AIDA | LZE7T | Human | Esophagus | ESCC | 1.35e-08 | 4.63e-01 | 0.0667 |
| 64853 | AIDA | LZE8T | Human | Esophagus | ESCC | 8.64e-09 | 2.01e-01 | 0.067 |
| 64853 | AIDA | LZE22T | Human | Esophagus | ESCC | 1.66e-02 | 2.93e-01 | 0.068 |
| 64853 | AIDA | LZE24T | Human | Esophagus | ESCC | 8.65e-11 | 3.84e-01 | 0.0596 |
| 64853 | AIDA | LZE6T | Human | Esophagus | ESCC | 1.90e-04 | 2.38e-01 | 0.0845 |
| 64853 | AIDA | P1T-E | Human | Esophagus | ESCC | 7.80e-07 | 3.39e-01 | 0.0875 |
| 64853 | AIDA | P2T-E | Human | Esophagus | ESCC | 7.31e-21 | 3.40e-01 | 0.1177 |
| 64853 | AIDA | P4T-E | Human | Esophagus | ESCC | 1.29e-16 | 3.50e-01 | 0.1323 |
| 64853 | AIDA | P5T-E | Human | Esophagus | ESCC | 1.19e-10 | 2.39e-01 | 0.1327 |
| 64853 | AIDA | P8T-E | Human | Esophagus | ESCC | 3.86e-11 | 3.00e-01 | 0.0889 |
| 64853 | AIDA | P9T-E | Human | Esophagus | ESCC | 9.77e-12 | 2.41e-01 | 0.1131 |
| 64853 | AIDA | P10T-E | Human | Esophagus | ESCC | 3.22e-24 | 5.32e-01 | 0.116 |
| 64853 | AIDA | P11T-E | Human | Esophagus | ESCC | 6.66e-12 | 5.54e-01 | 0.1426 |
| 64853 | AIDA | P12T-E | Human | Esophagus | ESCC | 3.83e-12 | 2.60e-01 | 0.1122 |
| 64853 | AIDA | P15T-E | Human | Esophagus | ESCC | 1.25e-12 | 3.82e-01 | 0.1149 |
| 64853 | AIDA | P16T-E | Human | Esophagus | ESCC | 1.93e-09 | 2.76e-01 | 0.1153 |
| 64853 | AIDA | P17T-E | Human | Esophagus | ESCC | 3.20e-09 | 3.86e-01 | 0.1278 |
| 64853 | AIDA | P19T-E | Human | Esophagus | ESCC | 5.38e-07 | 7.92e-01 | 0.1662 |
| 64853 | AIDA | P20T-E | Human | Esophagus | ESCC | 7.84e-15 | 4.15e-01 | 0.1124 |
| Page: 1 2 3 4 5 6 |
| Tissue | Expression Dynamics | Abbreviation |
| Esophagus | 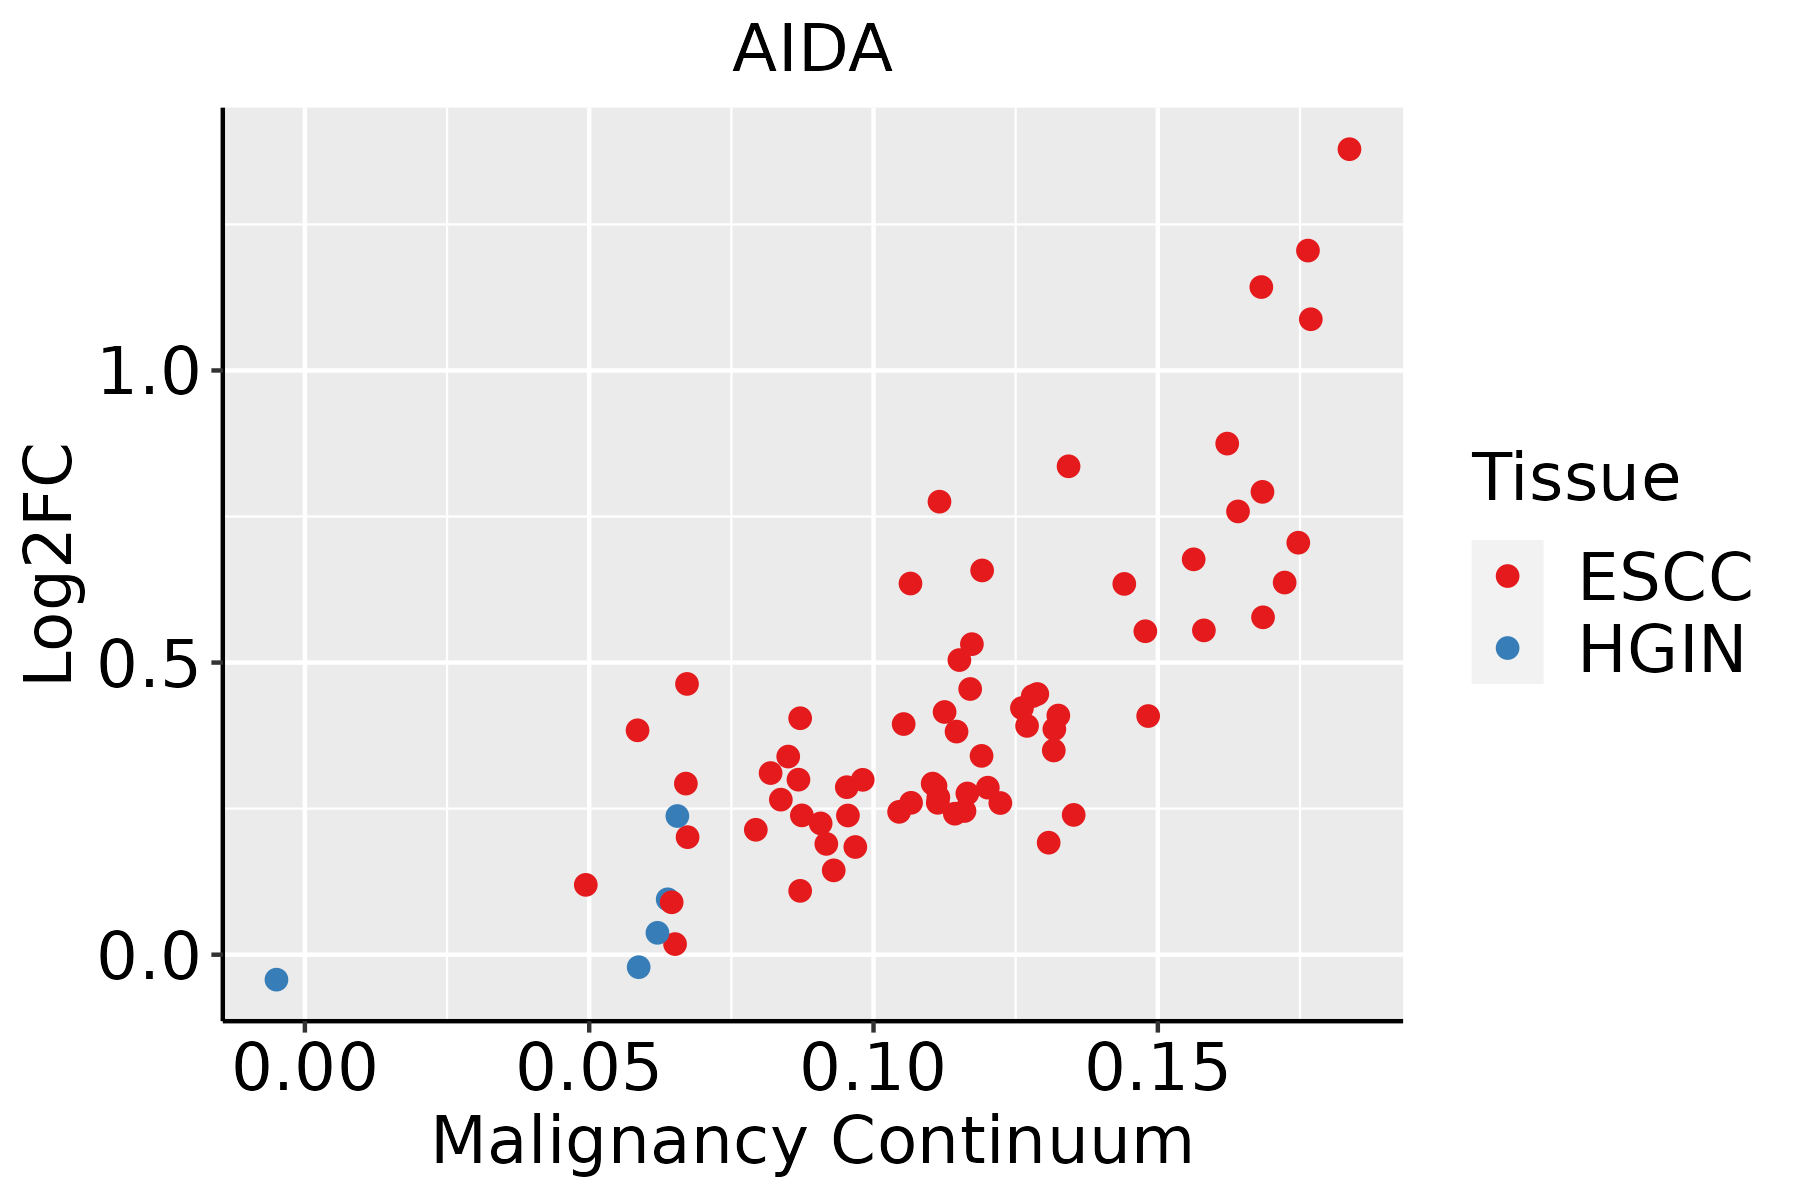 | ESCC: Esophageal squamous cell carcinoma |
| HGIN: High-grade intraepithelial neoplasias | ||
| LGIN: Low-grade intraepithelial neoplasias | ||
| Liver |  | HCC: Hepatocellular carcinoma |
| NAFLD: Non-alcoholic fatty liver disease | ||
| Oral Cavity |  | EOLP: Erosive Oral lichen planus |
| LP: leukoplakia | ||
| NEOLP: Non-erosive oral lichen planus | ||
| OSCC: Oral squamous cell carcinoma | ||
| Skin | 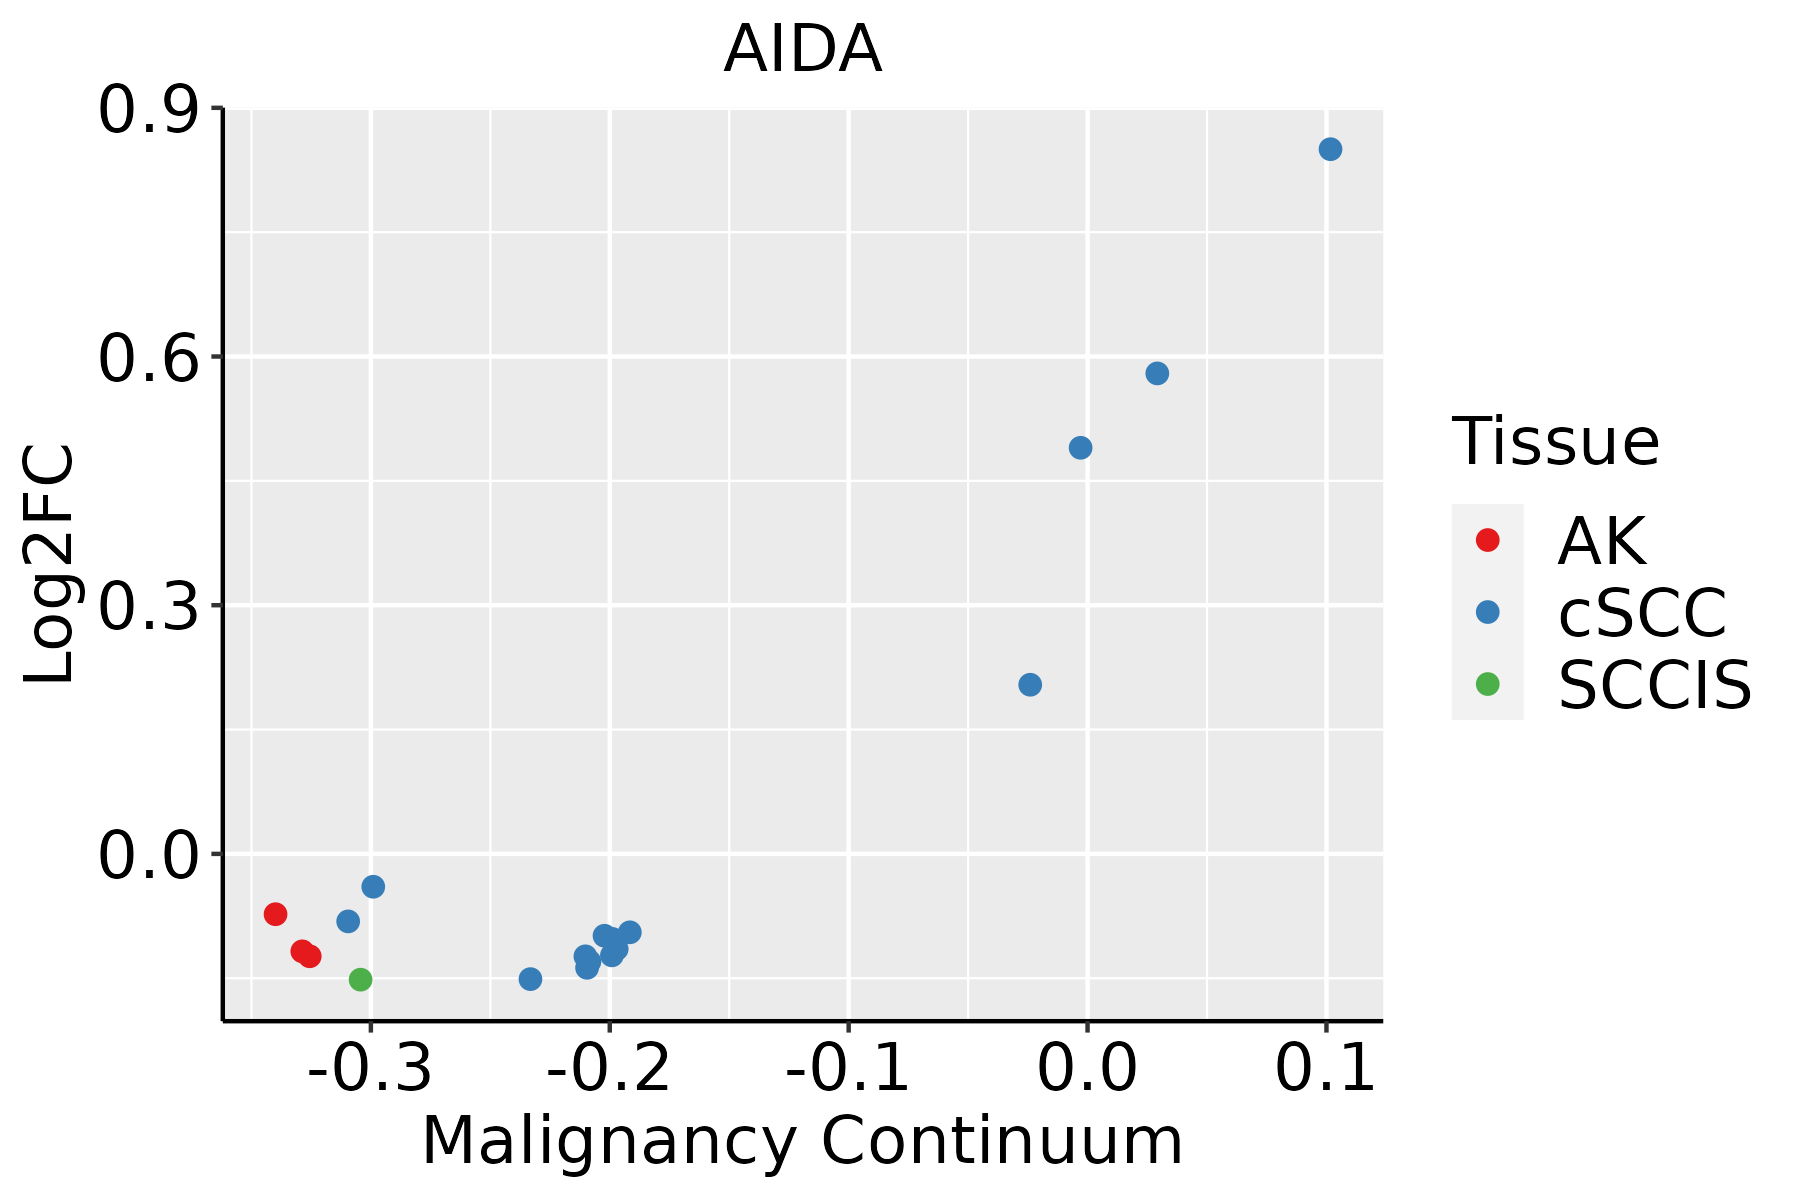 | AK: Actinic keratosis |
| cSCC: Cutaneous squamous cell carcinoma | ||
| SCCIS:squamous cell carcinoma in situ | ||
| Thyroid |  | ATC: Anaplastic thyroid cancer |
| HT: Hashimoto's thyroiditis | ||
| PTC: Papillary thyroid cancer |
| ∗log2FC in expression of this searched gene in stem-like cells from each diseased tissue sample relative to stem-like cells in normal samples in each tissue plotted against the malignancy continuum. Samples are colored based on if they are from different disease stage. |
Top |
Malignant transformation related pathway analysis |
| Find out the enriched GO biological processes and KEGG pathways involved in transition from healthy to precancer to cancer |
| Tissue | Disease Stage | Enriched GO biological Processes |
| Colorectum | AD |  |
| Colorectum | SER |  |
| Colorectum | MSS |  |
| Colorectum | MSI-H |  |
| Colorectum | FAP |  |
| ∗Top 15 enriched GO BP terms are showed in the bar plot of each disease state in each tissue. Each row represents a significant GO biological process which is colored according to the -log10(p.adjust). |
| Page: 1 2 3 4 5 6 7 8 9 |
| GO ID | Tissue | Disease Stage | Description | Gene Ratio | Bg Ratio | pvalue | p.adjust | Count |
| GO:0043254111 | Esophagus | ESCC | regulation of protein-containing complex assembly | 278/8552 | 428/18723 | 3.81e-16 | 2.77e-14 | 278 |
| GO:0010563111 | Esophagus | ESCC | negative regulation of phosphorus metabolic process | 274/8552 | 442/18723 | 2.32e-12 | 9.41e-11 | 274 |
| GO:0045936111 | Esophagus | ESCC | negative regulation of phosphate metabolic process | 273/8552 | 441/18723 | 3.18e-12 | 1.25e-10 | 273 |
| GO:0051348111 | Esophagus | ESCC | negative regulation of transferase activity | 177/8552 | 268/18723 | 1.08e-11 | 4.00e-10 | 177 |
| GO:007190016 | Esophagus | ESCC | regulation of protein serine/threonine kinase activity | 227/8552 | 359/18723 | 1.12e-11 | 4.10e-10 | 227 |
| GO:0042326111 | Esophagus | ESCC | negative regulation of phosphorylation | 237/8552 | 385/18723 | 1.86e-10 | 5.33e-09 | 237 |
| GO:0001933111 | Esophagus | ESCC | negative regulation of protein phosphorylation | 213/8552 | 342/18723 | 3.54e-10 | 9.76e-09 | 213 |
| GO:003367319 | Esophagus | ESCC | negative regulation of kinase activity | 154/8552 | 237/18723 | 1.38e-09 | 3.27e-08 | 154 |
| GO:000646920 | Esophagus | ESCC | negative regulation of protein kinase activity | 140/8552 | 212/18723 | 1.53e-09 | 3.56e-08 | 140 |
| GO:003109818 | Esophagus | ESCC | stress-activated protein kinase signaling cascade | 154/8552 | 247/18723 | 8.53e-08 | 1.44e-06 | 154 |
| GO:005140318 | Esophagus | ESCC | stress-activated MAPK cascade | 147/8552 | 239/18723 | 5.43e-07 | 7.18e-06 | 147 |
| GO:007030217 | Esophagus | ESCC | regulation of stress-activated protein kinase signaling cascade | 119/8552 | 195/18723 | 1.07e-05 | 1.01e-04 | 119 |
| GO:003287217 | Esophagus | ESCC | regulation of stress-activated MAPK cascade | 116/8552 | 192/18723 | 2.63e-05 | 2.21e-04 | 116 |
| GO:00072549 | Esophagus | ESCC | JNK cascade | 102/8552 | 167/18723 | 4.22e-05 | 3.39e-04 | 102 |
| GO:00719014 | Esophagus | ESCC | negative regulation of protein serine/threonine kinase activity | 75/8552 | 120/18723 | 1.48e-04 | 9.88e-04 | 75 |
| GO:0031333110 | Esophagus | ESCC | negative regulation of protein-containing complex assembly | 86/8552 | 141/18723 | 1.74e-04 | 1.14e-03 | 86 |
| GO:0043409110 | Esophagus | ESCC | negative regulation of MAPK cascade | 105/8552 | 180/18723 | 4.13e-04 | 2.35e-03 | 105 |
| GO:00463289 | Esophagus | ESCC | regulation of JNK cascade | 80/8552 | 133/18723 | 5.35e-04 | 2.95e-03 | 80 |
| GO:003287317 | Esophagus | ESCC | negative regulation of stress-activated MAPK cascade | 35/8552 | 51/18723 | 7.77e-04 | 4.02e-03 | 35 |
| GO:007030317 | Esophagus | ESCC | negative regulation of stress-activated protein kinase signaling cascade | 35/8552 | 51/18723 | 7.77e-04 | 4.02e-03 | 35 |
| Page: 1 2 3 4 5 6 7 8 |
| Pathway ID | Tissue | Disease Stage | Description | Gene Ratio | Bg Ratio | pvalue | p.adjust | qvalue | Count |
| Page: 1 |
Top |
Cell-cell communication analysis |
| Identification of potential cell-cell interactions between two cell types and their ligand-receptor pairs for different disease states |
| Ligand | Receptor | LRpair | Pathway | Tissue | Disease Stage |
| Page: 1 |
Top |
Single-cell gene regulatory network inference analysis |
| Find out the significant the regulons (TFs) and the target genes of each regulon across cell types for different disease states |
| TF | Cell Type | Tissue | Disease Stage | Target Gene | RSS | Regulon Activity |
| ∗The dot plots of a searched regulon are shown for all cell subpopulations in each disease state of each tissue based on the regulon specific score inferred using pySCENIC and by calculating the average expression. |
| Page: 1 |
Top |
Somatic mutation of malignant transformation related genes |
| Annotation of somatic variants for genes involved in malignant transformation |
| Hugo Symbol | Variant Class | Variant Classification | dbSNP RS | HGVSc | HGVSp | HGVSp Short | SWISSPROT | BIOTYPE | SIFT | PolyPhen | Tumor Sample Barcode | Tissue | Histology | Sex | Age | Stage | Therapy Types | Drugs | Outcome |
| AIDA | SNV | Missense_Mutation | c.729N>G | p.Phe243Leu | p.F243L | Q96BJ3 | protein_coding | tolerated(0.23) | probably_damaging(0.967) | TCGA-BH-A0DG-01 | Breast | breast invasive carcinoma | Female | <65 | I/II | Chemotherapy | taxotere | CR | |
| AIDA | insertion | Frame_Shift_Ins | novel | c.751_752insCTCTTGCTACT | p.Arg251ThrfsTer26 | p.R251Tfs*26 | Q96BJ3 | protein_coding | TCGA-A8-A08H-01 | Breast | breast invasive carcinoma | Female | >=65 | I/II | Unknown | Unknown | SD | ||
| AIDA | SNV | Missense_Mutation | c.697T>A | p.Leu233Ile | p.L233I | Q96BJ3 | protein_coding | tolerated(0.07) | benign(0.15) | TCGA-EA-A3HU-01 | Cervix | cervical & endocervical cancer | Female | <65 | I/II | Unknown | Unknown | SD | |
| AIDA | SNV | Missense_Mutation | c.532T>G | p.Leu178Val | p.L178V | Q96BJ3 | protein_coding | deleterious(0) | probably_damaging(0.953) | TCGA-AA-3510-01 | Colorectum | colon adenocarcinoma | Male | >=65 | I/II | Unknown | Unknown | SD | |
| AIDA | SNV | Missense_Mutation | c.425C>T | p.Ala142Val | p.A142V | Q96BJ3 | protein_coding | tolerated(0.14) | benign(0) | TCGA-AA-A02R-01 | Colorectum | colon adenocarcinoma | Female | >=65 | I/II | Unknown | Unknown | PD | |
| AIDA | SNV | Missense_Mutation | c.431C>A | p.Ser144Tyr | p.S144Y | Q96BJ3 | protein_coding | deleterious(0.01) | possibly_damaging(0.737) | TCGA-AZ-4315-01 | Colorectum | colon adenocarcinoma | Male | <65 | I/II | Unknown | Unknown | SD | |
| AIDA | SNV | Missense_Mutation | novel | c.899N>G | p.His300Arg | p.H300R | Q96BJ3 | protein_coding | tolerated(0.21) | benign(0.054) | TCGA-CA-6717-01 | Colorectum | colon adenocarcinoma | Male | <65 | I/II | Chemotherapy | oxaliplatin | CR |
| AIDA | SNV | Missense_Mutation | c.637N>C | p.Lys213Gln | p.K213Q | Q96BJ3 | protein_coding | deleterious(0.02) | probably_damaging(0.917) | TCGA-CA-6718-01 | Colorectum | colon adenocarcinoma | Male | <65 | I/II | Unknown | Unknown | PD | |
| AIDA | SNV | Missense_Mutation | c.851G>T | p.Arg284Ile | p.R284I | Q96BJ3 | protein_coding | deleterious(0) | probably_damaging(0.983) | TCGA-AP-A056-01 | Endometrium | uterine corpus endometrioid carcinoma | Female | <65 | I/II | Unknown | Unknown | SD | |
| AIDA | SNV | Missense_Mutation | novel | c.677N>C | p.Leu226Pro | p.L226P | Q96BJ3 | protein_coding | deleterious(0) | possibly_damaging(0.745) | TCGA-AP-A1DK-01 | Endometrium | uterine corpus endometrioid carcinoma | Female | <65 | I/II | Unknown | Unknown | SD |
| Page: 1 2 3 |
Top |
Related drugs of malignant transformation related genes |
| Identification of chemicals and drugs interact with genes involved in malignant transfromation |
| (DGIdb 4.0) |
| Entrez ID | Symbol | Category | Interaction Types | Drug Claim Name | Drug Name | PMIDs |
| Page: 1 |

Copyright 2023-Present -The University of Texas Health Science Center at Houston |