
|
|||||
|
 | |
| |
| |
| |
| |
| |
|
Gene: AHSA2 |
Gene summary for AHSA2 |
| Gene information | Species | Human | Gene symbol | AHSA2 | Gene ID | 130872 |
| Gene name | activator of HSP90 ATPase homolog 2, pseudogene | |
| Gene Alias | AHA1 | |
| Cytomap | 2p15 | |
| Gene Type | pseudo | GO ID | GO:0006457 | UniProtAcc | NA |
Top |
Malignant transformation analysis |
| Identification of the aberrant gene expression in precancerous and cancerous lesions by comparing the gene expression of stem-like cells in diseased tissues with normal stem cells |
| Entrez ID | Symbol | Replicates | Species | Organ | Tissue | Adj P-value | Log2FC | Malignancy |
| 130872 | AHSA2 | HCC1_Meng | Human | Liver | HCC | 6.42e-31 | 7.92e-02 | 0.0246 |
| 130872 | AHSA2 | HCC2_Meng | Human | Liver | HCC | 5.28e-31 | 2.39e-01 | 0.0107 |
| 130872 | AHSA2 | HCC1 | Human | Liver | HCC | 2.82e-11 | 4.47e+00 | 0.5336 |
| 130872 | AHSA2 | HCC2 | Human | Liver | HCC | 1.62e-06 | 2.63e+00 | 0.5341 |
| 130872 | AHSA2 | C04 | Human | Oral cavity | OSCC | 1.66e-05 | 4.44e-01 | 0.2633 |
| 130872 | AHSA2 | C21 | Human | Oral cavity | OSCC | 4.65e-16 | 5.76e-01 | 0.2678 |
| 130872 | AHSA2 | C30 | Human | Oral cavity | OSCC | 9.96e-11 | 5.78e-01 | 0.3055 |
| 130872 | AHSA2 | C43 | Human | Oral cavity | OSCC | 1.75e-02 | 1.25e-01 | 0.1704 |
| 130872 | AHSA2 | C46 | Human | Oral cavity | OSCC | 1.97e-05 | 2.31e-01 | 0.1673 |
| 130872 | AHSA2 | C51 | Human | Oral cavity | OSCC | 9.23e-08 | 5.25e-01 | 0.2674 |
| 130872 | AHSA2 | C57 | Human | Oral cavity | OSCC | 1.73e-02 | 1.87e-01 | 0.1679 |
| 130872 | AHSA2 | C06 | Human | Oral cavity | OSCC | 1.45e-02 | 4.81e-01 | 0.2699 |
| 130872 | AHSA2 | C08 | Human | Oral cavity | OSCC | 2.88e-35 | 6.99e-01 | 0.1919 |
| 130872 | AHSA2 | C09 | Human | Oral cavity | OSCC | 9.50e-11 | 4.39e-01 | 0.1431 |
| 130872 | AHSA2 | SYSMH1 | Human | Oral cavity | OSCC | 7.79e-07 | 2.85e-01 | 0.1127 |
| 130872 | AHSA2 | SYSMH2 | Human | Oral cavity | OSCC | 3.56e-17 | 4.83e-01 | 0.2326 |
| 130872 | AHSA2 | SYSMH3 | Human | Oral cavity | OSCC | 1.37e-08 | 2.73e-01 | 0.2442 |
| 130872 | AHSA2 | SYSMH4 | Human | Oral cavity | OSCC | 4.55e-03 | 1.09e-01 | 0.1226 |
| 130872 | AHSA2 | SYSMH5 | Human | Oral cavity | OSCC | 3.41e-03 | 1.76e-01 | 0.0647 |
| 130872 | AHSA2 | SYSMH6 | Human | Oral cavity | OSCC | 5.47e-05 | 1.77e-01 | 0.1275 |
| Page: 1 2 |
| Tissue | Expression Dynamics | Abbreviation |
| Liver |  | HCC: Hepatocellular carcinoma |
| NAFLD: Non-alcoholic fatty liver disease | ||
| Oral Cavity |  | EOLP: Erosive Oral lichen planus |
| LP: leukoplakia | ||
| NEOLP: Non-erosive oral lichen planus | ||
| OSCC: Oral squamous cell carcinoma | ||
| Prostate | 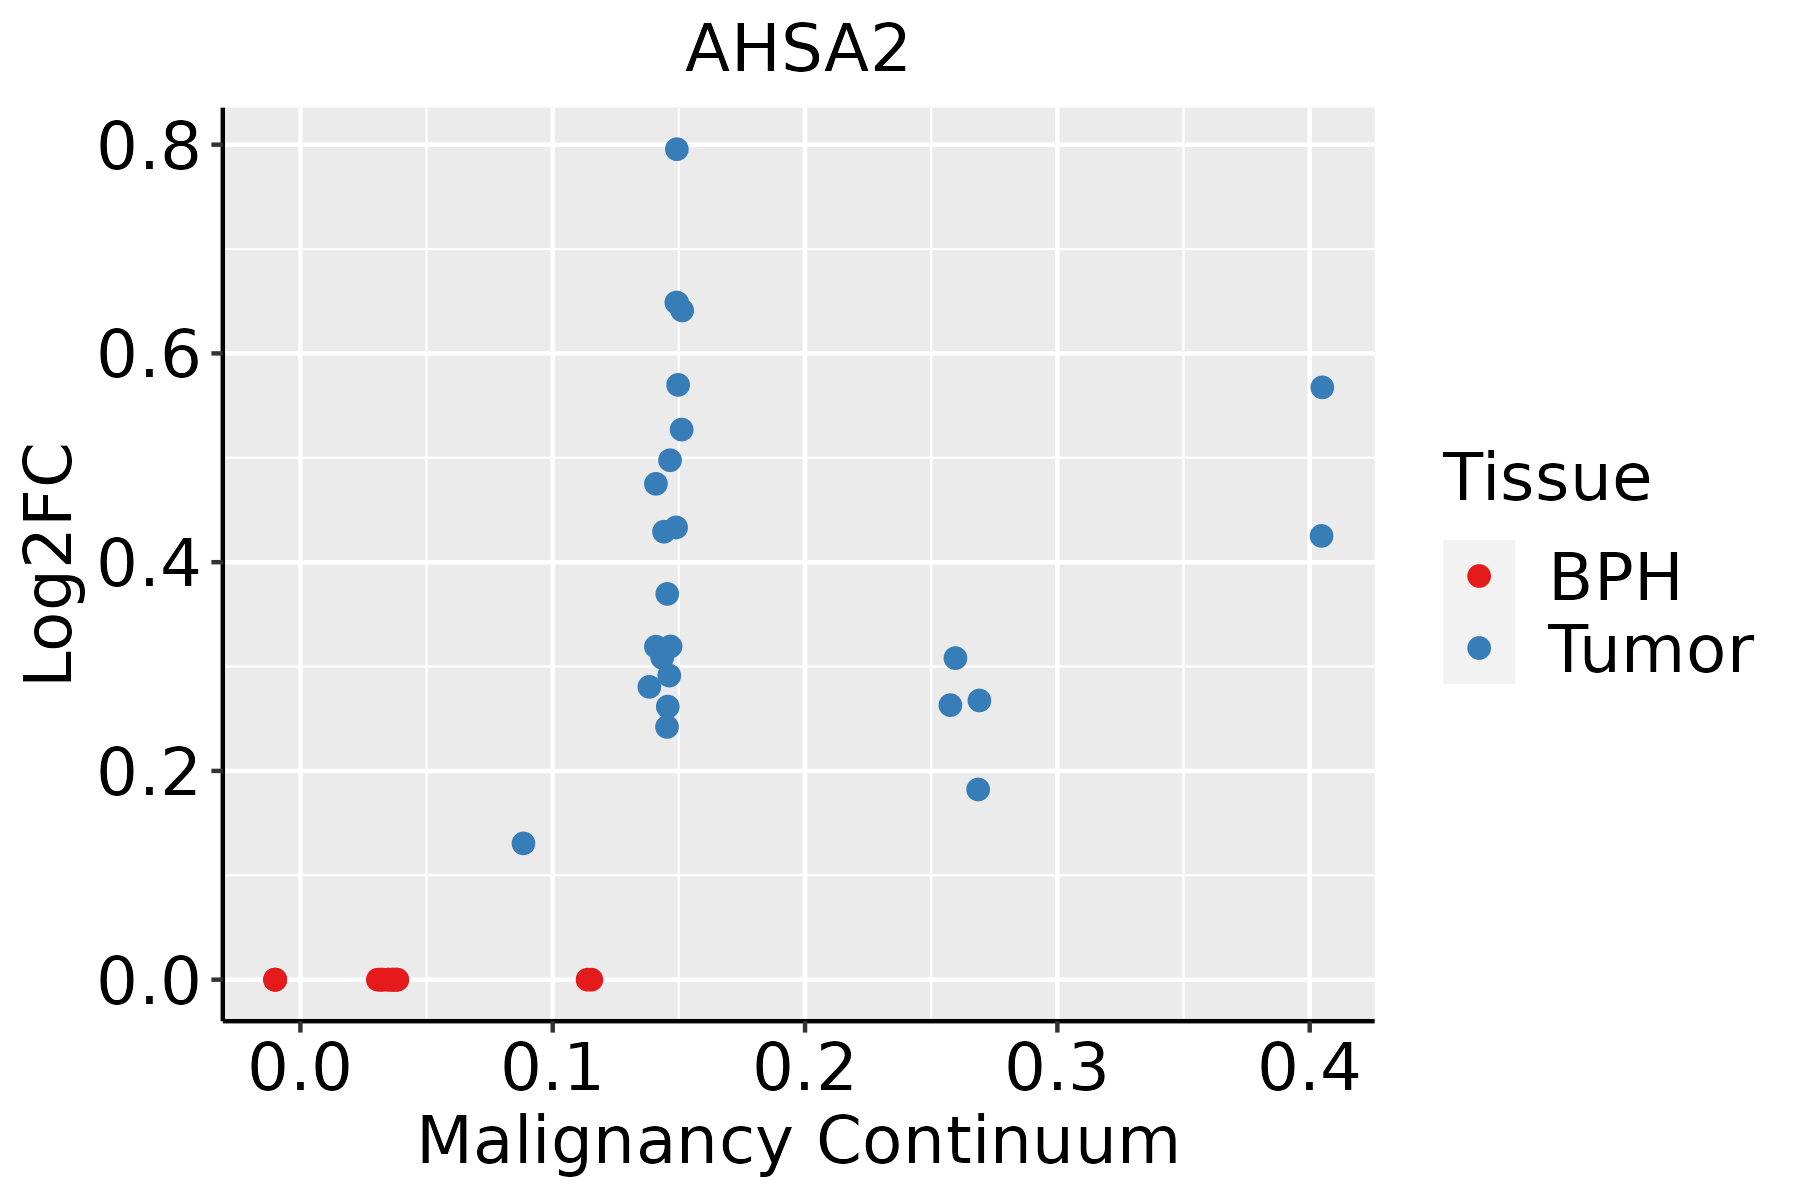 | BPH: Benign Prostatic Hyperplasia |
| ∗log2FC in expression of this searched gene in stem-like cells from each diseased tissue sample relative to stem-like cells in normal samples in each tissue plotted against the malignancy continuum. Samples are colored based on if they are from different disease stage. |
Top |
Malignant transformation related pathway analysis |
| Find out the enriched GO biological processes and KEGG pathways involved in transition from healthy to precancer to cancer |
| Tissue | Disease Stage | Enriched GO biological Processes |
| Colorectum | AD |  |
| Colorectum | SER |  |
| Colorectum | MSS |  |
| Colorectum | MSI-H |  |
| Colorectum | FAP |  |
| ∗Top 15 enriched GO BP terms are showed in the bar plot of each disease state in each tissue. Each row represents a significant GO biological process which is colored according to the -log10(p.adjust). |
| Page: 1 2 3 4 5 6 7 8 9 |
| GO ID | Tissue | Disease Stage | Description | Gene Ratio | Bg Ratio | pvalue | p.adjust | Count |
| Page: 1 |
| Pathway ID | Tissue | Disease Stage | Description | Gene Ratio | Bg Ratio | pvalue | p.adjust | qvalue | Count |
| Page: 1 |
Top |
Cell-cell communication analysis |
| Identification of potential cell-cell interactions between two cell types and their ligand-receptor pairs for different disease states |
| Ligand | Receptor | LRpair | Pathway | Tissue | Disease Stage |
| Page: 1 |
Top |
Single-cell gene regulatory network inference analysis |
| Find out the significant the regulons (TFs) and the target genes of each regulon across cell types for different disease states |
| TF | Cell Type | Tissue | Disease Stage | Target Gene | RSS | Regulon Activity |
| ∗The dot plots of a searched regulon are shown for all cell subpopulations in each disease state of each tissue based on the regulon specific score inferred using pySCENIC and by calculating the average expression. |
| Page: 1 |
Top |
Somatic mutation of malignant transformation related genes |
| Annotation of somatic variants for genes involved in malignant transformation |
| Hugo Symbol | Variant Class | Variant Classification | dbSNP RS | HGVSc | HGVSp | HGVSp Short | SWISSPROT | BIOTYPE | SIFT | PolyPhen | Tumor Sample Barcode | Tissue | Histology | Sex | Age | Stage | Therapy Types | Drugs | Outcome |
| AHSA2 | SNV | Missense_Mutation | novel | c.216N>A | p.Met72Ile | p.M72I | Q719I0 | protein_coding | deleterious(0.01) | benign(0.084) | TCGA-A5-A0G1-01 | Endometrium | uterine corpus endometrioid carcinoma | Female | >=65 | I/II | Unknown | Unknown | SD |
| AHSA2 | SNV | Missense_Mutation | novel | c.262G>A | p.Ala88Thr | p.A88T | Q719I0 | protein_coding | tolerated(0.43) | benign(0.186) | TCGA-AP-A1DR-01 | Endometrium | uterine corpus endometrioid carcinoma | Female | <65 | III/IV | Chemotherapy | cisplatin | SD |
| AHSA2 | SNV | Missense_Mutation | novel | c.323N>G | p.Ile108Ser | p.I108S | Q719I0 | protein_coding | tolerated(0.08) | benign(0.036) | TCGA-DF-A2KV-01 | Endometrium | uterine corpus endometrioid carcinoma | Female | <65 | I/II | Unknown | Unknown | SD |
| AHSA2 | SNV | Missense_Mutation | novel | c.203N>C | p.Lys68Thr | p.K68T | Q719I0 | protein_coding | deleterious(0.03) | benign(0.003) | TCGA-EY-A1GD-01 | Endometrium | uterine corpus endometrioid carcinoma | Female | <65 | I/II | Unknown | Unknown | SD |
| AHSA2 | insertion | Frame_Shift_Ins | rs754617838 | c.403dupC | p.Leu135ProfsTer6 | p.L135Pfs*6 | Q719I0 | protein_coding | TCGA-B5-A11G-01 | Endometrium | uterine corpus endometrioid carcinoma | Female | >=65 | I/II | Unknown | Unknown | SD | ||
| AHSA2 | SNV | Missense_Mutation | c.284T>A | p.Leu95Gln | p.L95Q | Q719I0 | protein_coding | tolerated(0.54) | benign(0.202) | TCGA-CC-A7IJ-01 | Liver | liver hepatocellular carcinoma | Male | <65 | I/II | Unknown | Unknown | SD | |
| AHSA2 | SNV | Missense_Mutation | c.175A>G | p.Ile59Val | p.I59V | Q719I0 | protein_coding | tolerated(0.55) | benign(0.017) | TCGA-86-8585-01 | Lung | lung adenocarcinoma | Male | <65 | I/II | Unknown | Unknown | SD | |
| AHSA2 | SNV | Missense_Mutation | c.222N>T | p.Trp74Cys | p.W74C | Q719I0 | protein_coding | deleterious(0) | probably_damaging(0.998) | TCGA-18-3411-01 | Lung | lung squamous cell carcinoma | Female | <65 | III/IV | Unknown | Unknown | SD | |
| AHSA2 | SNV | Missense_Mutation | c.81G>C | p.Gln27His | p.Q27H | Q719I0 | protein_coding | tolerated(0.11) | benign(0.188) | TCGA-21-5786-01 | Lung | lung squamous cell carcinoma | Male | <65 | I/II | Unknown | Unknown | PD | |
| AHSA2 | insertion | Frame_Shift_Ins | rs754617838 | c.397_398insC | p.Leu135ProfsTer6 | p.L135Pfs*6 | Q719I0 | protein_coding | TCGA-BR-6566-01 | Stomach | stomach adenocarcinoma | Female | <65 | I/II | Unknown | Unknown | SD |
| Page: 1 |
Top |
Related drugs of malignant transformation related genes |
| Identification of chemicals and drugs interact with genes involved in malignant transfromation |
| (DGIdb 4.0) |
| Entrez ID | Symbol | Category | Interaction Types | Drug Claim Name | Drug Name | PMIDs |
| Page: 1 |

Copyright 2023-Present -The University of Texas Health Science Center at Houston |